Federal data supports Duke research across disciplines.
Since January 31, 2025, Duke Libraries has received numerous reports of federal agencies removing access to data, altering existing research datasets, and purging data documentation. As we continue to monitor changes in access to federal data collections, I want to assure the Duke research community that we continue to work with colleagues in the curation, archives, and academic professional associations working to safeguard access and preservation of federal datasets.
This week (February 3, 2025), multiple data groups are meeting to plan coordination efforts for preserving the federal data record. Given the size and complexity of the federal government’s data holdings, early efforts are focused on identifying data at-risk and documenting existing efforts to ensure its preservation. Duke Libraries will continue to stay engaged through our institutional membership in the Data Curation Network and individual memberships in IASSIST and RDAP in these efforts. We will also continue to share news as this work evolves.
Resources for the Duke community
We realize that federal data access plays a fundamental role in advancing Duke research. We encourage you to contact askdata@duke.edu or your library subject specialist if you need advice on appropriate data sources or are unable to access the data that you need for research and/or teaching. We also welcome expressions of concern about access to federal data collections with the understanding that we are trying to focus our efforts (with data colleagues around the country) on federal data of particular importance to the Duke community.
We appreciate your concern, advocacy, and research efforts in this time. We look forward to working with you to ensure data access for the Duke community.
Students and researchers often ask CDVS for data on risk assessments of countries and risk comparisons between them. Some of the data sources relating to risk provide index numbers in downloadable tabular format measuring different aspects of risk, such as economic or political. They may include a few index numbers, or even thousands of nuanced indicators and changes over many years. Some of the sources provide graphic representations to compare different risk components, different countries, or changes over time. Other sources provide a more narrative discussion of risk, typically including tables and visuals, rather than downloadable datasets. The resources highlighted below present examples of each of these presentation methods and should provide researchers needing risk information with meaningful data.
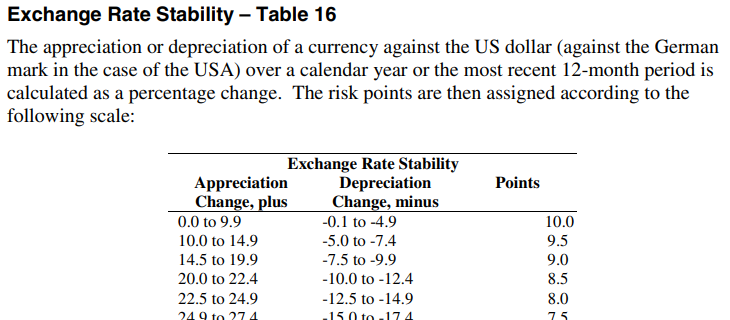
Covering 141 developed, emerging, and frontier countries, and offshore financial centers, ICRG presents monthly political, economic, financial and composite risk ratings and forecasts, provided in Excel format. The focus is on risks related to doing business in a country, although the index numbers have broader applicability. Index numbers fall within a 0-4 to a 0-12 range depending on the indicator, with the lower numbers for a given indicator representing more risk, and a codebook describes how the points are assigned.
For each country, the data includes monthly index numbers back to 1984. Duke has holdings of the Historical Political (Table 3B), Financial (4B), and Economic (5B) datasets, through 2016, which we occasionally update. The ICRG Researchers Dataset – Table 3B provides annual averages of the components of ICRG’s Political Risk Ratings (government stability, socioeconomic conditions, the investment profile, internal conflict, external conflict, corruption, military in politics, religions tensions, and law and order).
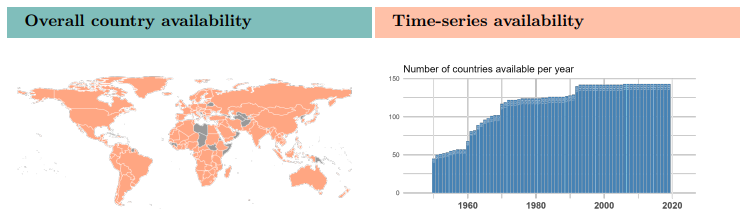
Variable availability by country, from Standard Dataset codebook
Compiled from open-source data, this free, extensive, and well-documented data collection includes their flagship Standard Dataset, with around 2100 variables. These are grouped into the following categories: Bureaucratic Structure, Civil Society/Population/Culture, Conflict, Education, Energy and Infrastructure, Environment, Gender Equality, Health, History, Judicial, Labour Market, Media, Migration, Political Parties and Elections, Political System, Private Economy, Public Economy, Quality of Government, Religion, and Welfare.
The Standard Dataset comes in a cross-section version, with recent data, and a time-series dataset covering 1946 to 2023. Formats include Stata (.dta), CSV, Excel (.xlsx), and SPSS (.sav). The codebook for the Standard Dataset is nearly 1700 pages. The QoG Basic Dataset contains the most frequently used variables from the Standard Dataset, and QOG also has datasets relating to the OECD, the EU, and for environmental indicators.
From the same company that creates the ICRG data (see above), the Political Risk Yearbooks provide a more narrative assessment of country-by-country risk factors, with probability forecasts for political, social, and economic trends for 100 countries.
The Political Rick Yearbooks are included in the Business Source Complete database from EBSCO since 2003. In the Advanced Search interface, choose the “SO Publication Name” field in the dropdown and search <Political Risk Yearbook [name of country]> to find issues from a particular country.
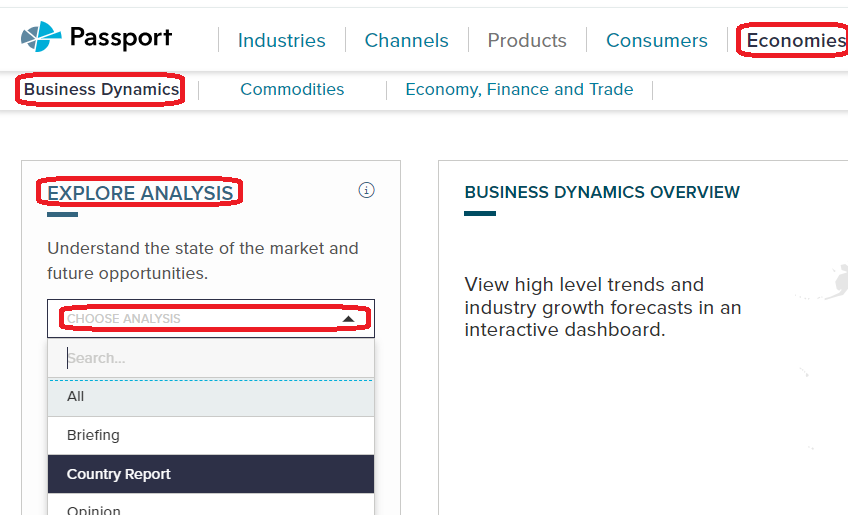
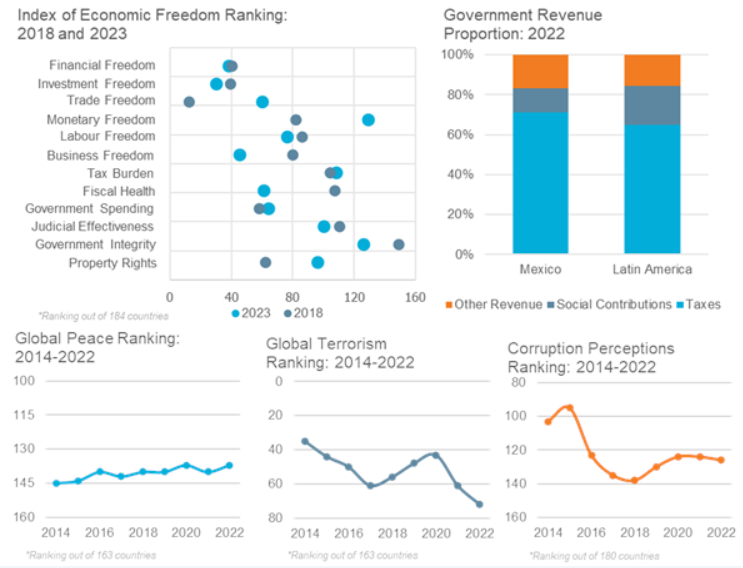
In Passport, Country Report is an option under several of the menus. One good assessment of risk can be found in the Country Reports under Economies … Business Dynamics. Under Explore Analysis, choose Country Reports in the Choose Analysis drop-down.
Also under the Economies tab, if you choose Economy, Finance and Trade, then choose Country Report under Explore Analysis as above, a useful report for risk outlook is the PEST analysis report (political, economic, social, and technological). These reports describe a framework of macro-environmental factors to use as a tools for environment scanning, understanding risks and opportunities, market growth or decline, business position, and potential and direction for operations, focusing on ways to help companies to become more competitive. The PEST reports discuss opportunities and challenges for each of the four facets.
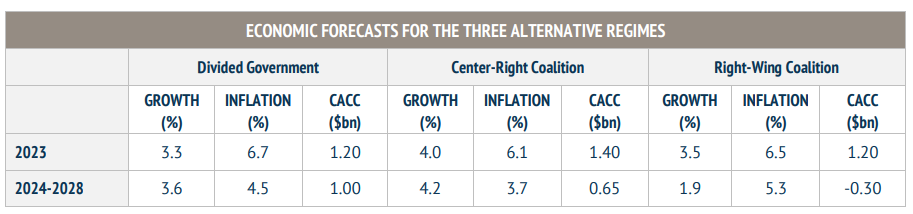
From a Country Report in Passport
You might find other useful assessments of risk in other reports in Passport, so feel free to explore. Charts and analysis in the reports draw data from IGOs like the IMF and the ILO, as well as from think tanks with an interest in economic and political freedom, like the Heritage Foundation. Be sure to check the sources they use in their reports.
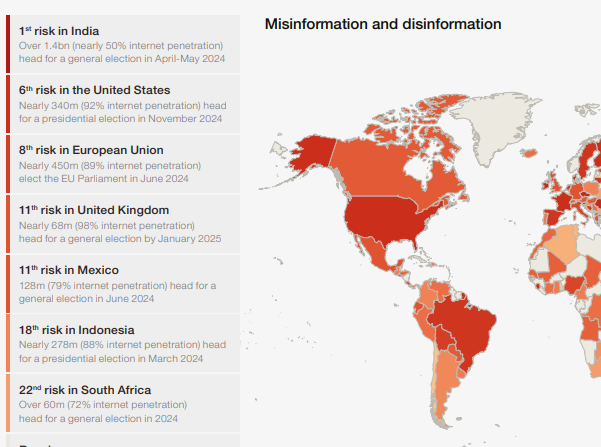
The annual Global Risks Report explores some of the most severe risks we may face in the coming years. Underpinned by the Forum’s Global Risks Perception Survey, the report brings together leading insights from over 1,200 experts across the world. The focus is on a narrative discussion of risks (economic, climate, political, etc.) facing the world as a whole, but there are some visuals or maps comparing countries or regions.
Each annual report has a summary with key findings. Data from the Perception Survey is presented as charts and graphs in the areas of Current Risks, Severity, the Global Risk Landscape, the Outlook for the World, Political Cooperation, Risk Governance, and Risk Profile. The WEF does not provide the actual raw data from the survey. “Shareables” include visuals on topics such as the “Top 10 Risks” and in “Interconnections” graphic of the global risks landscape.
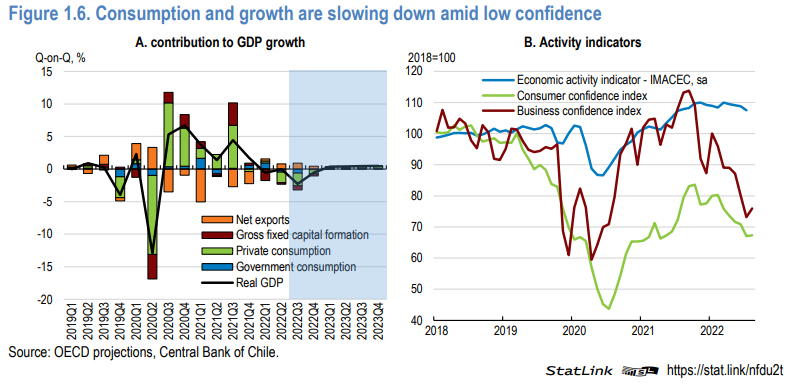
These country-level reports are thorough assessments of a country’s economy and its economic prospects. They are in PDF format, but the data used in the graphs and charts can be downloaded in Excel format from within the PDFs. The 100+ page reports cover OECD member countries and some leading trade partners (such as China) and are published frequently, although not necessarily every year. For some countries, the series goes back as far as 1962.
You’re probably aware that voting in the United States is managed in a very decentralized manner compared to most other countries. There are limited sources that comprehensively compile local-level results or geographic data showing local voting precincts. We’ll discuss several selected projects have come about to try to pull all this data together to provide one-stop repositories, as well as state and local sources for election data. Some of these are free resources, and some are licensed by us for the use of Duke affiliates.
Election Returns
The Princeton University Library has an excellent guide to elections returns and related data in their Elections and Voting Data Guide: United States (U.S.) and International, compiled by their Politics Librarian, Jeremy Darrington. This is a good first place to look for repositories of voting data, both U.S. and international. We’ll discuss a few of the most useful of these sources that the Duke community has access to.
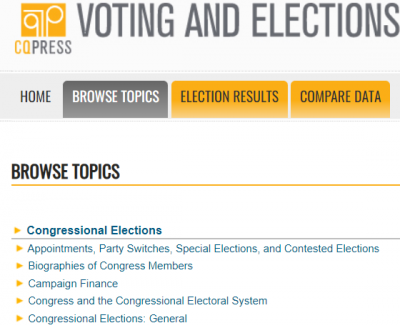
The CQ Voting and Elections Collection (Duke users only) has results data on Presidential, Congressional, and gubernatorial elections, some back to the 19th century. Results are generally given down to the county level of detail.
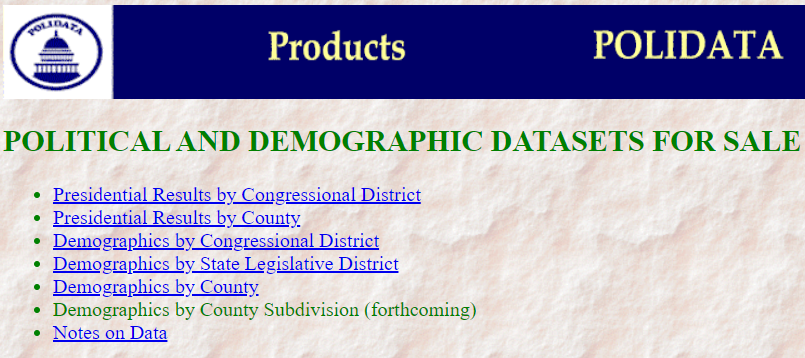
Polidata presents presidential election result data by congressional district and county in STATA, Excel, or CSV format, with data dictionaries as text files and documentation in PDF format. The Duke Libraries has obtained some of their data, curating the 1992-2008 District-level Polidata.
Geographic Data (GIS Layers)
Geographies that relate specifically to election data are Congressional or Legislative Districts, as well as voting precincts. The Census Bureau’s Voting Tabulation District (VTD) boundaries closely parallel precincts but are based on the Census Block geographies. They may not exactly match all locally created precincts, but may be all you can get electronically.
NHGIS (National Historical GIS) has the most election-related GIS boundary files, back to 1990 for VTDs, to 2000 for state legislative districts, and into the late 1980s for U.S. Congressional Districts. The Census Bureau has a scattered collection of these as well, at least for more recent years, usually on a state-by-state- or county-by-county (for the VTDs) basis. See either their web interface or their FTP site.
Election Results and GIS layers Together
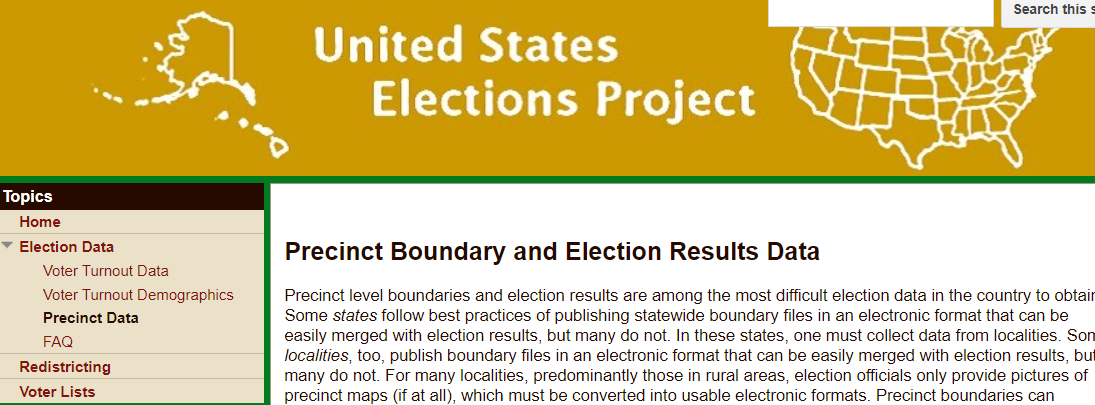
A good all-in-one source is The United States Elections Project, with lead contributors from the Voting and Election Science Team at the University of Florida and Wichita State University. It includes both election results and GIS shapefiles down to the precinct level, mostly from the last decade (as recently as some 2021 elections). For those interested in redistricting issues and gerrymandering, precinct-level data is essential.
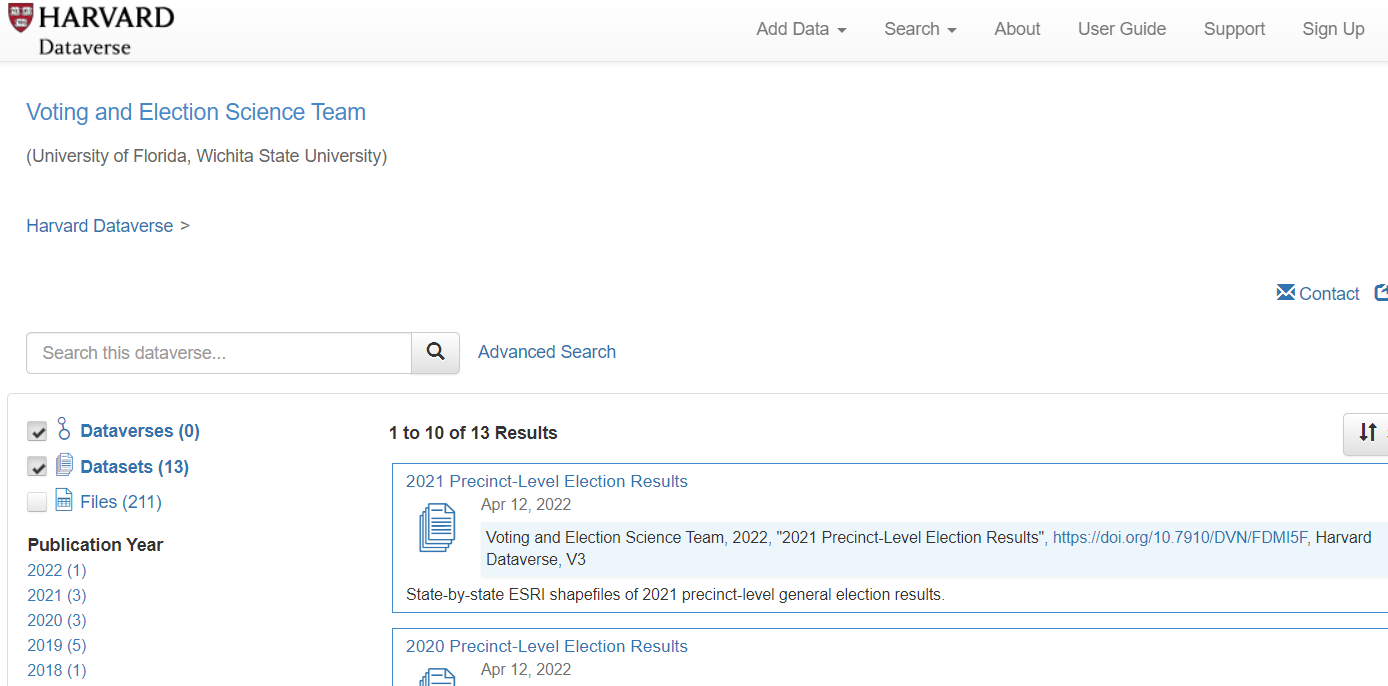
Their data is stored in the Harvard Dataverse, a data publishing platform that includes several election-related projects (election results and sometimes GIS files). It is a rich, if somewhat scattershot, repository with a lot of hidden gems. You can use the Advanced Search interface to find some of these datasets.
State and Local Sources
Sometimes, you need to find state, county, and city sources for election data, either for local elections or for geographically granular data results, like voting precincts. The National Association of Secretaries of State (NASS) website indexes the Secretaries of State websites, which may or may not have actual election results data.
The state elections offices may only have information on registration and on voting locations, but sometimes may include results data. For instance, the North Carolina State Board of Elections has some pretty thorough data at the precinct level for recent years, with good documentation.
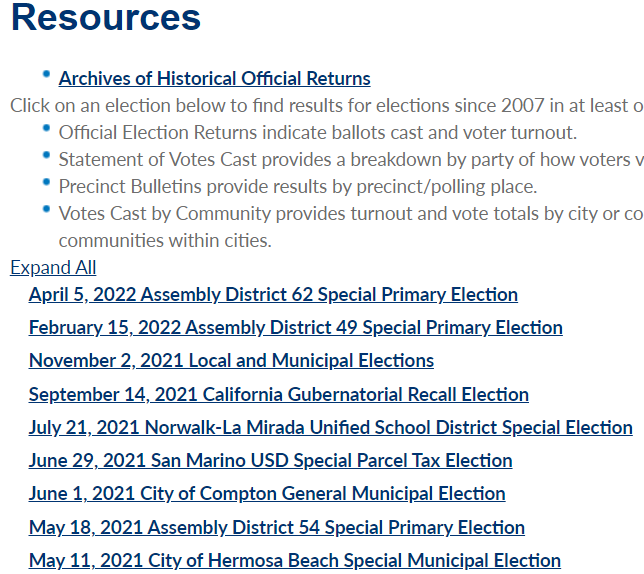
Some local governments are good about releasing election data at the precinct level. They may include data for such elections as municipal offices, school districts, and bond initiatives that you’d probably never find compiled at a national site. This example is from Los Angeles County.
Tools
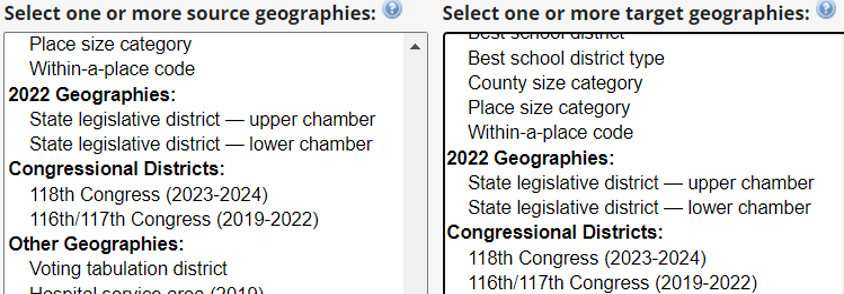
If you need statistical or GIS tools to analyze the data, be sure to contact us at askdata@duke.edu for advice. Here, I’ll mention the Geocorr utility at the Missouri Census Data Center, which you can use to reaggregate data into different geographic areas. You can create correspondence tables between geographies such as voting tabulation districts or legislative districts and Census geographies, say, if you need to analyze demographics and socioeconomic factors. The correspondence tables include weighting factors indicating the percent of one area within another.
We’ve only scratched the surface on the data sources related to U.S. elections. If you want more suggestions or have specialized needs not covered here, please contact us at askdata@duke.edu for other ideas.
The questions asked in the U.S. Census have changed over time to reflect both the data collecting needs of federal agencies and evolving societal norms. Census geographies have also evolved in this time period to reflect population change and shifting administrative boundaries in the United States.
Attempts to Provide Standardized Data
For the researcher who needs to compare demographic and socioeconomic data over time, this variability in data and geography can be problematic. Various data providers have attempted to harmonize questions and to generate standard geographies using algorithms that allow for comparisons over time. Some of the projects mentioned in this post have used sophisticated weighting techniques to make more accurate estimates. See, for instance, some of the NHGIS documentation on standardizing data from 1990 and from 2000 to 2010 geography.
NHGIS
The NHGIS Time Series Tables link census summary statistics across time and may require two types of integration: attribute integration, ensuring that the measured characteristics in a time series are comparable across time, and geographic integration, ensuring that the areas summarized by time series are comparable across time.
For attribute integration, NHGIS often uses “nominally integrated tables,” where the aggregated data is presented as it was compiled. For instance, comparing “Durham County” data from 1960 and 2000 based on the common name of the county.
For geographically standardized tables, when data from one year is aggregated to geographic areas from another year, NHGIS provides documentation with details on the weighting algorithms they use:
NHGIS has resolved discrepancies in the electronic boundary files, as they illustrate here (an area of Cincinnati).
Social Explorer
The Social Explorer Comparability Data is similar to the NHGIS Time Series Tables, but with more of a drill-down consumer interface. (Go to Tables and scroll down to the Comparability Data.) Only 2000 to 2010 data are available at the state, county, and census tract level. It provides data reallocated from the 2000 U.S. decennial census to the 2010 geographies, so you can get the earlier data in 2010 geographies for better comparison with 2010 data.
LTDB
The Longitudinal Tract Database (LTDB) developed at Brown University provides normalized boundaries at the census tract level for 1970-2010. Question coverage over time varies. The documentation for the project are available online:
NC State has translated this data into ArcGIS geodatabase format. They provide a README file, a codebook, and the geodatabase available for download.
Do-It-Yourself
If you need to normalize data that isn’t yet available this way, GIS software may be able to help. Using intersection and re-combining techniques, this software may be able to generate estimates of older data in more recent geographies. In ArcGIS, this involves setting the ratio policy when creating a feature layer, to allow apportioning numeric values in attributes among the various overlapping geographies. This involves an assumption of an even geographic distribution of the variable across the entire area (which is not as sophisticated as some of the algorithms used by groups such as NHGIS).
Another research strategy employs crosswalks to harmonize census data over time. Crosswalks are tables that let you proportionally assign data from one year to another or to re-aggregate from one type of geography to another. Some of these are provided by the NHGIS geographic crosswalk files, the Census Bureau’s geographic relationship files, and the Geocorr utility from the Missouri Census Data Center.
You can contact CDVS at askdata@duke.edu to inquire about the options for your project.
With the launch of the Duke University Energy Intiative (EI) several years ago, the Center for Data and Visualization Sciences (CDVS) has seen an increased demand for all sorts of data and information related to energy generation, distribution, and pricing. The EI is a university-wide, interdisciplinary hub that advances an accessible, affordable, reliable, and clean energy system. It involves researchers and students from the Pratt School of Engineering, the Nicholas School of the Environment, the Sanford School of Public Policy, the Duke School of Law, the Fuqua School of Business, and departments in the Trinity College of Arts & Sciences.
The EI website provides links to energy-related data sources, particularly datasets that have proven useful in Duke energy research projects. We will discuss below some more key sources for finding energy-related data.
Energy resources and potentials
The sources for locating energy data will vary depending on the type of energy and the spot on the source-to-consumption continuum that interests you.
The US Department of Energy’s (DoE’s) Energy Information Administration (EIA) has a nice outline of energy sources, with explanations of each, in their Energy Explainedweb pages. These include nonrenewable sources such as petroleum, gas, gas liquids, coal, and nuclear. The EIA also discusses a number of renewable sources such as hydropower (e.g., dams, tidal, or wave action), biomass (e.g., waste or wood), biofuels (e.g., ethanol or biodiesel), wind, geothermal, and solar. Hydrogen is another fuel source discussed on these pages.
Besides renewability, a you might be interested in a source’s carbon footprint. Note that some of the sources the EIA lists as renewables may be carbon creating (such as biomass or biofuels), and some non-renewables may be carbon neutral (such as nuclear). Any type of energy source clearly has environmental implications, and the Union of Concerned Scientists has a discussion of the Environmental Impacts of Renewable Energy Technologies.
The US Geological Survey’s Energy Resources Program measures resource potentials for all types of energy sources. The Survey is a great place to find data relating to their traditional focus of fossil fuel reserves, but also for some renewables such as geothermal. The EIA provides access to GIS layers relating to energy, not only reserves and renewable potentials, but also infrastructure layers.
The DOE’s Office of Scientific and Technical Information (OSTI) is well known as a repository of technical reports, but it also hosts the DOE Data Explorer. This includes hidden gems like the REPLICA database (Rooftop Energy Potential of Low Income Communities in America), which has geographic granularity down to the Census Tract level.
For more on renewables, check out the NREL (National Renewable Energy Laboratory), which disseminates GIS data relating to renewable energy in the US (e.g., wind speeds, wave energy, solar potential), along with some international data. The DoE’s Open Data Catalog is also particularly strong on datasets (tabular and GIS) relating to renewables. The data ranges from very specific studies to US nationwide data.
REexplorer, showing wind speed in Kenya
For visualizing energy-related map layers from selected non-US countries, the Renewable Energy Data Explorer (REexplorer) provides an online mapping tool. Most layers can be downloaded as GIS files. The International Renewable Energy Agency (IRENA) also has statistics on renewables. Besides downloadable data, summary visualizations can be viewed online using Tableau Dashboards.
Price and production data
The US DOE “Energy Economy” web pages will introduce you to all things relating to the economics of energy, and their EIA (mentioned above) is the main US source for fossil fuel pricing, from both the production and the retail standpoint.
Internationally, the OECD’s International Energy Agency (IEA) collects supply, demand, trade, production and consumption data, including price and tax data, relating to oil, gas, and coal, as well as renewables. In the OECD iLibrary go to Statistics tab to find many detailed IEA databases as well as PDF book series such as World Energy Balances, World Energy Outlook, and World Energy Statistics. For more international data (particularly in the developing world), you might want to try Energydata.info. This includes geospatial data and a lot on renewables, especially solar potential.
Finally, a good place to locate tabular data of all sorts is the database ProQuest Statistical Insight. It indexes publications from government agencies at all levels, IGOs and NGOs, and trade associations, usually providing the data tables or links to the data.
Infrastructure (Generation, Transportation/Distribution, and Storage)
ArcGIS Pro using EPA’s eGRID data
Besides the EIA’s GIS layers relating to energy, mentioned above, another excellent source for US energy infrastructure data is the Homeland Infrastructure Foundation-Level Data (HIFLD), which includes datasets on energy infrastructure from many government agencies. These include geospatial data layers (GIS data) for pipelines, power plants, electrical transmission and more. For US power generation, the Environmental Protection Agency has their Emissions & Generation Resource Integrated Database (eGRID). eGRID data includes the locations of all types of US electrical power generating facilities, including fuel used, generation capacity, and detailed effluent data. For international power plant data, the World Resources Institute’s (WRI’s) Global Power Plant Database includes data on around 30,000 plants, and some of WRI’s other datasets also relate to energy topics.
Energy storage can include the obvious battery technologies, but also pumped hydroelectric systems and even more novel schemes. The US DoE has a Global Energy Storage Database with information on “grid-connected energy storage projects and relevant state and federal policies.”
Businesses
For data or information relating to individual companies in the energy sector, as well as for more qualitative assessments of industry segments, you can begin with the library’s Company and Industry Research Guide. This leads to some of the key business sources that the Duke Libraries provide access to.
Trade Associations
Trade associations that promote the interests of companies in particular industries can provide effective leads to data, particularly when you’re having trouble locating it from government agencies and IGOs/NGOs. If they don’t provide data or much other information on their websites, be sure to contact them to see what they might be willing to share with academic researchers. Most of the associations below focus on the United States, but some are global in scope.
These are just a few of the sources and strategies for locating data on energy. For more assistance, please contact the Center for Data and Visualization Sciences: askdata@duke.edu
As data driven research has grown at Duke, Data and Visualization Services receives an increasing number of requests for partnerships, instruction, and consultations. These requests have deepened our relationships with researchers across campus such that we now regularly interact with researchers in all of Duke’s schools, disciplines, and interdepartmental initiatives.
In order to expand the Libraries commitment to partnering with researchers on data driven research at Duke, Duke University Libraries is elevating the Data and Visualization Services department to the Center for Data and Visualization Sciences (CDVS). The change is designed to enable the new Center to:
Expand partnerships for research and teaching
Augment the ability of the department to partner on grant, development, and funding opportunities
Develop new opportunities for research, teaching, and collections – especially in the areas of data science, data visualization, and GIS/mapping research
Recognize the breadth and demand for the Libraries expertise in data driven research support
Enhance the role of CDVS activities within Bostock Libraries’ Edge Research Commons
We believe that the new Center for Data and Visualization Sciences will enable us to partner with an increasingly large and diverse range of data research interests at Duke and beyond through funded projects and co-curricular initiatives at Duke. We look forward to working with you on your next data driven project!
The Data and Visualization Services (DVS) Department can help you locate and extract many types of data, including data about companies and industries. These may include data on firm location, aggregated data on the general business climate and conditions, or specific company financials. In addition to some freely available resources, Duke subscribes to a host of databases providing business data.
Directories of Business Locations
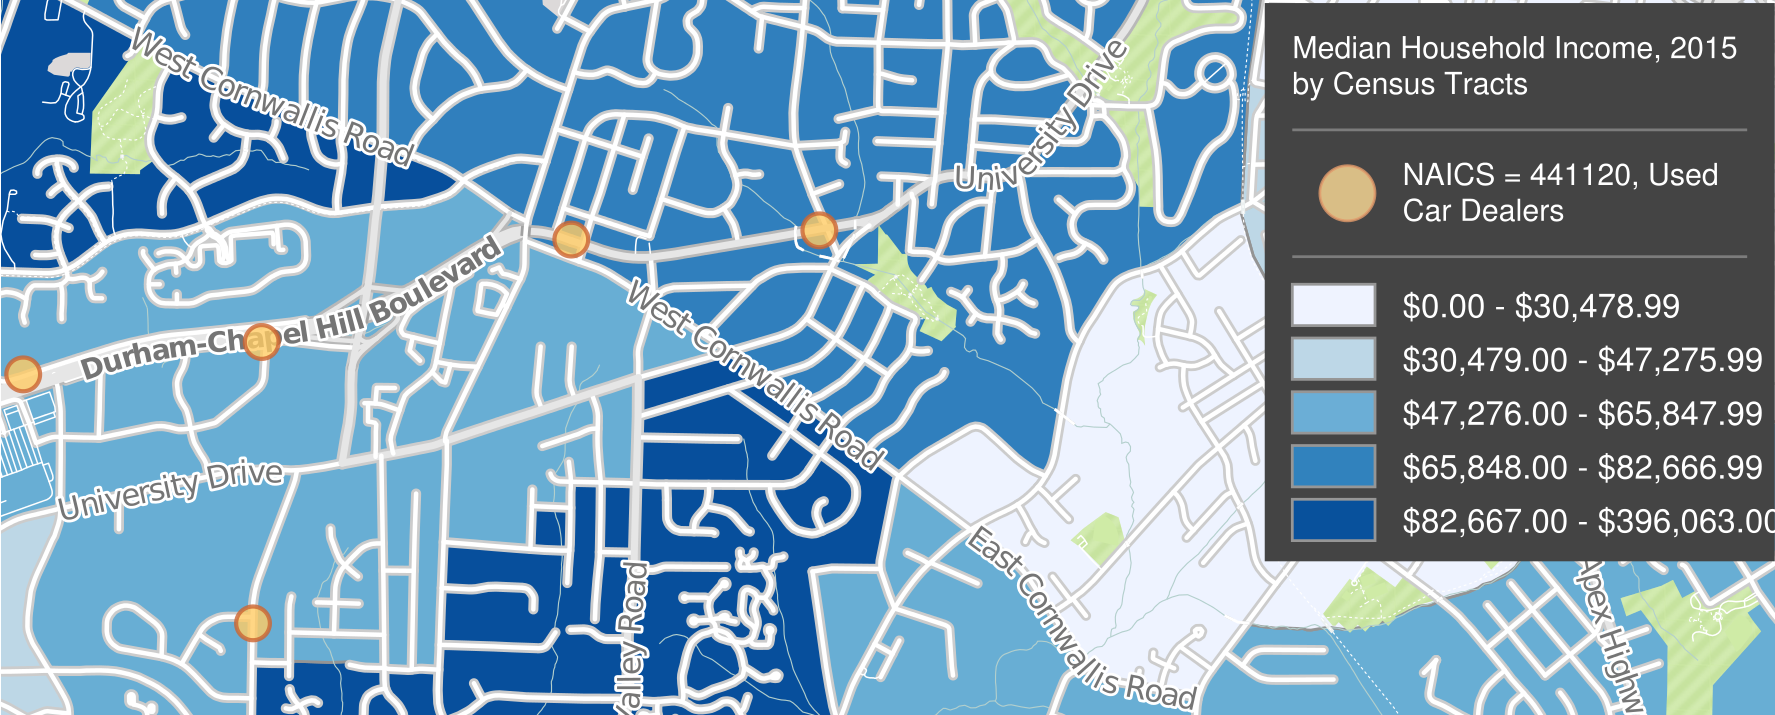
You may need to identify local outlets and single-location companies that sell a particular product or provide a particular service. You may also need information on small businesses (e.g., sole proprietorships) and private companies, not just publicly traded corporations or contact information for a company’s headquarters. A couple of good sources for such local data are the ReferenceUSA Businesses Database and SimplyAnalytics.
From these databases, you can extract lists of locations with geographic coordinates for plotting in GIS software, and SimplyAnalytics also lets you download data already formatted as GIS layers. Researchers often use this data when needing to associate business locations with the demographics and socio-economic characteristics of neighborhoods (e.g., is there a lack of full-service grocery stores in poor neighborhoods?).
SimplyAnalytics
When searching these resources (or any business data source), it often helps to use an industry classification code to focus your search. Examples are the North American Industry Classification System (NAICS) and the Standard Industrial Classification (SIC) (no longer revised, but still commonly used). You can determine a code using a keyword search or drilling down through a hierarchy.
Aggregated Business and Marketing Data
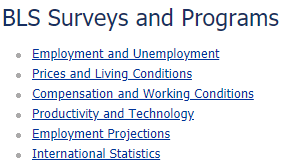
Government surveys ask questions of businesses or samples of businesses. The data is aggregated by industry, location, size of company, and other criteria and typically include information on the characteristics of each industry, such as employment, wages, and productivity.
Macroeconomic indicators relate to the overall business climate, and a good source for macro data is Global Financial Data. Its data series includes many stock exchange and bond indexes from around the world.
Private firms also collect market research data through sample surveys. These are often from a consumer perspective, for instance to help gauge demand for specific products and services. Be aware that the numbers for small geographies (e.g., Census Tracts or Block Groups) are typically imputed from small nationwide samples, based on correlations with demographic and socioeconomic indicators. Examples of resources with such data are SimplyAnalytics (with data from EASI and Simmons) and Statista (mostly national-level data).
Firm-Level Data
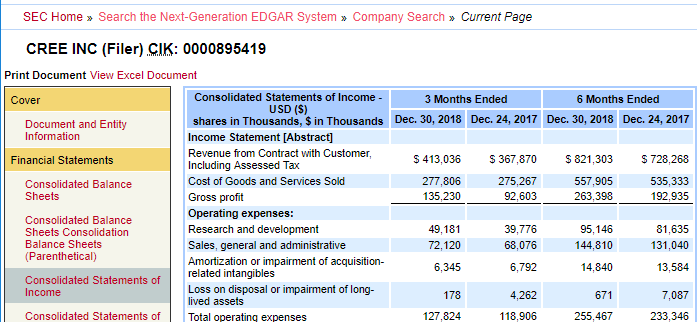
You may be interested in comparing numbers between companies, ranking them based on certain indicators, or gathering time-series data on a company to follow changes over time. Always be aware of whether the company is a publicly traded corporation or is privately held, as the data sources and availability of information may vary.
Their EDGAR service is the source of the corporate financials repackaged by commercial data providers, and you might find additional context and narrative analysis with products such as Mergent Online, Thomson One, or S&P Global NetAdvantage. The Bloomberg Professional Service in the DVS computer lab contains a vast amount of data, news, and analysis on firms and economic conditions worldwide. You can find many more sources for firm- and industry-specific data from the library’s guide on Company and Industry Research, and of course at the Ford Library at the Fuqua School of Business.
All of these sources provide tabular download options.
For help finding any sort of business or industry data, don’t hesitate to contact us at askdata@duke.edu.
Helping Duke students, staff and faculty to locate data is something that we in Data and Visualization Services often do. In this blog post I will walk you through a sample search and share some tips that I use when I search for data and statistics.
“Hi there, I am looking for motorcycle registration numbers and sales volumes by age and sex for the United States.”
BREAKING DOWN THE QUESTION:
There are two types of data needed: motorcycle registration data and motorcycle sales data. There are two criteria that the data should be differentiated by: owner’s age and owner’s gender.
There is a geographic component: United States.
One criteria that is not given is time. When a time frame isn’t provided, I assume that what is needed is the most current data available. Something to consider is that “current” often will still be a year or more old. It takes time for data to be gathered, cleaned and published.
***Pro-tip: When you are looking for data consider who/what/when and where – adding in those components makes it easier to construct your search.***
WHERE AND HOW DO I SEARCH?
If I do not immediately have a source in mind (and sometimes even if I do, just to hit all the bases) I will use Google and structure my search as follows: motorcycle sales and registration by age and gender united states.
***Pro-tip: You can use Google (or search engine of your choice) to search across things we subscribe to and the open Web, but you will need to be connected via a Duke IP address***
EVALUATING RESULTS
One of the first results returned is from a database we subscribe to called Statistia. This source gives me the number of motorcycle owners by age in 2018, which answers part of the question, but does not include sales information or gender breakdown.
Another top result is a report on Motorcycle Trends in the United States from the Bureau of Transportation Statistics (BTS). Unfortunately, the report is from 2009 and the data cited in the article are from 2003-2007. A search of the BTS site does not yield any thing more current. However, when I check the source list at the bottom of the report, there are several listed that I will check directly once I’ve finished looking through my search results.
***Pro-tip: Always look for sources of data in reports and figures, even if the data are old. Heading to the source can often yield more current information.***
A third result that looks promising is from a motorcycling magazine: Motorcycle Statistics in America: Demographics Change for 2018. The article reports on statistics from the 2018 owner surveys conducted by the Motorcycle Industry Council (which is one of the sources that the Bureau of Transportation report listed). This article provides the percent of males and females that own motorcycles as well as the median age of motorcycle owners. While this is pretty close to the data needed, it is worthwhile to look into the Motorcycle Industry Council. Experience has taught me, however, that industry data typically is neither open nor freely available.
CHECKING THE COMMON SOURCE
When I go to the Motorcycle Industry Council (MIC) Web site I find that they do, indeed, have a statistical report that comes out every year which gives a comprehensive overview of the motorcycle industry. If you are not a member, you can buy a copy of the report, but it is expensive (nearly $500).
***Pro-tip: Always check the original source even if you anticipate that there may be a paywall – it’s a good idea to evaluate all sources to ensure that they are credible and authoritative.***
MAKING A DECISION
In this instance, I would ultimately advise the person to use the statistics reported in the article Motorcycle Statistics in America: Demographics Change for 2018. Secondary sources aren’t ideal, and can sometimes be complicated to cite, but when you can’t get access to the primary source and that primary source is the authority, it is your best bet.
***Pro-tip: If you are using a secondary source, you should name the original source in text. For example: Data from the 2018 Motorcycle Industry Council Owner Survey (as cited by Ultimate Motorcycling, 2019) but include a citation to the secondary source in your reference list according to the formatting of the style you are using.
PARTING THOUGHTS
In closing, the data you want might not always be the data you use – either due to the data being proprietary, restricted, or perhaps just doesn’t exist or doesn’t exist in the form you need and/or are able to use. When this happens, take a moment to think on your research question and determine if you have the time and the resources needed to continue pursuing your question as it stands (purchasing, requesting, applying for, or collecting your own data), or if you need to broaden or change your focus to incorporate the resources you do find in a meaningful way.
Data and Visualization Services is happy to announce its Fall 2016 Workshop Series. Learn new ways of enhancing your research with a wide range of data driven research methods, data tools, and data sources.
Can’t attend a session? We record and share most of our workshops online. We are also happy to consult on any of the topics above in person. We look forward to seeing you in the workshops, in the library, or online!
Data and Visualization Services is happy to announce its Fall 2015 Workshop Series. With a range of workshops covering basic data skills to data visualization, we have a wide range of courses for different interests and skill levels.. New (and redesigned) workshops include:
OpenRefine: Data Mining and Transformations, Text Normalization
Historical GIS
Advanced Excel for Data Projects
Analysis with R
Webscraping and Gathering Data from Websites
Workshop descriptions and registration information are available at: