
Visualizing spatial data can be challenging to learn. Specialized software tools like ArcGIS produce excellent results, but often seem complex for relatively simple tasks. Several online tools have emerged recently and provide relatively easy alternatives for the display of spatial data. In this ongoing series of alternatives, we review Tableau Public 7 in detail. Go to this guide to see a comparison chart of packages and features, and see this Duke University Libguide for a more detailed review of Tableau 6.1.
Tableau Public (link)
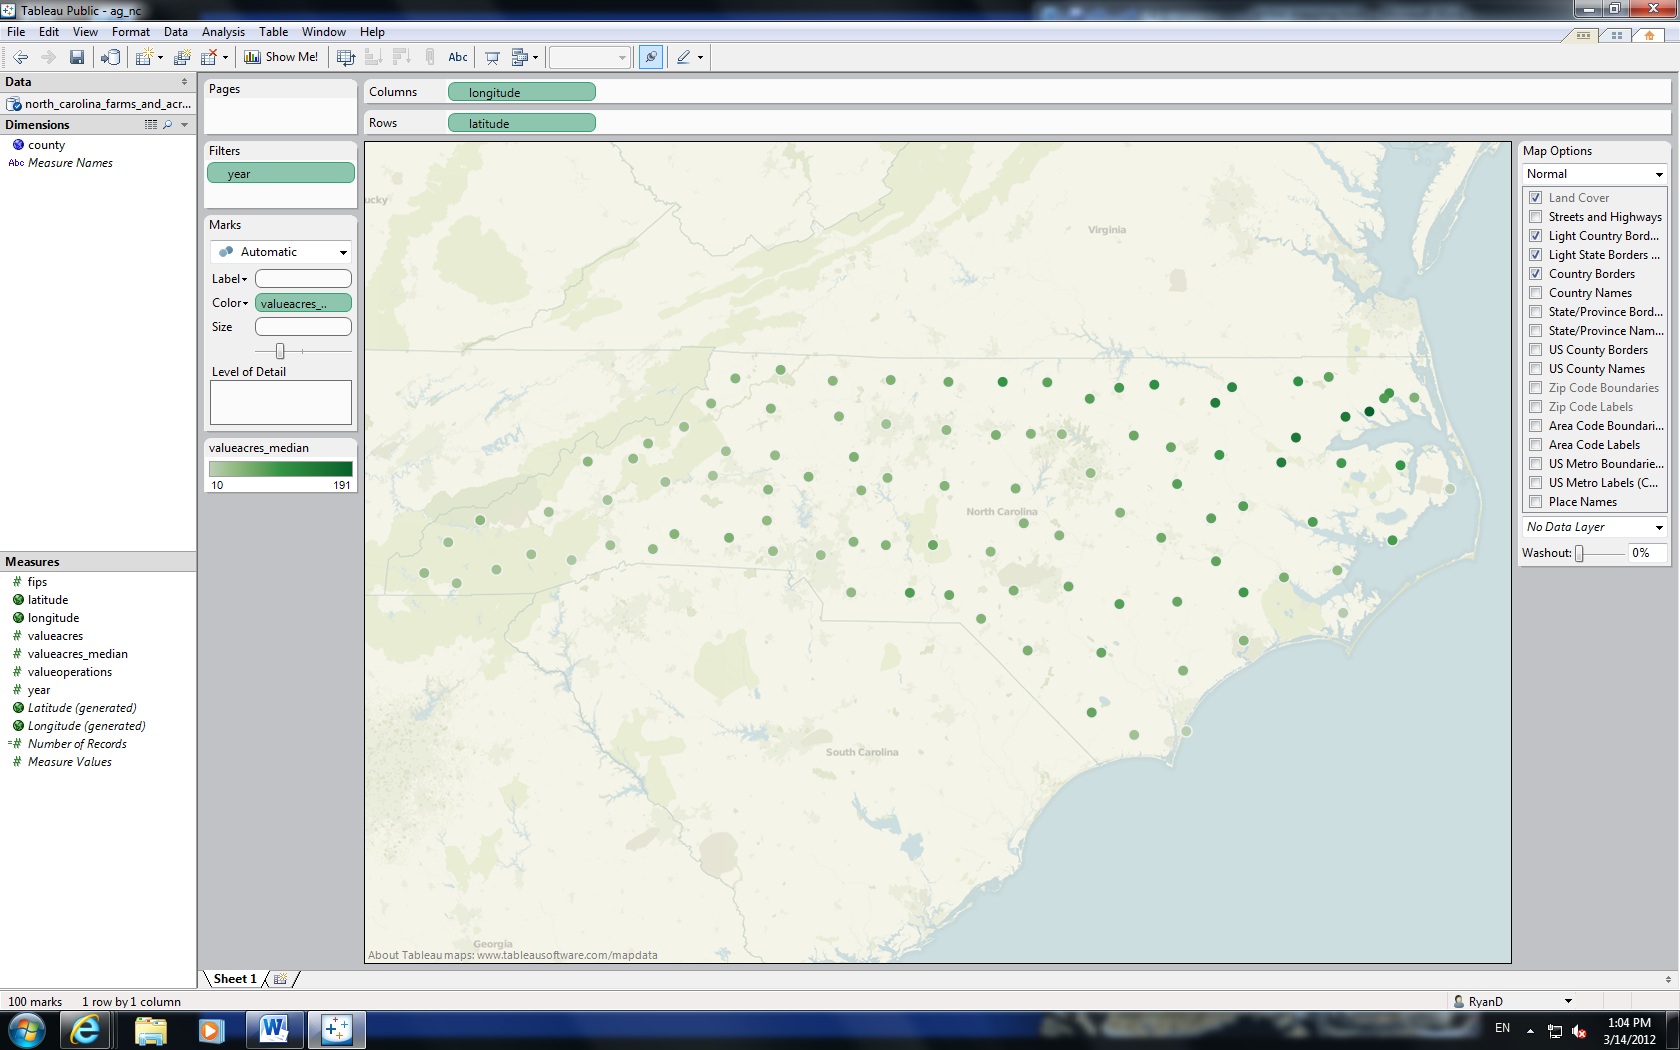
Tableau Public is a free software application that allows you to easily map data and share maps through email or web pages by embeddable script. To use Tableau, you must download and install a free desktop application. Tableau Public also requires a free registration to share visualizations created in the software.
Tableau is designed to look and feel like a standard spreadsheet application. Geographic mapping is accomplished by dragging your coordinate fields and dropping them into the columns and rows fields (see Figure 1). In Tableau 7, you may also select “Filled Map” under the Marks panel, and select a geographic identifier for the “Level of Detail” field (see Figure 2). Once done, add the variable to color by to the color field. In these examples, more intense colors indicate larger median farm size, measured in acres.

Geocoding
Tableau generates new fields that hold coordinate data as it imports and geocodes your data. If you wish to create filled maps (states, counties, etc.) in Tableau 7, you must additionally have geographic identifiers that are unique for each case. In Figure 2, the initial map only contained 50 polygons, as 50 North Carolina counties were uniquely named within the United States.
Had I also included a state field, unique identification would have been automatic, but Tableau allowed me to define the state for each case, and lucky for me, I only had North Carolina data.
The geocoding options are extensive. The following list is not exhaustive: area codes, FIPS codes, county/state/country names, ZIP codes, and ISO country codes. Of course, any coordinate data will work for point data.
Sharing
Sharing on a web page is accomplished through embeddable Javascript. Sadly, I was unable to get Tableau to work within WordPress, but you may see a live version of this map by following this link.
Other Notes
Tableau is very easy to use, provided your data is reasonably clean. With geographic data, be certain to either have something that uniquely identifies each entity or have latitudes and longitudes. It is preferable to err on the side of including more identification fields rather than less (i.e. including state names in addition to counties).
Also be aware that Tableau is not backward-compatible. For example, the workbook used in this example was initially created in Tableau 6.1, modified in Tableau 7, but failed to open once I moved back to Tableau 6.1. However, irrespective of version, you will be able to see any visualizations produced in any version.