
 How do you support 57,860 online students learning R and statistics ? Late last fall, Data and GIS Services shared this challenge with Professor Mine Çetinkaya-Rundel and the staff of CIT as we sought to translate Professor Çetinkaya-Rundel’s successful Statistics 101 course to a Coursera class on Data Analysis and Statistical Inference. While Data and GIS Services has supported Statistics 101 students for several years identifying appropriate data and using the R statistical language for their assignments, the scale of the Coursera course introduced new challenges of trying to provide engaging data to a very large audience without having the opportunity to provide direct support to everyone in the class.
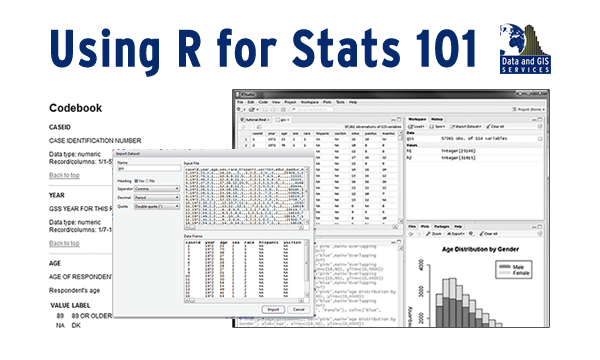
In our initial meetings with Professor Çetinkaya-Rundel, she requested that Data and GIS create data collections for the course that would provide easy access in R and would include a range of statistical measures that would appeal to the diverse audience in the class. The first challenge — easy access to R — required some translation work. While R excels in its flexibility, graphics, and statistical power, it lacks some of the built in data documentation features present in other statistical packages. This project prompted Data and GIS to reconsider how to provide documentation and pre-formatted R data to an audience that would likely be unfamiliar with R and data documentation.
The second challenge — finding data that covered a wide range of interesting topics — proved much easier. The General Social Survey with its diverse and engaging questions on a wide range of topics proved to be an easy choice for the class. The American National Election Studies, also offered a diverse set of measures of public opinion that suited the course well. With these challenges identified and addressed, we spent the end of 2013 selecting portions of the data for class (subsetting), abridging the data documentation for instructional use, and transforming the data to address its usage in an online setting (processing missing values for R, creating factor variables).
As Professor Çetinkaya-Rundel’s class launches on February 17th, this project has given us a new appreciation of providing data and statistical services in a MOOC while also building course materials that we are using in Statistics 101 at Duke. While students begin the Coursera course on Data Analysis and Statistical Inference, students in Professor Kari Lock Morgan’s Statistics 101 class will use these data in their on-campus Duke course as well. We hope that both collections will reduce some of the technological hurdles that often confront courses using R as well as improving statistical literacy at Duke and beyond.