Felipe Álvarez de Toledo López-Herrera is a Ph.D. candidate at the Art, Art History, and Visual Studies Department at Duke University and a Digital Humanities Graduate Assistant for Humanities Unbounded, 2019-2020. Contact him at askdata@duke.edu.
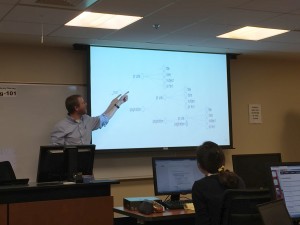
Over the 2019-2020 academic year, I am serving as a Humanities Unbounded graduate assistant in Duke Libraries’ Center for Data and Visualization Sciences. As one of the three Humanities Unbounded graduate assistants, I will partner on Humanities Unbounded projects and focus on developing skills that are broadly applicable to support humanities projects at Duke. In this blog post, I would like to introduce myself and give readers a sense of my skills and interests. If you think my profile could address some of the needs of your group, please reach out to me through the email above!
My own dissertation project began with a data dilemma. 400 years ago, paintings were shipped across the Atlantic by the thousands. They were sent by painters and dealers in places like Antwerp or Seville, for sale in the Spanish colonies. But most of these paintings were not made to last. Cheap supports and shifting fashions guaranteed a constant renewal of demand, and thus more work for painters, in a sort of proto-industrial planned obsolescence.[1]As a consequence, the canvas, the traditional data point of art history, was not a viable starting point for my own research, rendering powerless many of the tools that art history has developed for studying painting. I was interested in examining the market for paintings as it developed in Seville, Spain from 1500-1700; it was a major productive center which held the idiosyncratic role of controlling all trade to the Spanish colonies for more than 200 years. But what could I do when most of the work produced within it no longer exists?
This problem drives my research here at Duke, where I apply an interdisciplinary, data-driven approach. My own background is the product of two fields: I obtained a bachelor’s degree in Economics in my hometown of Barcelona, Spain in 2015 from the Universitat Pompeu Fabra, and simultaneously attended art history classes in the University of Barcelona. This combination found a natural mid-way point in the study of art markets. I came to Duke to be a part of DALMI, the Duke, Art, Law and Markets Initiative, led by Professor Hans J. Van Miegroet, where I was introduced to the methodologies of data-driven art historical research.
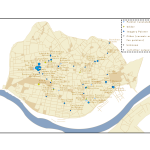
Documents in Seville’s archives reveal a stunning diversity of production that encompasses the religious art for which the city is known, but also includes still lives, landscapes and genre scenes whose importance has been understated and of which few examples remain [Figures 1 & 2]. But analysis of individual documents, or small groups of them, yields limited information. Aggregation, with an awareness of the biases and limitations in the existing corpus of documents, seems to me a way to open up alternative avenues for research. I am creating a database of painters in the city of Seville from 1500-1699, where I pool known archival documentation relating to painters and painting in this city and extract biographical, spatial and productive data to analyze the industry. I explore issues such as the industry’s size and productive capacity, its organization within the city, reactions to historical change and, of course, its participation in transatlantic trade.
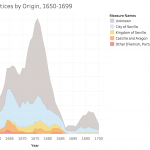
This approach has obliged me to become familiar with a wide range of digital tools. I use OpenRefine for cleaning data, R and Stata for statistical analysis, Tableau for creating visualizations and ArcGIS for visualizing and generating spatial data (see examples of my own work below [Figures 3-4]). I have also learned the theory behind relational databases and am learning to use MySQL for my own project; similarly, for the data-gathering process I am interested in learning data-mining techniques through machine learning. I have been using a user-friendly software called RapidMiner to simplify some of my own data gathering.


Thus, I am happy to help any groups that have a data set and want to learn how to visualize it graphically, whether through graphs, charts or maps. I am also happy to help groups think about their data gathering and storage. I like to consider data in the broadest terms: almost anything can be data, if we correctly conceptualize how to gather and utilize it realistically within the limits of a project. I would like to point out that this does not necessarily need to result in visualization; this is also applicable if a group has a corpus of documents that they want to store digitally. If any groups have an interest in text mining and relational databases, we can learn simultaneously—I am very interested in developing these skills myself because they apply to my own project.
I can:
- Help you consider potential data sources and the best way to extract the information they contain
- Help you make them usable: teach you to structure, store and clean your data
- And of course, help you analyze and visualize them
- With Tableau: for graphs and infographics that can be interactive and can easily be embedded into dashboards on websites.
- With ArcGIS: for maps that can also be interactive and embedded onto websites or in their Stories function.
- Help you plan your project through these steps, from gathering to visualization.
Once again, if you think any of these areas are useful to you and your project, please do not hesitate to contact me. I look forward to collaborating with you!
[1]Miegroet, Hans J. Van, and Marchi, ND. “Flemish Textile Trade and New Imagery in Colonial Mexico (1524-1646).” Painting for the Kingdoms. Ed. J Brown. Fomento Cultural BanaMex, Mexico City, 2010. 878-923.