Tag Archives: data

CDVS Chat or Zoom for Online Data Advice

As students and classes moved online in the spring of 2020, the Center for Data and Visualization Sciences realized that it was time to expand our existing email (askdata@duke.edu) and lab based consultation services to meet the data demands of online learning and remote projects. Six months and hundreds of online consultations later, we have developed a new appreciation for the online tools that allow us to partner with Duke researchers around the world. Whether you prefer to chat, zoom, or email, we hope to work with you on your next data question!

Chat


Ever had a quick question about how to visualize or manage your data, but weren’t sure where to get help? Having trouble figuring out how to get the data software to do what you need for class/research? CDVS offers roughly thirty hours of chat support each week.  Data questions on chat cover our full range of data support. If we cannot resolve a question in the chat session, we will make a referral for a more extended consultation.

Zoom

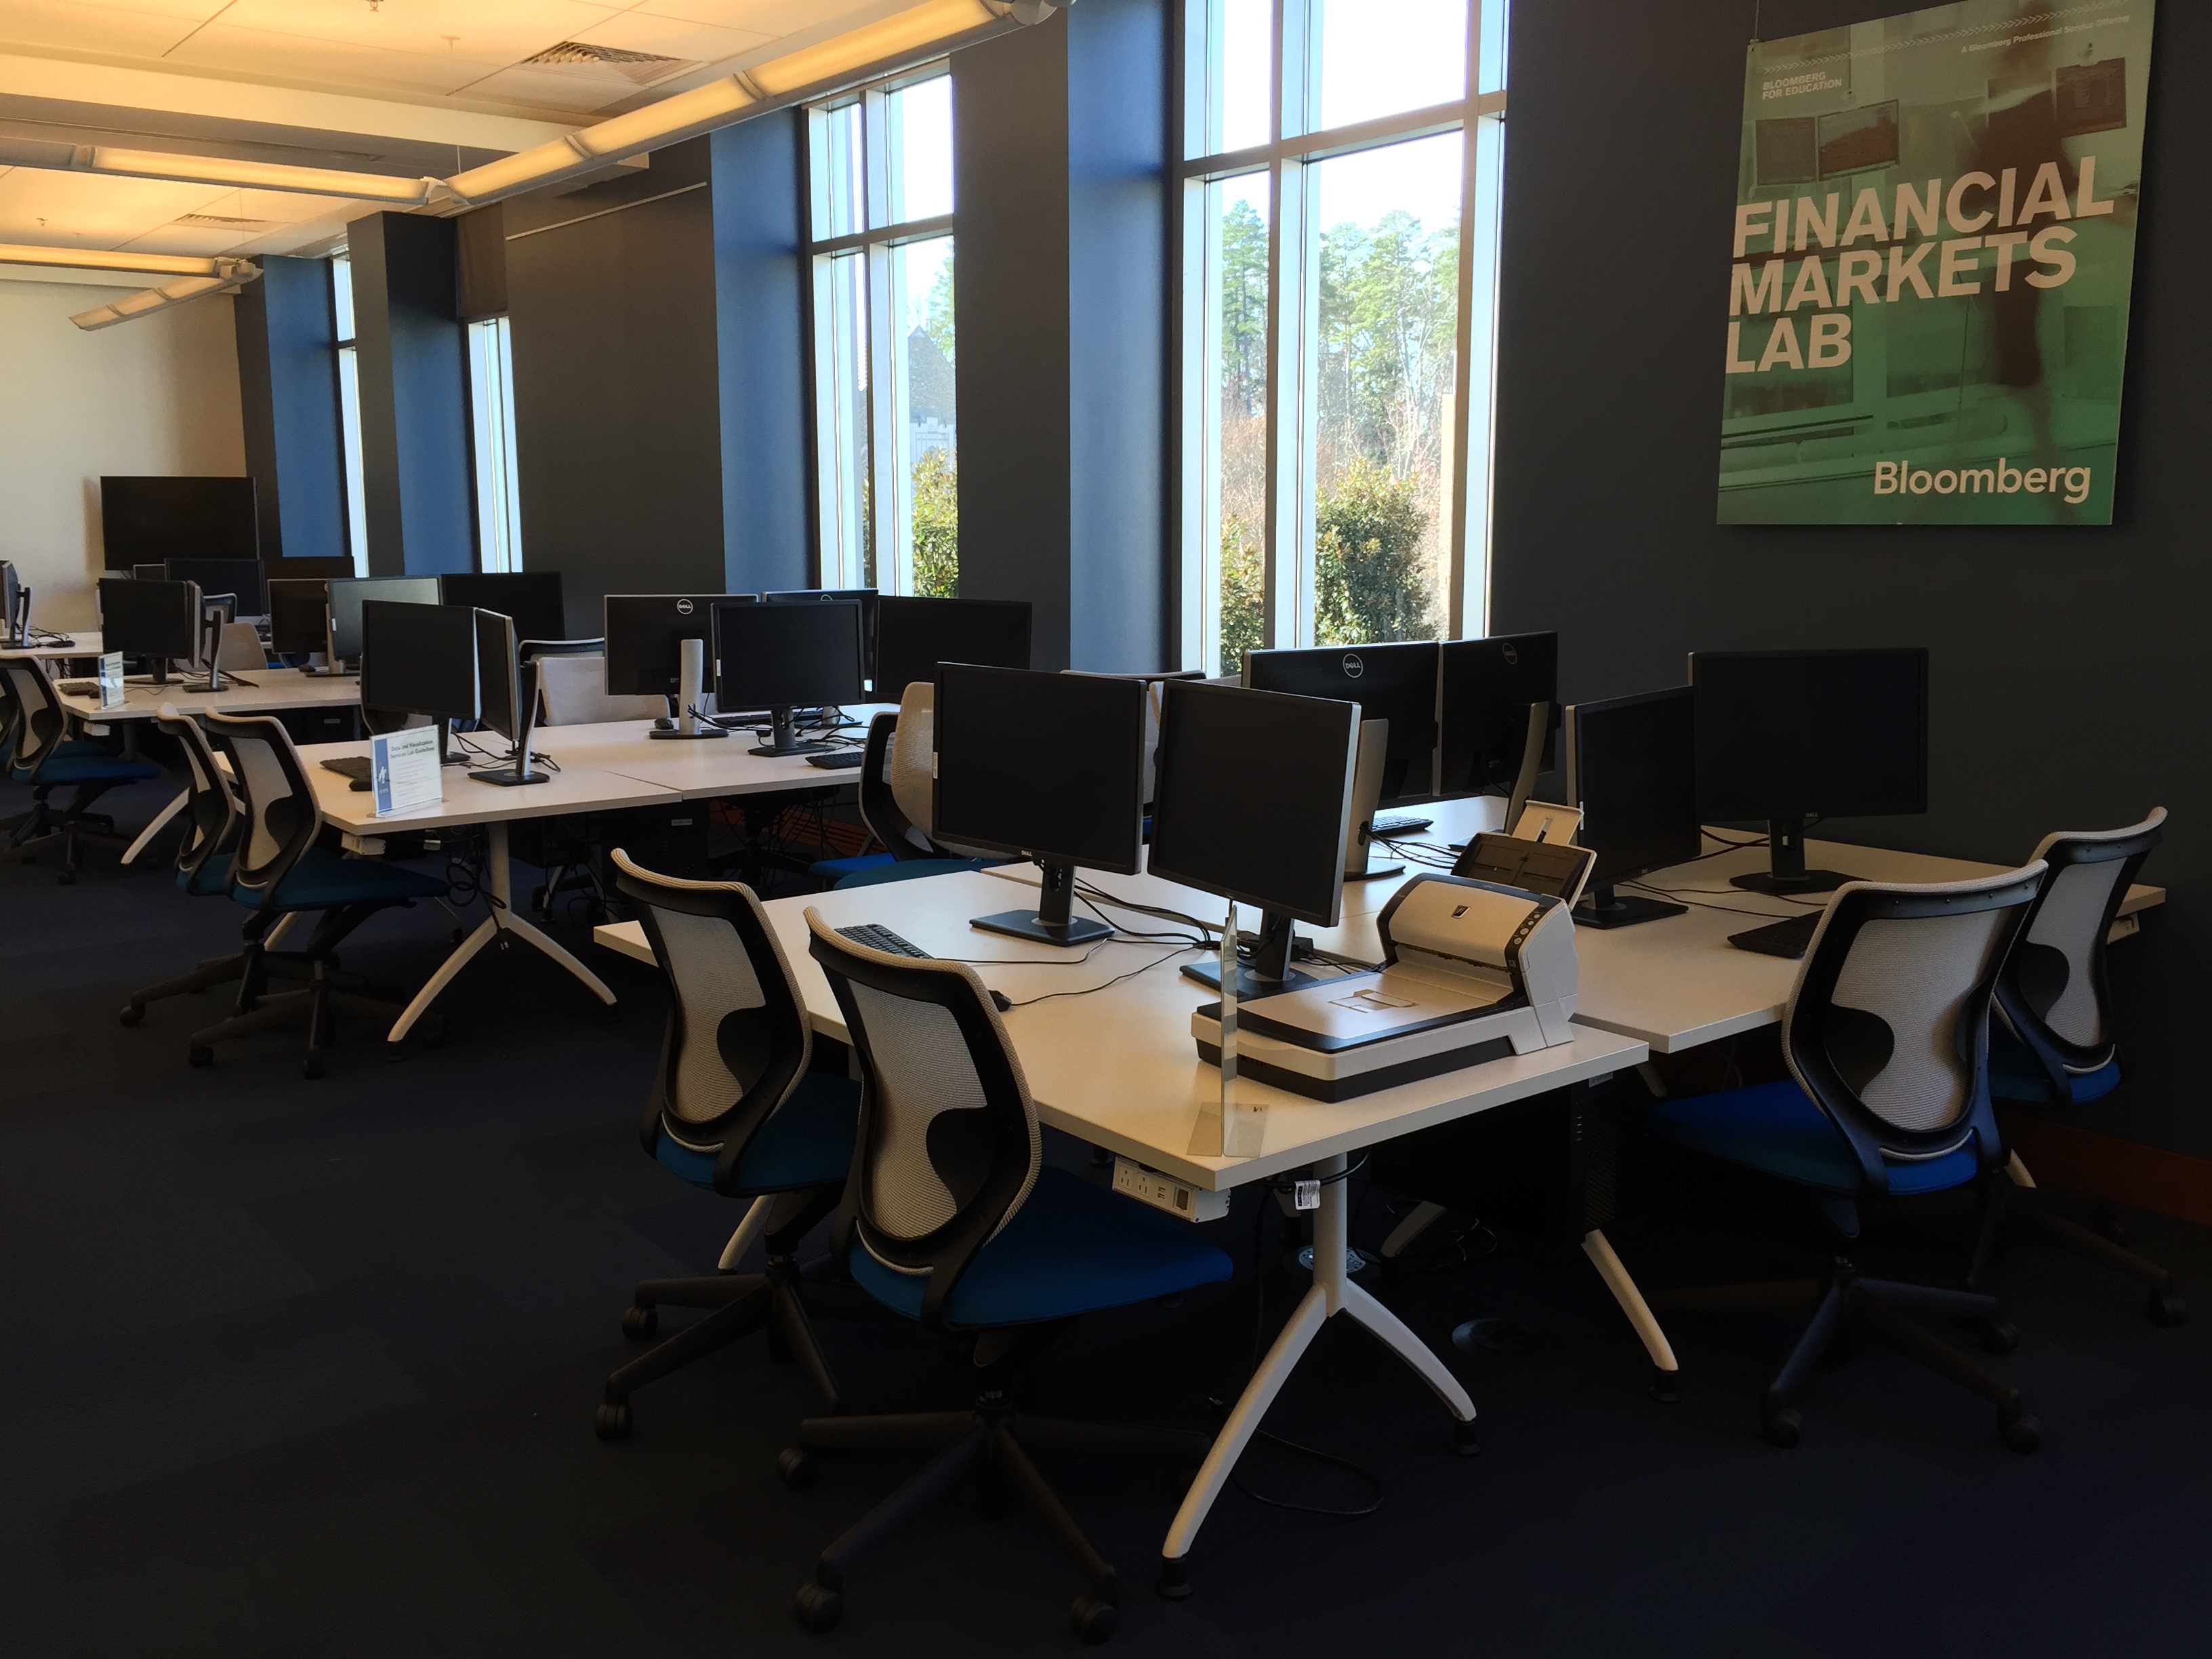
We’re going to be honest…  we miss meeting Duke students and faculty in the Brandaleone Lab in the Edge and consulting on data problems!  However, virtual data consultations over zoom have some advantages over an in-person data consultations at the library. With zoom features such as screen sharing, multiple participants, and chat, we can reach both individuals and project teams in a format where everyone can see the screen and sharing resource links is simple. As of October 1st, we have used zoom to consult on questions from creating figures in the R programming languages to advising Bass Connection teams on the best way to visualize their research.  We are happy to schedule zoom consultations via email at: askdata@duke.edu.

Just askdata@duke.edu

Even with our new data chat service and video chat services, we are still delighted to advise on questions over email at askdata@duke.edu. As the days grow shorter this fall and project deadlines loom, we look forward to working with you to resolve your data challenges!

Fall Data and Visualization Workshops

2017 Data and Visualization Workshops

Visualize, manage, and map your data in our Fall 2017 Workshop Series.  Our workshops are designed for researchers who are new to data driven research as well as those looking to expand skills with new methods and tools. With workshops exploring data visualization, digital mapping, data management, R, and Stata, the series offers a wide range of different data tools and techniques. This fall, we are extending our partnership with the Graduate School and offering several workshops in our data management series for RCR credit (please see course descriptions for further details).

Everyone is welcome at Duke Libraries workshops.  We hope to see you this fall!

Workshop Series by Theme

Data Management

09-13-2017 – Data Management Fundamentals
09-18-2017 – Reproducibility: Data Management, Git, & RStudio 
09-26-2017 – Writing a Data Management Plan
10-03-2017 – Increasing Openness and Reproducibility in Quantitative Research
10-18-2017 – Finding a Home for Your Data: An Introduction to Archives & Repositories
10-24-2017 – Consent, Data Sharing, and Data Reuse 
11-07-2017 – Research Collaboration Strategies & Tools 
11-09-2017 – Tidy Data Visualization with Python

Data Visualization

09-12-2017 – Introduction to Effective Data Visualization 
09-14-2017 – Easy Interactive Charts and Maps with Tableau 
09-20-2017 – Data Visualization with Excel
09-25-2017 – Visualization in R using ggplot2 
09-29-2017 – Adobe Illustrator to Enhance Charts and Graphs
10-13-2017 – Visualizing Qualitative Data
10-17-2017 – Designing Infographics in PowerPoint
11-09-2017 – Tidy Data Visualization with Python

Digital Mapping

09-12-2017 – Intro to ArcGIS Desktop
09-27-2017 – Intro to QGIS 
10-02-2017 – Mapping with R 
10-16-2017 – Cloud Mapping Applications 
10-24-2017 – Intro to ArcGIS Pro

Python

11-09-2017 – Tidy Data Visualization with Python

R Workshops

09-11-2017 – Intro to R: Data Transformations, Analysis, and Data Structures  
09-18-2017 – Reproducibility: Data Management, Git, & RStudio 
09-25-2017 – Visualization in R using ggplot2 
10-02-2017 – Mapping with R 
10-17-2017 – Intro to R: Data Transformations, Analysis, and Data Structures
10-19-2017 – Developing Interactive Websites with R and Shiny 

Stata

09-20-2017 – Introduction to Stata
10-19-2017 – Introduction to Stata 


DVS Fall Workshops

GenericWorkshops-01Data and Visualization Services is happy to announce its Fall 2015 Workshop Series.  With a range of workshops covering basic data skills to data visualization, we have a wide range of courses for different interests and skill levels..  New (and redesigned) workshops include:

  • OpenRefine: Data Mining and Transformations, Text Normalization
  • Historical GIS
  • Advanced Excel for Data Projects
  • Analysis with R
  • Webscraping and Gathering Data from Websites

Workshop descriptions and registration information are available at:

library.duke.edu/data/news


Workshop
 

Date

OpenRefine: Data Mining and Transformations, Text Normalization
Sep 9
Basic Data Cleaning and Analysis for Data Tables
Sep 15
Introduction to ArcGIS
Sep 16
Easy Interactive Charts and Maps with Tableau
Sep 18
Introduction to Stata
Sep 22
Historical GIS
Sep 23
Advanced Excel for Data Projects
Sep 28
Easy Interactive Charts and Maps with Tableau
Sep 29
Analysis with R
Sep 30
ArcGIS Online
Oct 1
Web Scraping and Gathering Data from Websites
Oct 2
Advanced Excel for Data Projects
Oct 6
Basic Data Cleaning and Analysis for Data Tables
Oct 7
Introduction to Stata
Oct 14
Introduction to ArcGIS
Oct 15
OpenRefine: Data Mining and Transformations, Text Normalization
Oct 20
Analysis with R
Oct 20


New Year- New Data and Visualization Lab!

Data and Visualization Services is happy to announce our new Data and Visualization Lab in Duke Libraries new Edge research space.  Located on the first floor of the Bostock Library, the Brandaleone Family Lab for Data and Visualization Services offers a dedicated space for researchers working on data driven projects.

The lab features three distinct areas for supporting data driven research.

Data and Visualization Lab Space

Data and Visualization Lab Computing Zone

Our lab space features twelve high end workstations with dual monitors with the latest software for data visualization, digital mapping, statistics, and qualitative research.  All of the machines have two dedicated displays to encourage collaborative work and data consultations.  Additionally, all twelve machines have a dedicated power port located conveniently under the edge of the table for powering a laptop or usb powered device.

Bloomberg Professional “Bar”

bloom

Since the launch of our Bloomberg terminals, we have seen a steady increase in both individual and team based usage of Bloomberg financial data.  Our three Bloomberg Professional workstations are now located on a dedicated “bar” across from our lab machines.  The  new Bloomberg zone will facilitate collaborate work and provide a base for groups such as the Duke University Investment Club and Duke Financial Economics Center.

Consult and Collaborative SpaceCollaboration Zone

Our third lab space provides a set of four rolling tables for small groups to collaborate or for projects that don’t require a fixed computing space.   An 85″ flat panel display near this zone features data visualizations and other data driven research projects at Duke.

Come See Us!

With ample natural light,  almost 24/7 availability, and a welcoming staff eager to work with you on your next data driven project.  We look forward to working with you in the upcoming year!

Scaling Support: Designing Data for a Growing Statistics Program

r_stats101How do you support 57,860 online students learning R and statistics ?  Late last fall, Data and GIS Services shared this challenge with Professor Mine Çetinkaya-Rundel and the staff of CIT as we sought to translate Professor Çetinkaya-Rundel’s successful Statistics 101 course to a Coursera class on Data Analysis and Statistical Inference.  While Data and GIS Services has supported Statistics 101 students for several years identifying appropriate data and using the R statistical language for their assignments, the scale of the Coursera course introduced new challenges of trying to provide engaging data to a very large audience without having the opportunity to provide direct support to everyone in the class.

In our initial meetings with Professor Çetinkaya-Rundel, she requested that Data and GIS create data collections for the course that would provide easy access in R and would include a range of statistical measures that would appeal to the diverse audience in the class.  The first challenge — easy access to R — required some translation work.  While R excels in its flexibility, graphics, and statistical power, it lacks some of the built in data documentation features present in other statistical packages.  This project prompted Data and GIS to reconsider how to provide documentation and pre-formatted R data to an audience that would likely be unfamiliar with R and data documentation.

The second challenge — finding data that covered a wide range of interesting topics — proved much easier.  The General Social Survey with its diverse and engaging questions on a wide range of topics proved to be an easy choice for the class.  The American National Election Studies, also offered a diverse set of measures of public opinion that suited the course well.  With these challenges identified and addressed, we spent the end of 2013 selecting portions of the data for class (subsetting), abridging the data documentation for instructional use, and transforming the data to address its usage in an online setting (processing missing values for R, creating factor variables).

As Professor Çetinkaya-Rundel’s class launches on February 17th, this project has given us a new appreciation of providing data and statistical services in a MOOC while also building course materials that we are using in Statistics 101 at Duke.  While students begin the Coursera course on Data Analysis and Statistical Inference, students in Professor Kari Lock Morgan’s Statistics 101 class will use these data in their on-campus Duke course as well.  We hope that both collections will reduce some of the technological hurdles that often confront courses using R as well as improving statistical literacy at Duke and beyond.