
 The end of the spring semester always brings presentations of final projects, some of which may have been in the works since the fall or even the summer. Tableau, a software application designed specially for visualization, is a great option for projects that would benefit from interactive charts and maps.
Visualizing survey data, however, can be a bit of a pain. If your project uses Qualtrics, for example, you may be having trouble getting the data ready for visualization and analysis. Qualtrics is an extremely powerful survey tool, but the data it creates can be very complicated, and typical data analysis tools aren’t designed to handle that complexity.
Luckily, here at Duke, Tableau users can use Tableau’s Web Data Connector to pull Quatrics data directly into Tableau! It’s so easy, you may never analyze your Qualtrics data another way again.
Process
Here are the basics. There are also instructions from Qualtrics.
In Qualtrics: Copy your survey URL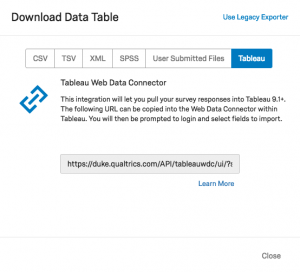

- Go to your Duke Qualtrics account
- Click on the survey of interest
- Click on the Data & Analysis tab at the top
- Click on the Export & Import button
- Select Export Data
- Click on Tableau
- Copy the URL
In Tableau (Public or Desktop): Paste your survey URL
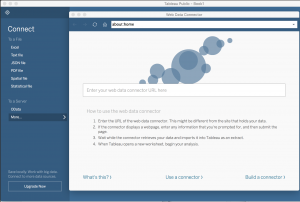
- Under Connect, click on Web Data Connector (may be under “More…” for Tableau Public or “To a server… More…” for Tableau Desktop)
- Paste the survey URL into the web data connector URL box and hit enter/return
- When a login screen appears, click the tiny “Api Token Login” link, which should be below the green Log in button
In Qualtrics: Create and copy your API token
- Go to your Duke Qualtrics account
- Click on your account icon in the upper-right corner
- Select Account Settings…
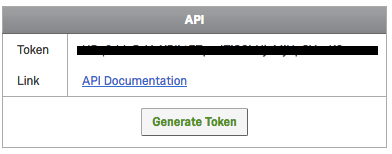
- On the Account Settings page, click on the Qualtrics IDs tab
- Under API, check for a token. If you don’t have one yet, click on Generate Token
- Copy your token
In Tableau (Public or Desktop): Paste your API token
- Paste in your API token and click the Login button
- Select the data fields you would like to import
Note: there is an option to “transpose” some of the fields on import. This is useful for many of the types of visualizations you might want to create from survey data. Typically, you want to transpose fields that represent the questions asked in the survey, but you may not want to transpose demographics data or identifiers. See also the Qualtrics tips on transposing data.
Resources
For more tips on how to use Tableau with Qualtrics data, check out the resources below:


 The fall of 2014 marks the completion of the first five years of the libraries’