
The finalists winners of the 2013 Data Visualization Contest were announced at our recent Data & GIS Services open house. The judging panel selected the top five submissions as finalists, each of which was then converted into a poster for display in the Brandaleone Family Center for Data and GIS Services (Perkins 226). Of the five finalists, the panel also selected two grand prize winners, each of whom was awarded $250 in Amazon Gift Cards.
The grand prize winners were:
ACC Basketball Tournament Series Records, by Volodymyr Zavidovych

Limbique, by Pinar Yoldas and David Paulsen

The other three finalists were:
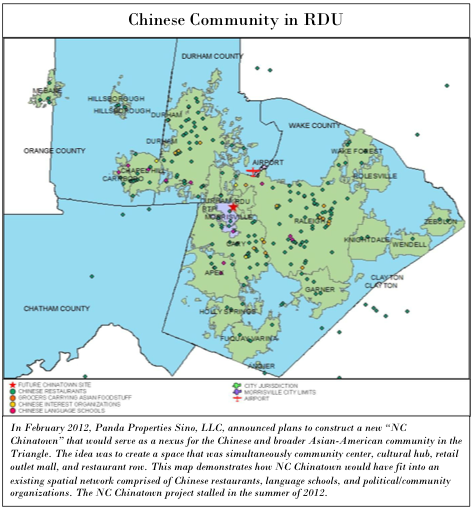
Mapping Chinatown, by Sabrina McCutchan
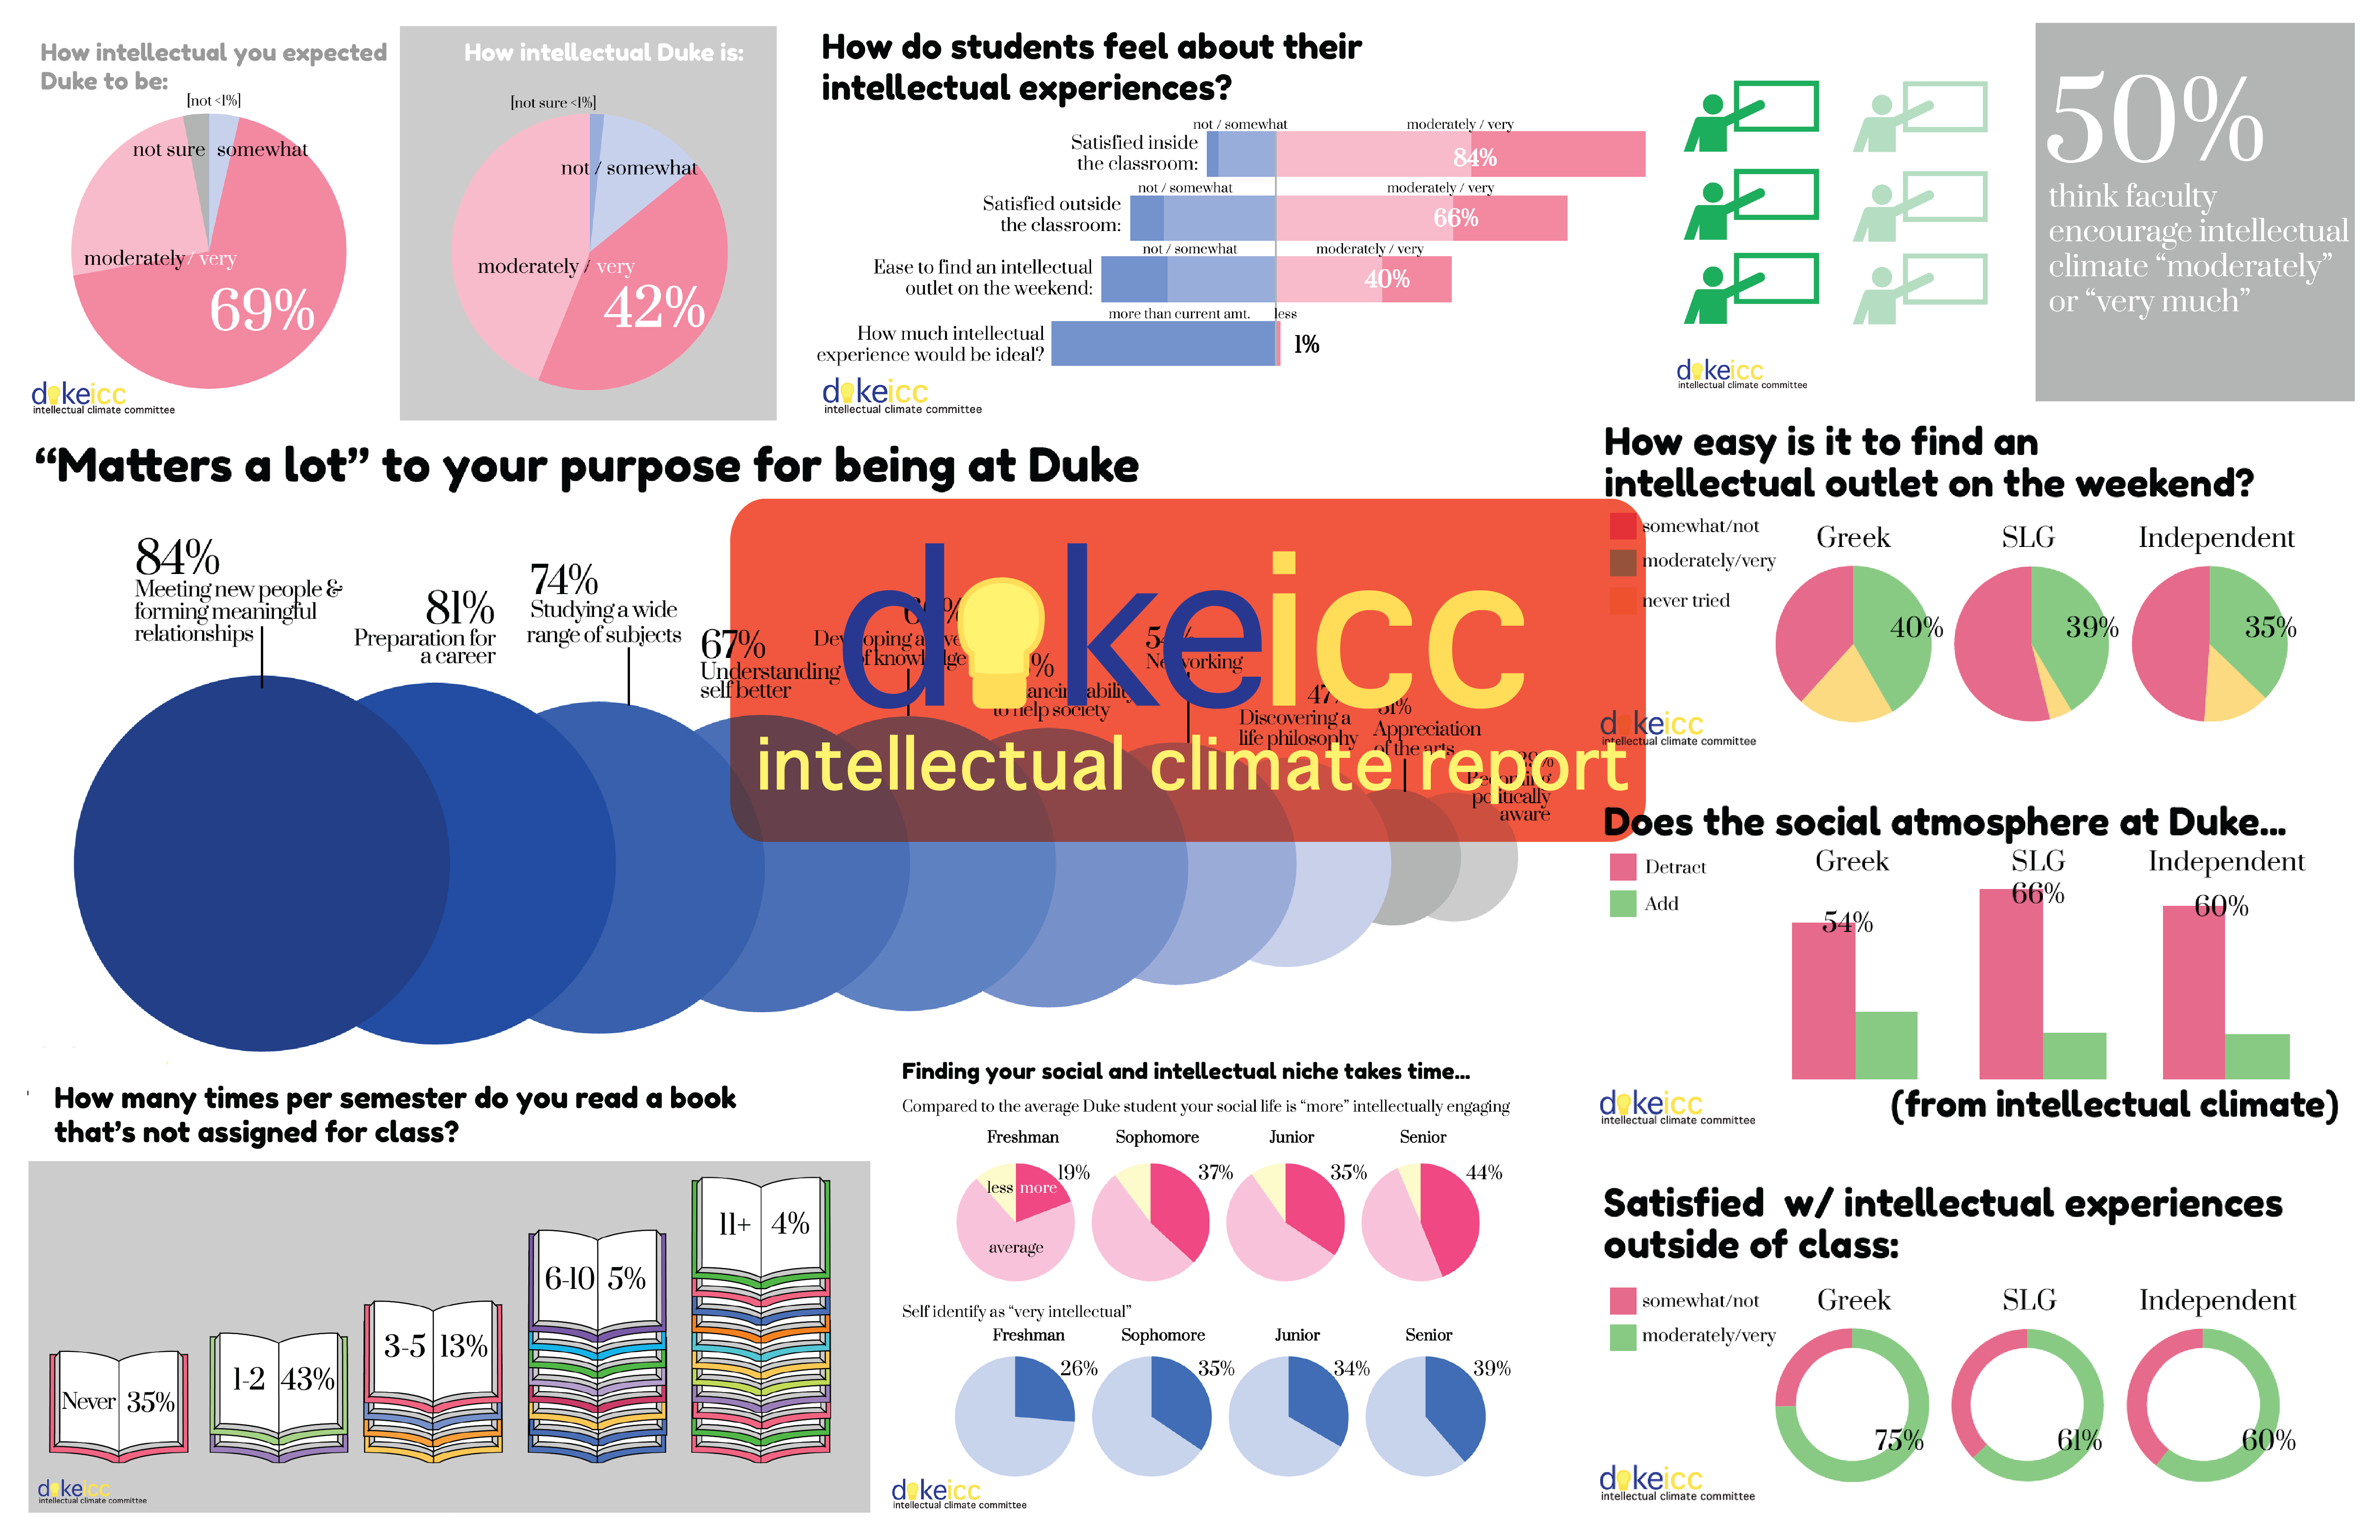
Duke Intellectual Climate Report 2012, by Amanda Peralta
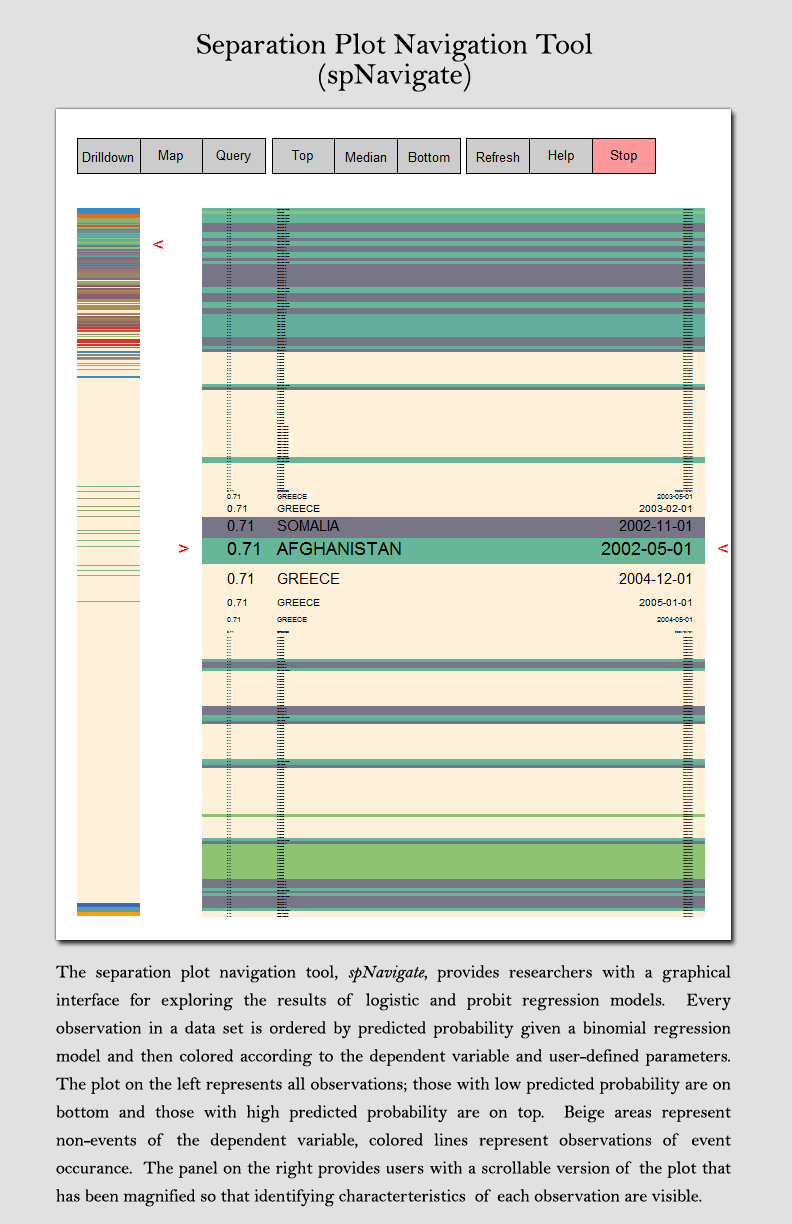
spNavigate, by Benjamin Radford
Data and GIS Services would like to congratulate the finalists and winners and thank all of the student submitters for their impressive work! The full set of submissions to the contest is available on our growing Flickr gallery.
