
 Data & GIS Services will soon be accepting submissions to its 2nd annual student data visualization contest. If you have a course project that involves visualization, start thinking about your submission now!
The purpose of the contest is to highlight outstanding student data visualization work at Duke University. Data & GIS Services wants to give you a chance to showcase the hard work that goes into your visualization projects.
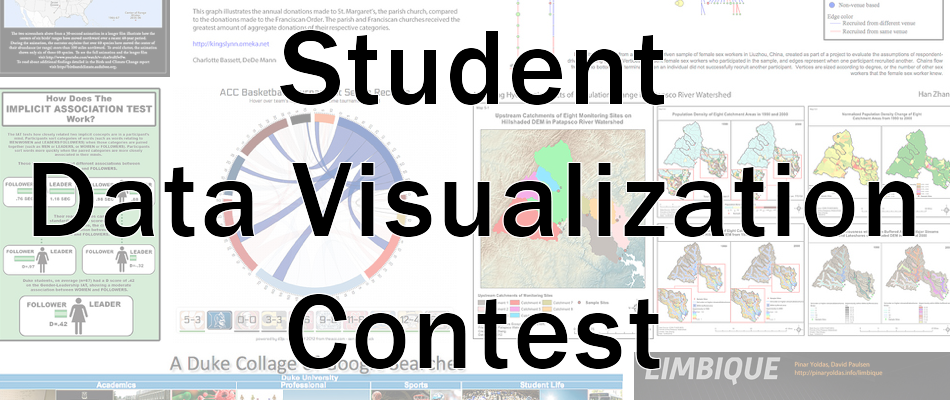
Data visualization here is broadly defined, encompassing everything from charts and graphs to 3D models to maps to data art. Data visualizations may be part of a larger research project or may be developed specifically to communicate a trend or phenomenon. Some are static images, while others may be animated simulations or interactive web experiences. Browse through last year’s submissions to get an idea of the range of work that counts as visualization.
The Student Data Visualization Contest is sponsored by Data & GIS Services, Perkins Library, Scalable Computing Support Center, Office of Information Technology, and the Office of the Vice Provost for Research.
For more details, see the 2014 Student Data Visualization Contest page. Please address all additional questions to Angela Zoss (angela.zoss@duke.edu), Data Visualization Coordinator, 226 Perkins Library.