
 Data and Visualization Services is happy to announce its Fall 2015 Workshop Series. With a range of workshops covering basic data skills to data visualization, we have a wide range of courses for different interests and skill levels.. New (and redesigned) workshops include:
- OpenRefine: Data Mining and Transformations, Text Normalization
- Historical GIS
- Advanced Excel for Data Projects
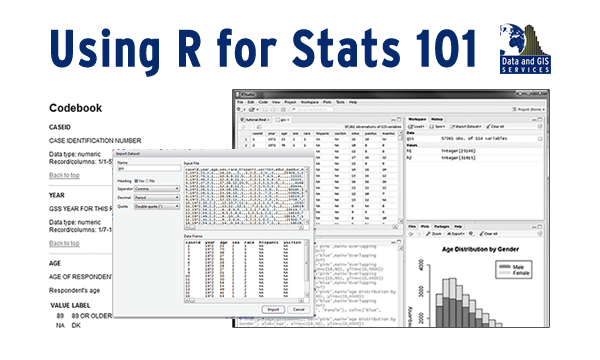
- Analysis with R
- Webscraping and Gathering Data from Websites
Workshop descriptions and registration information are available at:
|
Workshop
|
Date |
|
Sep 9
|
|
|
Sep 15
|
|
|
Introduction to ArcGIS
|
Sep 16
|
|
Sep 18
|
|
|
Introduction to Stata
|
Sep 22
|
|
Historical GIS
|
Sep 23
|
|
Advanced Excel for Data Projects
|
Sep 28
|
|
Easy Interactive Charts and Maps with Tableau
|
Sep 29
|
|
Analysis with R
|
Sep 30
|
|
ArcGIS Online
|
Oct 1
|
|
Web Scraping and Gathering Data from Websites
|
Oct 2
|
|
Advanced Excel for Data Projects
|
Oct 6
|
|
Basic Data Cleaning and Analysis for Data Tables
|
Oct 7
|
|
Introduction to Stata
|
Oct 14
|
|
Introduction to ArcGIS
|
Oct 15
|
|
OpenRefine: Data Mining and Transformations, Text Normalization
|
Oct 20
|
|
Analysis with R
|
Oct 20
|


 How do you support 57,860 online students