What is Open Data?
Finding data can be challenging. Organizations and government agencies can share their data with the public using ESRI’s ArcGIS Open Data, a centralized spatial data clearinghouse. Since its inception last year, over 1,600 organizations have provided more than 22,000 open datasets to the public. Open Data allows users to find and download data in different formats, including shapefiles, spreadsheets, and KML documents, as well as APIs (GeoJSON or Esri GeoServices) to call the data into your own application. It also lets you create various types of charts.

How to Find and Use Data
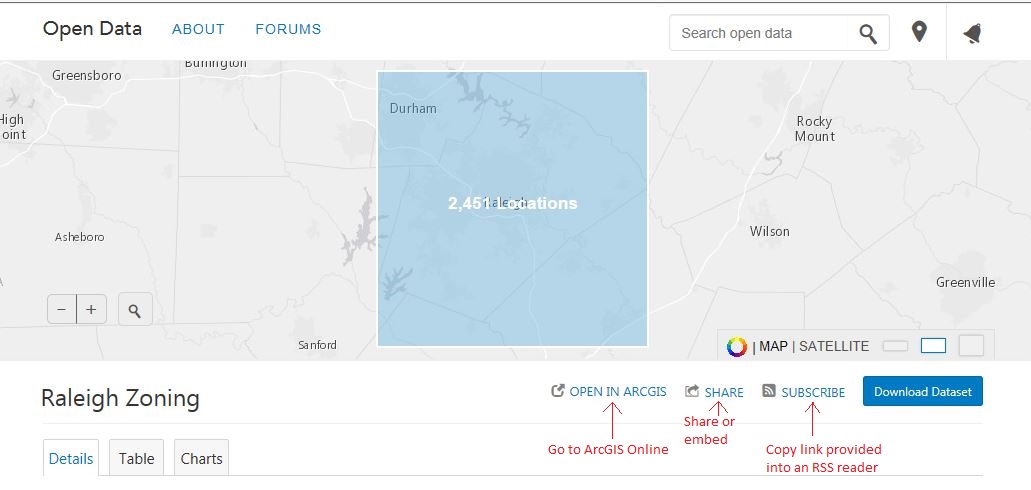
Open Data allows consumers to type in a geographic area or a topic of interest in a single search box. Once you’ve found data that appears to be what you were looking for, you can use the data for GIS purposes or use a table to create charts and graphs. If you are looking for GIS data, you can preview the spatial data before downloading by clicking the “Open in ArcGIS” icon. This takes users to ArcGIS Online where they can create choropleth maps and interact with the attribute table. Users interested in tabular data can filter it and create various types of charts. If more analysis of the data is necessary, you can download it by clicking the “Download Dataset” icon; you are able to download the entire dataset or the filtered dataset you’ve been working with.
Tips
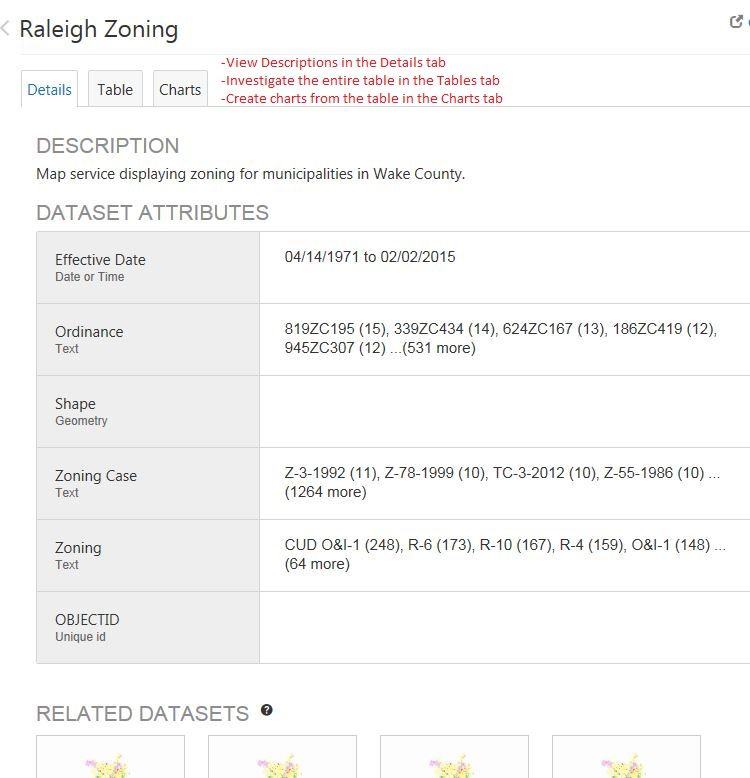
The Source and Metadata links below the “About” heading provide information about the data. In-depth information such as descriptions, attributes, 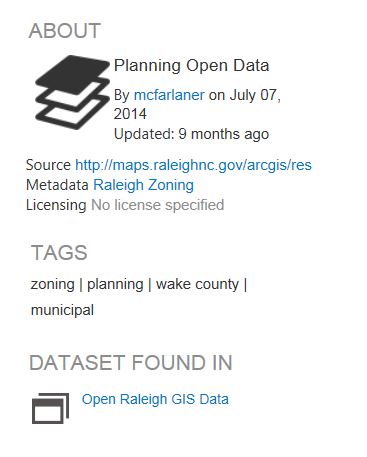 and how the data was collected are provided in these links. Below the name of the dataset there are three tabs: “Details,” “Table,” and “Charts.” Under the “Details” tab there are three sections, the Description, Dataset Attributes, and Related Datasets sections. The Dataset Attributes section outlines the fields found within the dataset and provides field type information, while the Related Datasets section provides links to other datasets that have similar geographies or topics to the dataset you’ve chosen. In the “Table” tab, you can view and filter the entire table in the dataset and the “Charts” tab allows you to create different charts.
 To obtain the most updated dataset or other updated articles related to the dataset, users should subscribe to the dataset they are interested in. To subscribe, copy the link provided into an RSS Reader. For specific data source questions, feel free to ask the Data and Visualization Department at askdata@duke.edu.