As we begin the new year, the Center of Data and Visualization Sciences is happy to announce a series of twenty-one data workshops designed to empower you to reach your goals in 2022. With a focus on data management, data visualization, and data science, we hope to provide a diverse set of approaches that can save time, increase the impact of your research, and further your career goals.
While the pandemic has shifted most of our data workshops online, we remain keenly interested in offering workshops that reflect the needs and preferences of the Duke research community. In November, we surveyed our 2021 workshop participants to understand how we can better serve our attendees this spring. We’d like to thank those who participated in our brief email survey and share a few of our observations based on the response that we received.
Workshops Formats
While some of our workshops participants (11%) prefer in-person workshops and others (24%) expressed a preference for hybrid workshops, a little over half of the survey respondents (52%) expressed a preference for live zoom workshops. Our goal for the spring is to continue offering “live” zoom sessions while continuing to explore possibilities for increasing the number of hybrid and in-person options. We hope to reevaluate our workshops communities preferences later this year and will continue to adjust formats as appropriate.
52% of respondents prefer online instruction, while another 24% would like to hybrid options
Participant Expectations
With the rapid shift to online content in the last two years coupled with a growing body of online training materials, we are particularly interested in how our workshop attendees evaluate online courses and their expectations for these courses. More specifically, we were curious about whether registering for an online session includes more than simply the expectation of attending the online workshop.
While we are delighted to learn that the majority of our respondents (87%) intend to attend the workshop (our turnout rate has traditionally been about 50%), we learned that a growing number of participants had other expectations (note: for this question, participants could choose more than one response). Roughly sixty-seven percent of the sample indicated they expected to have a recording of the session available. While another sixty-six percent indicated that they expected a copy of the workshop materials (slides, data, code) even if they were unable to attend.
As a result of our survey, CDVS will make an increasing amount of our content available online this spring.. In 2021, we launched a new webpage designed to showcase our learning materials. In addition to our online learning site, CDVS maintains a github site (CDVS) as well as site focused on R learning materials (Rfun).
We appreciate your feedback on the data workshops and look forward to working with you in the upcoming year!
Since the summer of 2018 I have been working with a set of nineteenth-century commercial almanacs for the city of Paris. As my dissertation focused heavily on the production of stone funerary markers during this period, I wanted to consult these almanacs to get a sense of how many workers were active in this field of production. Classified as marbriers (stonecutters), the makers of funerary monuments were often one in the same as those who executed various other stone goods and constructions. These almanacs represented a tremendous source of industry information, consistently recording enterprise names and addresses, as well as, at times, specific information about the types of products the enterprise specialized in and any awards they might have won for their work, and what types of new technologies they employed. An so I decided to make a database.
As a Humanities Unbounded graduate assistant with the Center for Data and Visualization Sciences during the summer of 2020, I had the opportunity to explore some of the issues related to database construction and management faced by humanists working on data-based research projects. In order to work out some of these issues, I worked to set up a MySQL database using my commercial almanacs data as a test case to determine which platforms and methods for creating queryable databases would be best suited for those working primarily in the humanities. In the process of setting up this database what became increasingly clear was the need to make clear the usefulness of this process for other humanists undertaking data-driven projects, as well as identify ways of transforming single spreadsheets of data into relational data models without needing to know how to code. Thus, in this blog post I offer a few key points about relational database models that may be useful for scholars in the humanities and share my experiences in constructing a MySQL database from a single Excel spreadsheet.
First of all, some key terms and concepts. MySQL is an open-source relational database management system that uses SQL (Structured Query Language) to create, modify, manage and extract data from a relational database. A relational data model organizes data into a series of tables containing columns (‘attributes’) and rows (‘records’) with unique keys identifying each record. Each table (or, ‘relation’) represents a single entity type and its corresponding attributes. When working with a relational data model you want to make sure that your tables are normalized, or organized in such a way that reduces redundancy in the data set, increases consistency, and facilitates querying.
Although for the purposes of efficient data gathering, I had initially collected all of the information from the commercial almanacs in a single Excel spreadsheet, I knew that I ultimately wanted to reconfigure my data using a relational model that could be shared with and queried efficiently by others. The main benefits of a relational model include ensuring consistency as well as performing combinations of queries to understand various relationships that exist among the information contained in the various tables that would be otherwise difficult to determine from a single spreadsheet. An additional benefit to this system is the ability to add records and edit information without the risk of compromising other information contained in the database.
The first question I needed to ask myself was which entities from my original spreadsheet would become the basis for my relational database. In other words, how would my relational model be organized? What different relationships existed within the dataset, and which variables functioned as entities rather than attributes? One of the key factors in determining which variables would become the entities of my relational model, was the question of whether or not a given variable contained repeated values throughout the master sheet. Ultimately determining the entities wasn’t the trickiest part. It because rather clear early on that it would be best to first create separate tables for businesses and business locations, which would be related via a table for annual activity (in the process of splitting my tables I would end up making more tables, but these were the key starting points).
The most difficult question I encountered was how I would go about splitting all this information as someone with very limited coding experience. How could identify unique values and populate tables with relevant attributes without having to teach myself Python in a pinch, but also without having to retype over one hundred years’ worth of business records? Ultimately, I came up with a rather convoluted system that had me going back and forth between OpenRefine and Excel. Once I got the hang of my system it became almost second nature to me but explaining it to others was another story. This made it abundantly clear that there was a lack of resources for demonstrating how one could create what were essentially a series of normalized tables from a flat data model. So, to make a very long story short, I broke down my convoluted process into a series of simple steps that required nothing more that Excel to transform a flat data model into a relational data model using the UNIQUE() and VLOOKUP() functions. This processes is detailed in a library tutorial I developed geared towards humanists, consisting of both a video demonstrating the process and a PDF containing written instructions.
In the end, all I needed to do was construct the database itself. In order to do this I worked with phpMyAdmin, a free web-based user interface for constructing and querying MySQL databases. Using phpMyAdmin, I was able to easily upload my normalized data tables, manage and query my database, and easily connect to Tableau for data visualization purposes using phpMyAdmin’s user management capabilities.
Dr. Kaylee P. Alexander is a graduate of the Department of Art, Art History & Visual Studies, where she was also a research assistant with the Duke Art, Law & Markets Initiative (DALMI). Her dissertation research focuses on the visual culture of the cemetery and the market for funerary monuments in nineteenth-century Paris. In the summer of 2020, she served as a Humanities Unbounded graduate assistant with the Center for Data and Visualization Sciences at Duke University Libraries.
John Little is the Data Science Librarian in Duke Libraries Center for Data and Visualizations Sciences. Contact him at askdata@duke.edu.
The Center for Data and Visualization Sciences is and has been open since March! We never closed. We’re answering questions, teaching workshops, have remote virtual machines available, and business is booming.
What’s changed? Due to COVID-19, the CDVS staff are working remotely. While we love meeting with people face-to-face in our lab, that is not currently possible. Meanwhile, digital data wants to be analyzed and our patrons still want to learn. By late spring I began planning to flip my workshops for fall 2020. My main goal was to transform a workshop into something more rewarding than watching the video of a lecture, something that lets the learner engage at their pace, on their terms.
How to flip
Flipping the workshop is a strategy to merge student engagement and active learning. In traditional instruction, a teacher presents a topic and assigns work aimed at reinforcing the lesson.
Background: I offer discrete two-hour workshops that are open to the entire university. There are very few prerequisites and people come with their own level of experience. Since the workshops attract a broad audience, I focus on skills and techniques using general examples that reliably convey information to all learners. In this environment, discipline specific examples risk losing large portions of the audience. As an instructor I must try to leave my expectations of students’ skills and background knowledge — at the door.
In a flipped classroom, materials are assigned and made available in advance. In this way, group Zoom-time can be used for questions and examples. This instruction model allows students to learn at their own pace, pause and rewind videos, practice exercises, or speed up lectures. During the workshop, students can bring questions relevant to their particular point of confusion.
The main instructor goal is to facilitate a topic for student engagement that puts the students in control. This approach has a democratizing effect that allows students to become more active and familiar with the materials. With flipped workshops, student questions appear to be more thoughtful and relevant. When the student is invited to take charge of their learning, the process of investigation becomes their self-driven passion.
For my flipped workshops materials, I offer basic videos to introduce and reinforce particular techniques. I try to keep each video short, less than 25 minutes. At the same time I offer plenty of additional videos on different topical details. More in-depth videos can cover important details that may feel ancillary or even demotivating, even if those details improve task efficiency. Sometimes the details are easier to digest when the student is engaged. This means students start at their own level and gain background when they’re ready. Students may not return to the background material for weeks, but the materials will be ready when they are.
Flipping a consultation?
The Center for Data & Visualization Sciences provides open workshops and Zoom-based consulting. The flipped workshop model aligns perfectly with our consulting services since students can engage with the flipped workshop materials (recordings, code, exercises) at any time. When the student is ready for more information, whether a general question or a specific research question, I can refer to targeted background materials during my consultations. With the background resources, I can keep my consultations relevant and brief while also reducing the risk of under-informing.
For my flipped workshop on R, or other CDVS workshops, please see our workshop page.
Felipe Álvarez de Toledo López-Herrera is a Ph.D. candidate in the Art, Art History, and Visual Studies Department at Duke University and a Digital Humanities Graduate Assistant for Humanities Unbounded, 2019-2020. Contact him at askdata@duke.edu.
[This blogpost introduces a GitHub Repository that provides resources for developing NER projects in historical languages. Please do not hesitate to use the code and ideas made available there, or contact me if there are any issues we could discuss .]
Understanding Historical Art Markets: an Automated Approach
When the Sevillian painters’ guild archive was lost in the 19th century, with it vanished lists of master painters, journeymen, apprentices and possibly dealers recorded in the guilds’ registration books. Nevertheless, researchers working for over a century in other Sevillian archives have published almost twenty volumes of archival documents. These transcriptions, excerpts and summaries reflect the activities of local painters, sculptors, and architects, among other artisans. I use this evidence as a source of data on early modern Seville’s art market in my dissertation research. For this, I have to extract information from many documents in order to query and discern larger patterns.
Left. Some of the volumes used in this research, in my home library. I have managed to acquire these second-hand; others I have borrowed from libraries. Right. A scan of one of the pages of these books, showing some of the documents from which we extracted data.
Instead of manually keying this information into a spreadsheet or other form of data storage, I chose to scan my sources and test an automated approach using Natural Language Processing. Last semester, within the context of the Humanities Unbounded Digital Humanities Graduate Assistantship, I worked with Named-Entity Recognition (NER), a technique in which computers can be taught to identify named real-world objects in texts. NER models underperform on historical texts because they are trained on modern documents such as news or Wikipedia articles. Furthermore, NLP developers have focused most of their efforts on English language models, resulting in underdeveloped models for other languages. For these reasons, I had to retrain a model to be useful for my purposes. In this blogpost, I give an overview of the process of adapting NER tools for use on non-English historical sources.
Defining Named-Entity Recognition
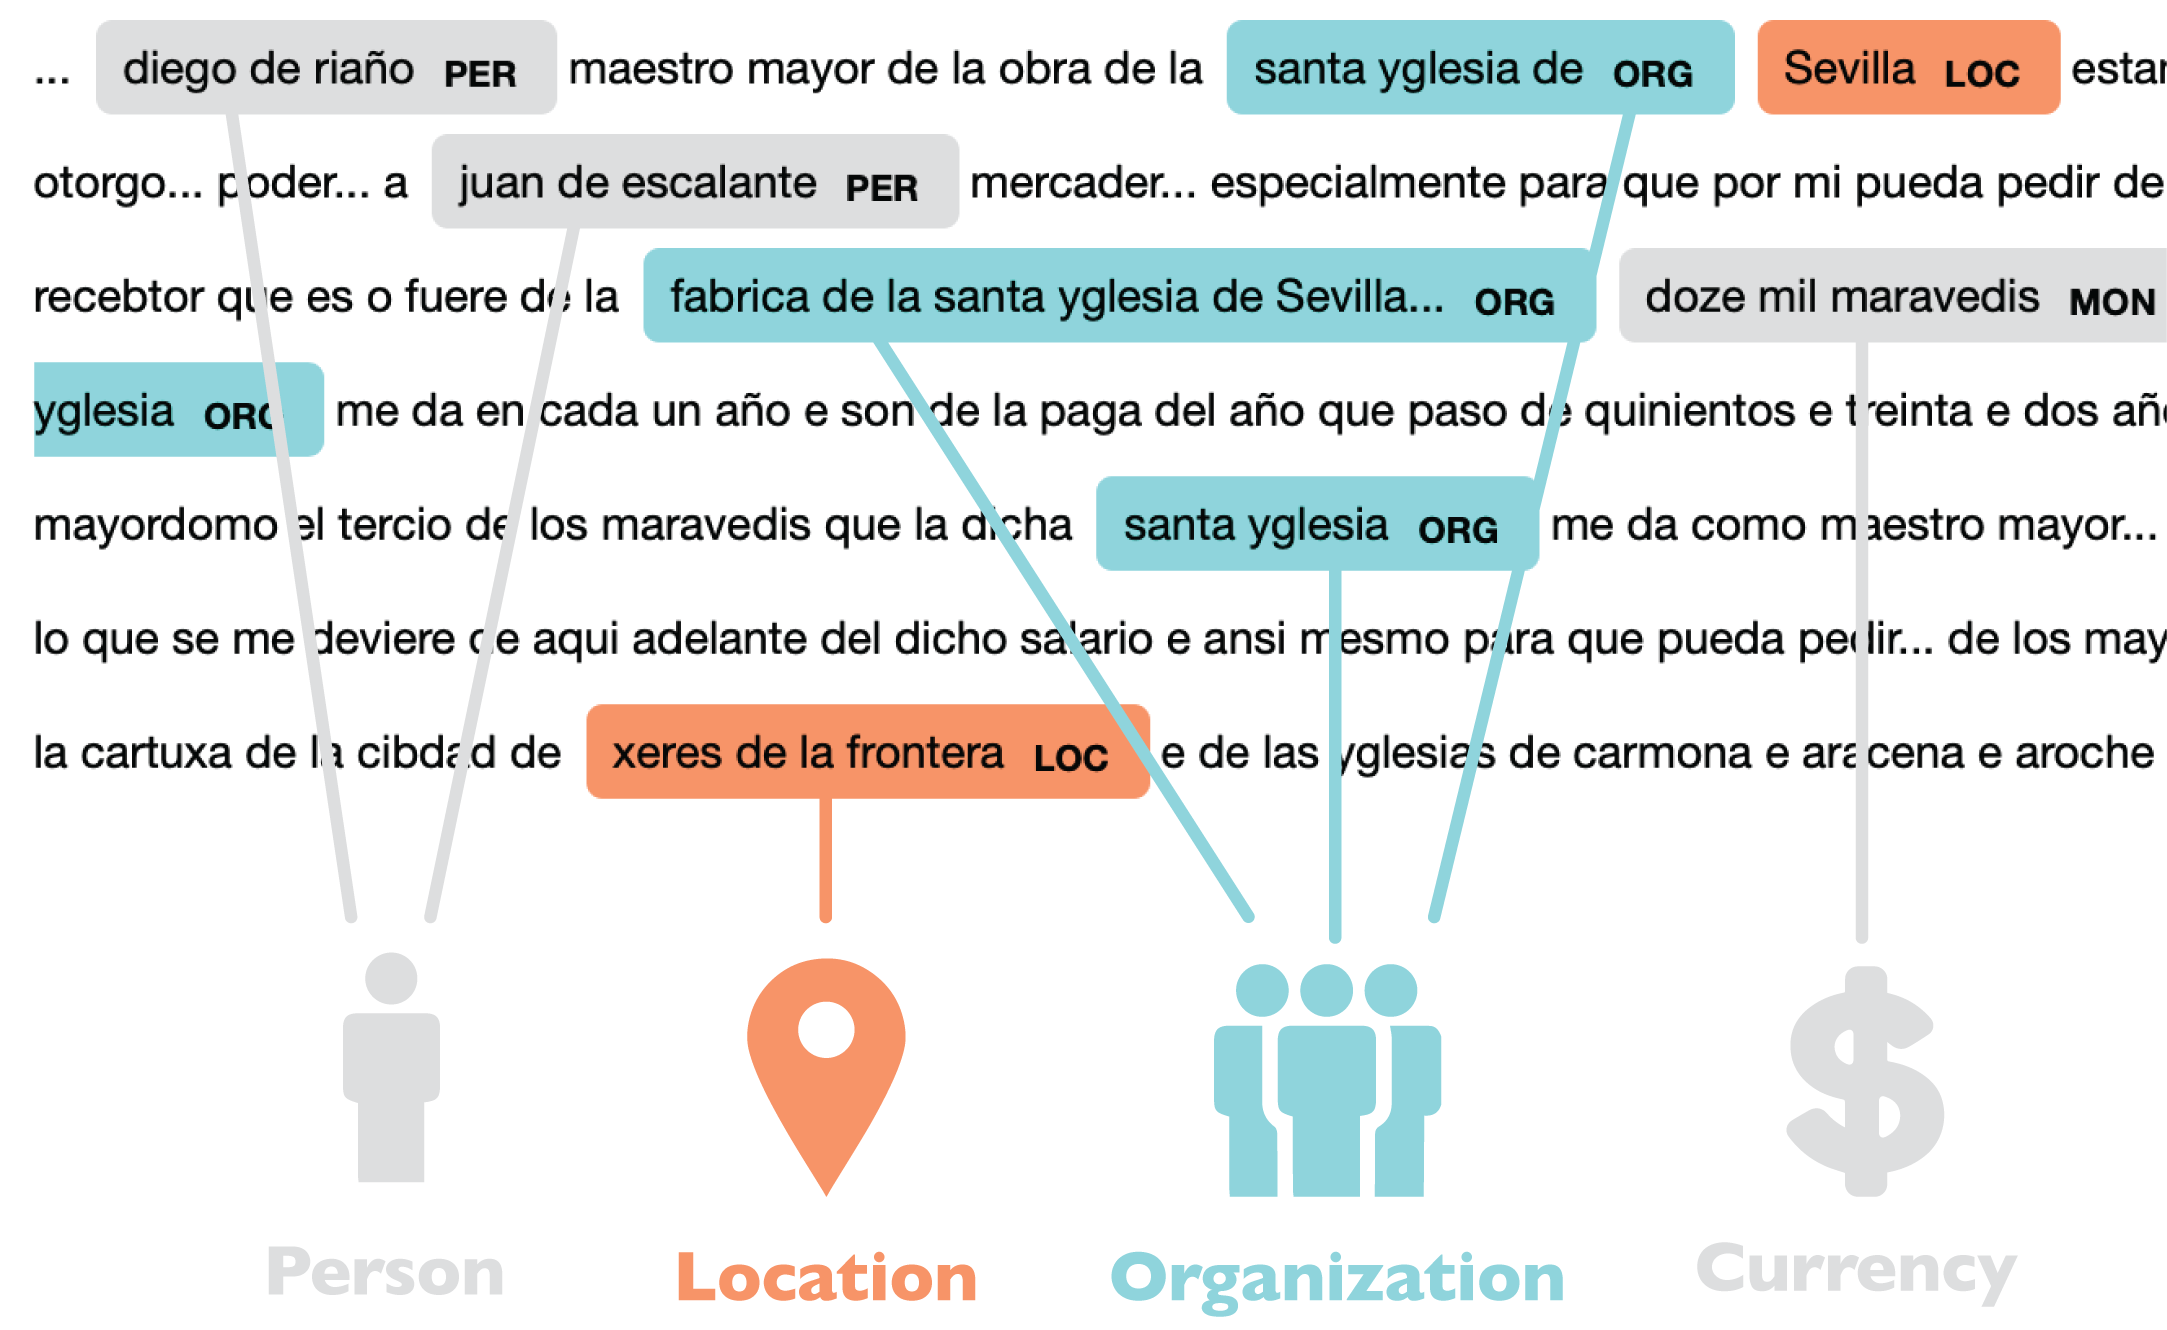
Named-Entity Recognition (NER) is a set of processes in which a computer program is trained to identify and categorize real-world objects with proper names in a corpus of texts. It can be used to tag names in documents without a standardized structure and label them as people, locations or organizations, among other categories.
Named-entity recognition is the automated tagging of real-world objects with names, such as people, locations, organizations, or monetary amounts, within texts.
Code libraries such as Spacy, NLTK or Stanford CoreNLP provide widely-tested toolkits for NER. I decided that Spacy would be the best choice for my purposes. Though its Spanish model included less label categories, they performed better out-of-the-box. Importantly, the model worked better for certain basic language structures such as recognizing compound names (last names with several components, such as my own). The Spacy library also proved user-friendly for those of us with little coding knowledge. Its pre-programmed data processing pipeline is easy to modify, given that you have a basic understanding of Python. In my case, I had the time and motivation to acquire this literacy.
I sought to improve the model’s performance in two ways. First, I retrained it on a subset of my own data. This improved performance and allowed me to add new label categories such as dates, monetary amounts and objects. Additionally, I added a component that modernized my texts’ spelling to make them more conducive to proper tagging.
Training NER on Historical Spanish Text: Process and Results
To improve the model, I needed training data – a “gold standard” of perfectly-tagged text. First, I ran the model on a set of 400 documents, which resulted in a set of preliminary tags. Then, I corrected these tags with a tool called Dataturks and reformatted the output to work with Spacy. Once this data was ready, I split it 80-20, which means running a training loop on 80% of correctly-tagged texts to adjust the performance of the model, and reserving 20% for testing or evaluating the model on data it had not yet seen.
Final output as stored in my database for one particular document with ID=5.
Finally, I evaluated whether all these changes actually improved the model’s performance, saved the updated model, and exported the output in a format that worked for my own database. For my texts, the model initially worked at around 36% recall (the percentage of true entities that were identified by the model), compared to an 89% recall with modern texts as evaluated by Spacy. After training, recall has increased to 64%. Some tags, such as person or location, perform especially well (85% and 81%, respectively). Though the numbers are not perfect, they show a marked improvement, generated with little training data.
For the 8,607 documents processed, the process has resulted in 59,191 tags referring to people, locations, organizations, dates, objects and money. Next steps include finding descriptors of entities within the text, and modeling relationships between entities appearing in the same document. For now, a look at the detected tags underscores the potential of NER for automating data collection in data-driven humanities research.
The Center for Data and Visualization Sciences is glad to welcome you back to a new academic year! We’re excited to have friends and colleagues returning to the Triangle and happy to connect with Duke community members who will not be on campus this fall.
This fall, CDVS will expand its existing online consultations with a new chat service and new online workshops for all members of the Duke community. Since mid-March, CDVS staff have redesigned instructional sessions, constructed new workflows for accessing research data, and built new platforms for accessing data tools virtually. We look forward to connecting with you online and working with you to achieve your research goals.
In addition to our expanded online tools and instruction, we have redesigned our CDVS-Announce data newsletter to provide a monthly update of data news, events, and workshops at Duke. We hope you will consider subscribing.
Upcoming Virtual CDVS Workshops
CDVS continues to offer a full workshops series for the latest strategies and tools for data focused research. Upcoming workshops for early September include:
R for data science: getting started, EDA, data wrangling
Thursday, Sep 1, 2020 10am – 12pm
This workshop is part of the Rfun series. R and the Tidyverse are a data-first coding language that enables reproducible workflows. In this two-part workshop, you’ll learn the fundamentals of R, everything you need to know to quickly get started. You’ll learn how to access and install RStudio, how to wrangle data for analysis, gain a brief introduction to visualization, practice Exploratory Data Analysis (EDA), and how to generate reports.
Register: https://duke.libcal.com/event/6867861
Research Data Management 101
Wednesday, Sep 9, 2020 10am – 12pm
This workshop will introduce data management practices for researchers to consider and apply throughout the research lifecycle. Good data management practices pertaining to planning, organization, documentation, storage and backup, sharing, citation, and preservation will be presented using examples that span disciplines. During the workshop, participants will also engage in discussions with their peers on data management concepts as well as learn about how to assess data management tools.
Register: https://duke.libcal.com/event/6874814
R for Data Science: Visualization, Pivot, Join, Regression
Wednesday, Sep 9, 2020 1pm – 3pm
This workshop will introduce data management practices for researchers to consider and apply throughout the research lifecycle. Good data management practices pertaining to planning, organization, documentation, storage and backup, sharing, citation, and preservation will be presented using examples that span disciplines. During the workshop, participants will also engage in discussions with their peers on data management concepts as well as learn about how to assess data management tools.
Register: https://duke.libcal.com/event/6867914
ArcGIS StoryMaps
Thursday, September 10, 2020 1pm – 2:30pm
This workshop will help you get started telling stories with maps on the ArcGIS StoryMaps platform. This easy-to-use web application integrates maps with narrative text, images, and videos to provide a powerful communication tool for any project with a geographic component. We will explore the capabilities of StoryMaps, share best practices for designing effective stories, and guide participants step-by-step through the process of creating their own application.
Register: https://duke.libcal.com/event/6878545
Assignment Tableau: Intro to Tableau work-together
Friday, September 11, 2020 10am – 11:30am
Work together over Zoom on an Intro to Tableau assignment. Tableau Public (available for both Windows and Mac) is incredibly useful free software that allows individuals to quickly and easily explore their data with a wide variety of visual representations, as well as create interactive web-based visualization dashboards. Attendees are expected to watch Intro to Tableau Fall 2019 online first, or have some experience with Tableau. This will be an opportunity to work together on the assignment from the end of that workshop, plus have questions answered live.
Register: https://duke.libcal.com/event/6878629
Interested in attending the 2020 RStudio Conference, but unable to travel to San Francisco? With the generous support of RStudio and the Department of Statistical Science, Duke Libraries will host a livestream of the annual RStudio conference starting on Wednesday, January 29th at 11AM. See the latest in machine learning, data science, data visualization, and R. Registration links and information about sessions follow. Registration is required for the first session and keynote presentations. Please see the links in the agenda that follows.
Education Track (registration is not required) Meet you where you R – Lauren Chadwick, R Studio.
Data Science Education in 2022 (Karl Howe and Greg Wilson, R Studio)
Data science education as an economic and public health intervention in East Baltimore (Jeff Leek, Johns Hopkins)
Of Teacups, Giraffes, & R Markdown (Desiree Deleon, Emory)
Location: Edge Workshop Room – Bostock 127
5:15 – 6:45
All About Shiny (registration is not required)
Production-grade Shiny Apps with golem (Colin Fay, ThinkR)
Making the Shiny Contest (Duke’s own Mine Cetinkaya-Rundel)
Styling Shiny Apps with Sass and Bootstrap 4(Joe Cheng, RStudio)
Reproducible Shiny Apps with shinymeta (Carson Stewart, RStudio)
7:00 – 8:30
Learning and Using R (registration is not required)
Learning and using R: Flipbooks (Evangeline Reynolds, U Denver)
Learning R with Humorous Side Projects (Ryan Timpe, Lego Group)
Toward a grammar of psychological Experiments (Danielle, Navaro, University of New South Wales)
R for Graphical Clinical Trial Reporting(Frank Harrell, Vanderbilt)
Data Visualization Track (registration is not required) The Glamour of Graphics (William Chase, University of Pennsylvania)
3D ggplots with rayshader (Dr. Tyler Morgan-Wall, Institute for Defense Analyses)
Designing Effective Visualizations (Miriah Meyer, University of Utah)
Tidyverse 2019-2020 (Hadley Wickham, RStudio)
3:00 – 4:00
Livestream of Rstudio Conference Sessions (registration is not required)
4:00 – 5:30
Data Visualization Track 2 (registration is not required)
Spruce up your ggplot2 visualizations with formatted text (Claus Wilke, UT Austin)
The little package that could: taking visualizations to the next level with the scales package (Dana Seidel, Plenty Unlimited)
Extending your ability to extend ggplot2 (Thomas Lin Pedersen, RStudio)
5:45 – 6:30
Career Advice for Data Scientists Panel Discussion (registration is not required)
An R workshop series by the Center for Data and Visualization Sciences.
You are invited to stop by the Edge Workshop Room on Mondays for a new Rfun program, the R Open Labs, 6-7pm, Sept. 16 through Oct. 28. No need to register although you are encouraged to double-check the R Open Labs schedule/hours. Bring your laptop!
This is your chance to polish R skills in a comfortable and supportive setting. If you’re a bit more advanced, come and help by demonstrating the supportive learning community that R is known for.
No Prerequisites, but please bring your laptop with R/RStudio installed. No skill level expected. Beginners, intermediate, and advanced are all welcome. One of the great characteristics of the R community is the supportive culture. While we hope you have attended our Intro to R workshop (or watched the video, or equivalent). This is an opportunity to learn more about R and to demystify some part of R that your find confusing.
FAQ
What are Open Labs
Open labs are semi-structured workshops designed to help you learn R. Each week brief instruction will be provided, followed by time to practice, work together, ask questions and get help. Participants can join the lab any time during the session, and are welcome to work on unrelated projects.
The Open Labs model was established by our colleagues at Columbia and adopted by UNC Chapel Hill. We’re giving this a try as well. Come help us define our direction and structure. Our goal is to connect researchers and foster a community for R users on campus.
How do I Get Started?
Attend an R Open Lab. Labs occur on Mondays, 6pm-7pm in the Edge Workshop Room in the Bostock Library. In our first meeting we will decide, as a group, which resource will guide us. We will pick one of the following resources…
R for Data Science by Hadley Wickham & Garrett Grolemund (select chapters, workbook problems, and solutions)
Please bring a laptop with R and R Studio installed. If you have problems installing the software, we can assist you with installation as time allows. Since we’re just beginning with R Open Labs, we think there will be time for one-on-one attention as well through learning and community building.
How to install R and R Studio
If you are getting started with R and haven’t already installed anything, consider using using these installation instructions. Or simply skip the installation and use one of these free cloud environments:
We’ll start at the beginning, however, R Open Labs recommends that you attend our Intro to R workshop or watch the recorded video. Being a beginner makes you part of our target audience so come ready to learn and ask questions. We also suggest working through materials from our other workshops, or any of the resource materials listed in the Attend an R Open Lab section (above). But don’t let lack of experience stop you from attending. The resources mentioned above will be the target of our learning and exploration.
As data driven research has grown at Duke, Data and Visualization Services receives an increasing number of requests for partnerships, instruction, and consultations. These requests have deepened our relationships with researchers across campus such that we now regularly interact with researchers in all of Duke’s schools, disciplines, and interdepartmental initiatives.
In order to expand the Libraries commitment to partnering with researchers on data driven research at Duke, Duke University Libraries is elevating the Data and Visualization Services department to the Center for Data and Visualization Sciences (CDVS). The change is designed to enable the new Center to:
Expand partnerships for research and teaching
Augment the ability of the department to partner on grant, development, and funding opportunities
Develop new opportunities for research, teaching, and collections – especially in the areas of data science, data visualization, and GIS/mapping research
Recognize the breadth and demand for the Libraries expertise in data driven research support
Enhance the role of CDVS activities within Bostock Libraries’ Edge Research Commons
We believe that the new Center for Data and Visualization Sciences will enable us to partner with an increasingly large and diverse range of data research interests at Duke and beyond through funded projects and co-curricular initiatives at Duke. We look forward to working with you on your next data driven project!
A goal of Duke University Libraries (DUL) is to support the growing and changing needs of the Duke research community. This can take many forms. Within Data and Visualization Services, we provide learning opportunities, consulting services, and computational resources to help Duke researchers implement their data-driven research projects. Monitoring and assessing new tools and platforms also helps DUL stay in tune with changing research norms and practices. Today the increasing focus on the importance of transparency and reproducibility has resulted in the development of new tools and resources to help researchers produce and share more reproducible results. One such tool is Code Ocean.
Code Ocean is a computational reproducibility platform that employs Docker technology to execute code in the cloud. The platform does two key things—it integrates the metadata, code, data and dependencies into a single ‘compute capsule’, ensuring that the code will run—and it does this in a single web interface that displays all inputs and results. Within the platform, it is possible to develop, edit or download the code, run routines, and visualize, save or download output, all from a personal computer. Users or reviewers can upload their own data and test the effects of changing parameters or modification of the code. Users can also share their data and code through the platform. Code Ocean provides a DOI for all capsules facilitating attribution and a permanent connection to any published work.
In order to help us understand and evaluate the usefulness of the Code Ocean platform to the Duke research community, DUL will be offering trial access to the Code Ocean cloud-based computational reproducibility platform starting on October 1, 2018. To learn more about what is included in the trial access and to sign up to participate, visit the Code Ocean pilot portal page.
Visualize, manage, and map your data in our Fall 2017 Workshop Series. Our workshops are designed for researchers who are new to data driven research as well as those looking to expand skills with new methods and tools. With workshops exploring data visualization, digital mapping, data management, R, and Stata, the series offers a wide range of different data tools and techniques. This fall, we are extending our partnership with the Graduate School and offering several workshops in our data management series for RCR credit (please see course descriptions for further details).
Everyone is welcome at Duke Libraries workshops. We hope to see you this fall!

 As we begin the new year, the Center of Data and Visualization Sciences is happy to announce a series of twenty-one data workshops designed to empower you to reach your goals in 2022. With a focus on data management, data visualization, and data science, we hope to provide a diverse set of approaches that can save time, increase the impact of your research, and further your career goals.