
Thanks to an earlier fall deadline, we are already ready to announce the winners of our fourth year of the Duke Student Data Visualization Contest. The 14 visualizations submitted highlighted some very exciting visualization work being done by students of all ages here at Duke. The winners and other submissions to the contest will soon be featured on the Duke Data Visualization Flickr Gallery.
As in the past, the submissions were judged on the basis of five criteria: insightfulness, broad appeal, aesthetics, technical merit, and novelty. The three winning submissions this year exemplify all of these and tell rich stories about three very different types of research projects. The winning submissions will be converted to larger poster versions and hung in the Brandaleone Lab for Data and Visualization Services (in the Edge). Be on the look out later this semester for a reception to celebrate their hard work! The winners will also receive Amazon gift cards. We are very grateful to Duke University Libraries for their continuing support of the contest.
First place:
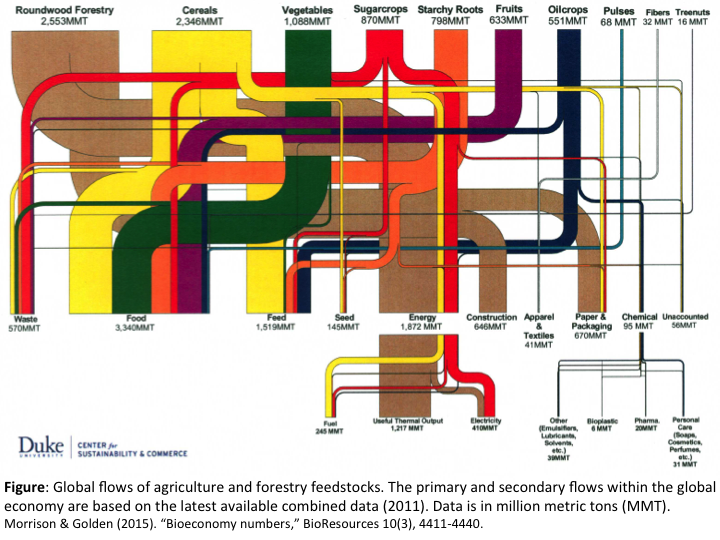
Global Flows of Agriculture and Forestry Feedstocks
Brandon Morrison, Ph.D. Candidate (Division of Earth & Ocean Sciences, NSOE)
Second place:
Feature Interpretations from Ground Penetrating Radar at Vulci, Italy
Katherine McCusker, Ph.D. Student (Art History)

Third place:
Simulated Sediment Deposition at Continental Margins
Candise Henry, Ph.D. Student (Division of Earth & Ocean Sciences, NSOE

Please join us in celebrating the outstanding work of these students!