Category Archives: Data Storage

Relational Thinking: Database Re-Modeling for Humanists

Author: Dr. Kaylee P. Alexander
Website: www.kayleealexander.com
Twitter: @kpalex91

Since the summer of 2018 I have been working with a set of nineteenth-century commercial almanacs for the city of Paris. As my dissertation focused heavily on the production of stone funerary markers during this period, I wanted to consult these almanacs to get a sense of how many workers were active in this field of production. Classified as marbriers (stonecutters), the makers of funerary monuments were often one in the same as those who executed various other stone goods and constructions. These almanacs represented a tremendous source of industry information, consistently recording enterprise names and addresses, as well as, at times, specific information about the types of products the enterprise specialized in and any awards they might have won for their work, and what types of new technologies they employed. An so I decided to make a database.

As a Humanities Unbounded graduate assistant with the Center for Data and Visualization Sciences during the summer of 2020, I had the opportunity to explore some of the issues related to database construction and management faced by humanists working on data-based research projects. In order to work out some of these issues, I worked to set up a MySQL database using my commercial almanacs data as a test case to determine which platforms and methods for creating queryable databases would be best suited for those working primarily in the humanities. In the process of setting up this database what became increasingly clear was the need to make clear the usefulness of this process for other humanists undertaking data-driven projects, as well as identify ways of transforming single spreadsheets of data into relational data models without needing to know how to code. Thus, in this blog post I offer a few key points about relational database models that may be useful for scholars in the humanities and share my experiences in constructing a MySQL database from a single Excel spreadsheet.

First of all, some key terms and concepts. MySQL is an open-source relational database management system that uses SQL (Structured Query Language) to create, modify, manage and extract data from a relational database. A relational data model organizes data into a series of tables containing columns (‘attributes’) and rows (‘records’) with unique keys identifying each record. Each table (or, ‘relation’) represents a single entity type and its corresponding attributes. When working with a relational data model you want to make sure that your tables are normalized, or organized in such a way that reduces redundancy in the data set, increases consistency, and facilitates querying.

Although for the purposes of efficient data gathering, I had initially collected all of the information from the commercial almanacs in a single Excel spreadsheet, I knew that I ultimately wanted to reconfigure my data using a relational model that could be shared with and queried efficiently by others. The main benefits of a relational model include ensuring consistency as well as performing combinations of queries to understand various relationships that exist among the information contained in the various tables that would be otherwise difficult to determine from a single spreadsheet. An additional benefit to this system is the ability to add records and edit information without the risk of compromising other information contained in the database.

The first question I needed to ask myself was which entities from my original spreadsheet would become the basis for my relational database. In other words, how would my relational model be organized? What different relationships existed within the dataset, and which variables functioned as entities rather than attributes? One of the key factors in determining which variables would become the entities of my relational model, was the question of whether or not a given variable contained repeated values throughout the master sheet. Ultimately determining the entities wasn’t the trickiest part. It because rather clear early on that it would be best to first create separate tables for businesses and business locations, which would be related via a table for annual activity (in the process of splitting my tables I would end up making more tables, but these were the key starting points).

The most difficult question I encountered was how I would go about splitting all this information as someone with very limited coding experience. How could identify unique values and populate tables with relevant attributes without having to teach myself Python in a pinch, but also without having to retype over one hundred years’ worth of business records? Ultimately, I came up with a rather convoluted system that had me going back and forth between OpenRefine and Excel. Once I got the hang of my system it became almost second nature to me but explaining it to others was another story. This made it abundantly clear that there was a lack of resources for demonstrating how one could create what were essentially a series of normalized tables from a flat data model. So, to make a very long story short, I broke down my convoluted process into a series of simple steps that required nothing more that Excel to transform a flat data model into a relational data model using the UNIQUE() and VLOOKUP() functions. This processes is detailed in a library tutorial I developed geared towards humanists, consisting of both a video demonstrating the process and a PDF containing written instructions.

In the end, all I needed to do was construct the database itself. In order to do this I worked with phpMyAdmin, a free web-based user interface for constructing and querying MySQL databases. Using phpMyAdmin, I was able to easily upload my normalized data tables, manage and query my database, and easily connect to Tableau for data visualization purposes using phpMyAdmin’s user management capabilities.


Kaylee Alexander portrait

Dr. Kaylee P. Alexander is a graduate of the Department of Art, Art History & Visual Studies, where she was also a research assistant with the Duke Art, Law & Markets Initiative (DALMI). Her dissertation research focuses on the visual culture of the cemetery and the market for funerary monuments in nineteenth-century Paris. In the summer of 2020, she served as a Humanities Unbounded graduate assistant with the Center for Data and Visualization Sciences at Duke University Libraries.

Shapefiles vs. Geodatabases

Ever wonder what the difference between a shapefile and a geodatabase is in GIS and why each storage format is used for different purposes?  It is important to decide which format to use before beginning your project so you do not have to convert many files midway through your project.

Basics About Shapefiles:

Shapefiles are simple storage formats that have been used in ArcMap since the 1990s when Esri created ArcView (the early version of ArcMap 10.3).  Therefore, shapefiles have many limitations such as:

  • Takes up more storage space on your computer than a geodatabase
  • Do not support names in fields longer than 10 characters
  • Cannot store date and time in the same field
  • Do not support raster files
  • Do not store NULL values in a field; when a value is NULL, a shapefile will use 0 instead

Users are allowed to create points, lines, and polygons with a shapefile.  One shapefile must have at least 3 files but most shapefiles have around 6 files.  A shapefile must have:

  • .shp – this file stores the geometry of the feature
  • .shx – this file stores the index of the geometry
  • .dbf – this file stores the attribute information for the feature

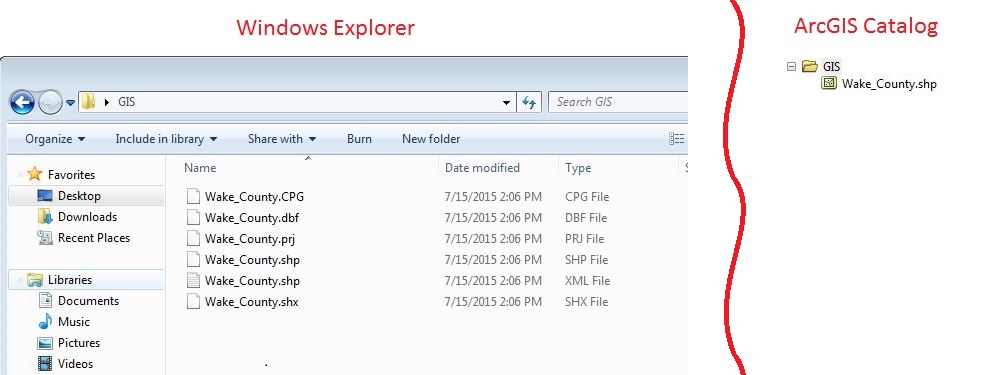
All files for the shapefile must be stored in the same location with the same name or else the shapefile will not load.  When a shapefile is opened in Windows Explorer it will look different than when opened in ArcCatalog.

Shapefile_Windows


Basics About Geodatabases:

Geodatabases allow users to thematically organize their data and store spatial databases, tables, and raster datasets.  There are two types of single user geodatabases: File Geodatabase and Personal Geodatabase.  File geodatabases have many benefits including:

  • 1 TB of storage limits of each dataset
  • Better performance capabilities than Personal Geodatabase
  • Many users can view data inside the File Geodatabase while the geodatabase is being edited by another user
  • The geodatabase can be compressed which helps reduce the geodatabases’ size on the disk

On the other hand, Personal Geodatabases were originally designed to be used in conjunction with Microsoft Access and the Geodatabase is stored as an Access file (.mdb).  Therefore Personal Geodatabases can be opened directly in Microsoft Access, but the entire geodatabase can only have 2 GB of storage.

To organize your data into themes you can create Feature Datasets within a geodatabase.  Feature datasets store Feature Classes (which are the equivalent to shapefiles) with the same coordinate system.  Like shapefiles, users can create points, lines, and polygons with feature classes; feature classes also have the ability to create annotation, and dimension features.

Geodatabase

In order to create advanced datasets (such as add a network dataset, a geometric network, a terrain dataset, a parcel fabric, or run topology on an existing layer) in ArcGIS, you will need to create a Feature Dataset.

You will not be able to access any files of a File geodatabase in Windows Explorer.  When you do, the Durham_County geodatabase shown above will look like this:

Windows2


Tips:

  • When you copy shapefiles anytime, use ArcCatalog. If you use Windows Explorer and do not select all the files for a shapefile, the shapefile will be corrupt and will not load.
  • When using a geodatabase, use a File Geodatabase. There is more storage capacity, multiple users can view/read the database at the same time, and the file geodatabase runs tools and queries faster than a Personal Geodatabase.
  • Use a shapefile when you want to read the attribute table or when you have a one or two tools/processes you need to do. Long-term projects should be organized into a File Geodatabase and Feature Datasets.
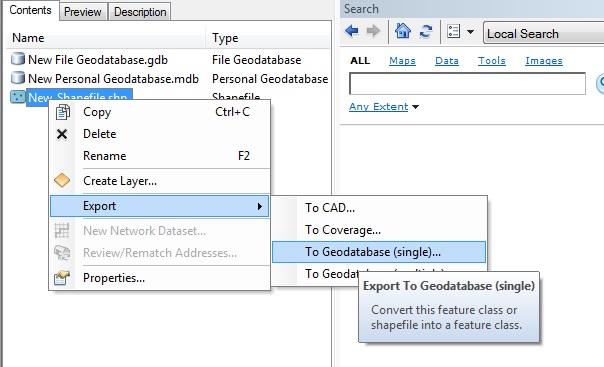
  • Many files downloaded from the internet are shapefiles. To convert them into your geodatabase, right click the shapefile, click “Export,” and select “To Geodatabase (single).”

Export_Shp

Sharing Files: Your Duke Box.com

Last fall Duke University released its newest file sharing service known as Duke’s Box.  By partnering with Box.comBox.com Logo, Duke offers a cloud-storage service which is intuitive, secure, and easy to use. Login with with your NetID, share files with colleagues, and have confidence this cloud storage is compliant with all laws and regulations regarding data privacy and security.

Simple to Use

Duke’s Box is similar to other cloud-based file storage services which support collaboration, productivity, and synchronization.  You can drop and drag files, identify collaborators and set permissions (read, edit, comment, etc.) But unlike some services, such as Dropbox or Google Drive, Duke’s Box enables you to be in compliance with data privacy and security. Additionally, you can synchronize data across your devices, at your discretion and subject to Duke’s Security & Usage Practice restrictions

While you may have previously used OIT’s NAS (Network Attached Storage) file storage service known as CIFS for data storage,  Duke’s Box is easier to use -although it provides services for slightly different use-cases. For example, CIFS might be more useful if accessing large files (e.g. video files that are larger than 5 GB). However, CIFS doesn’t enable collaboration or sharing.  Depending on your needs you may still want to use your departmental or OIT NAS.  Either way, you can use both file storage services and each service is free.

Check out this quick-start video:

50 GB of Space by Default

You are automatically provisioned 50 GB of space, but you can request more if you need more.  See the Comparison of Document Management & Collaboration Tools at Duke for details.

Individual file size limitations are throttled to less than 5 GB.  This means Duke’s Box may be less than ideal for sharing very large files. NAS services may be more appropriate for large files as the time to download or synchronize large files can become inconvenient.  But for many common file sharing cases, Duke’s Box is ideal, fast and convenient.

Documentation, Restrictions & Use

While you can store many types of files, there are best practices and restrictions you will want to review.  For example, Duke Medicine users are required to complete an online training module prior to account activation.

Sharing Your Data With Us

One of the many use-cases for Duke’s Box is a more convenient way for you to share your data with us.  As you know we welcome questions about data analysis and visualization. We know describing data can be difficult while sharing your dataset can clarify your question.   But sharing your data via email consumes a lot of resources — both yours and ours. Now there’s a better way; please share your data with us via Duke’s Box.

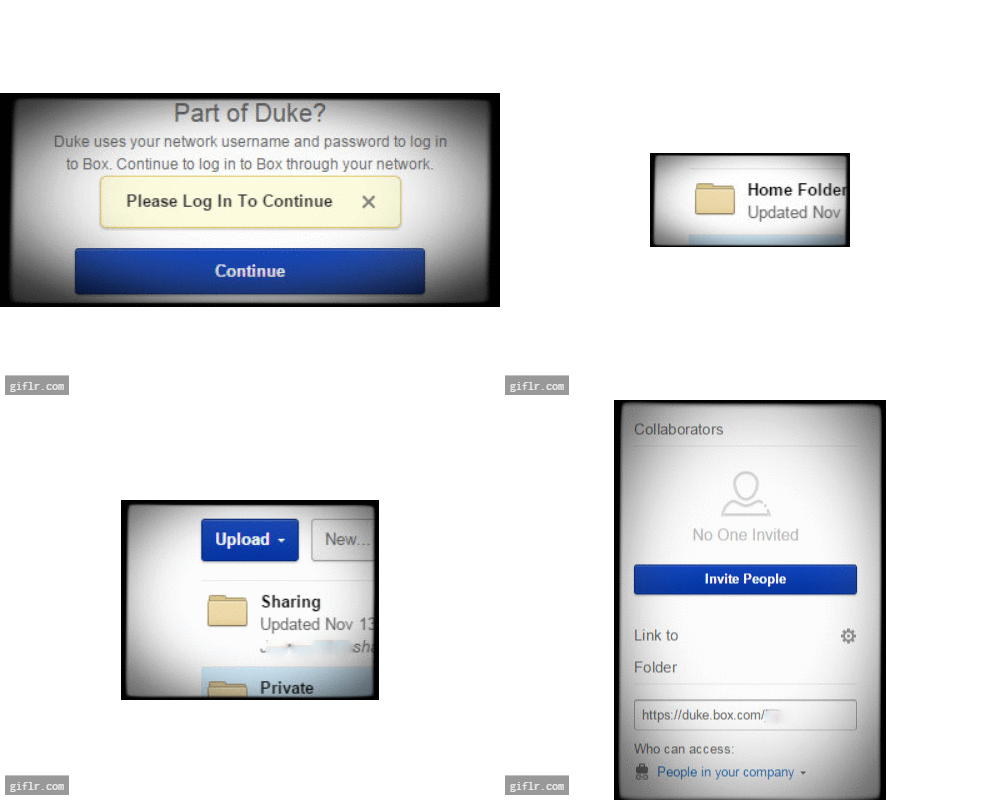
Steps for Sharing Your Data with DVS Consultants

How to Share your files - 5 second annimated loop

  1. Log into Duke’s Box  (Use the bluecontinuebutton) 
  2. Open your “homefolder
  3. Put your data in the “sharingfolder
  4. Use the “invite people” button (right-hand sidebar)
    • Using a consultant email address, invite the DVS Consultant to see your data.  (Don’t worry if you don’t have our email yet.  When you start your question at askData@duke.edu, an individual consultant will be back in touch.)