Category Archives: Data Management

Highlights from Expanding our Research Data Management Program

Since the launch of our expanded research data management (RDM) program in January, the Research Data Management Team in DVS has been busy defining and implementing our suite of services. Our “Lifecycle Services” are designed to assist scholars at all stages of their research project from the planning phase to the final curation and disposition of their data in an archive or repository. Our service model centers on four key areas: data management planning, data workflow design, data and documentation review, and data repository support. Over the past nine months, we have  worked with Duke researchers across disciplines to provide these services, allowing us to see their value in action. Below we present some examples of how we have supported researchers within our four support areas.

Data Management Planning

With increasing data management plan requirements Data Management Planningas well as growing  expectations that funding agencies will more strictly enforce and evaluate these plans, researchers are seeking assistance ensuring their plans comply with funder requirements. Through in-person consultations and online review through the DMPTool, we have helped researchers enhance their DMPs for a variety of funding agencies including the NSF Sociology Directorate, the Department of Energy, and the NSF Computer & Information Science & Engineering (CISE) Program.

Data Workflow Design

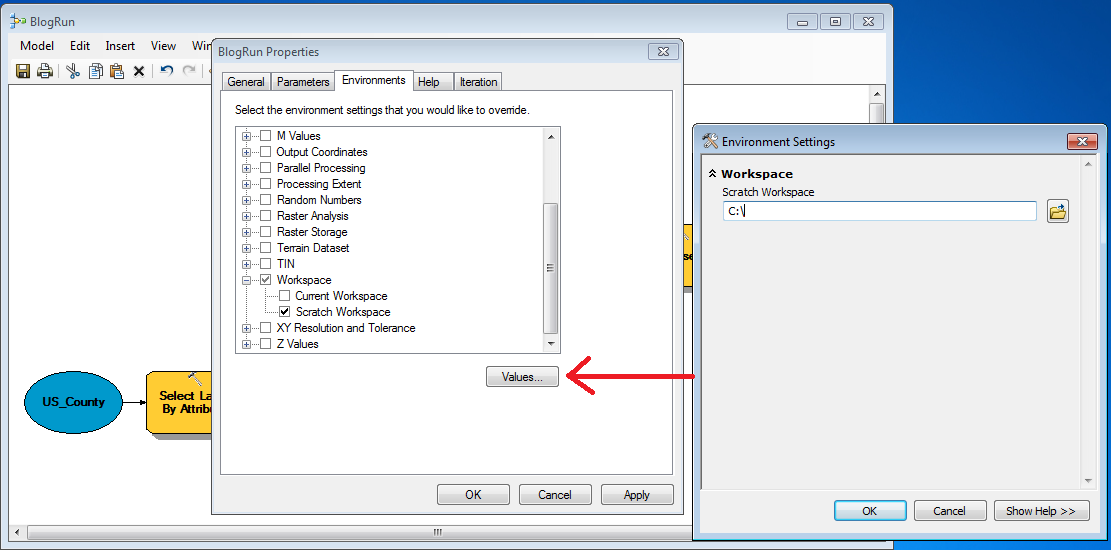
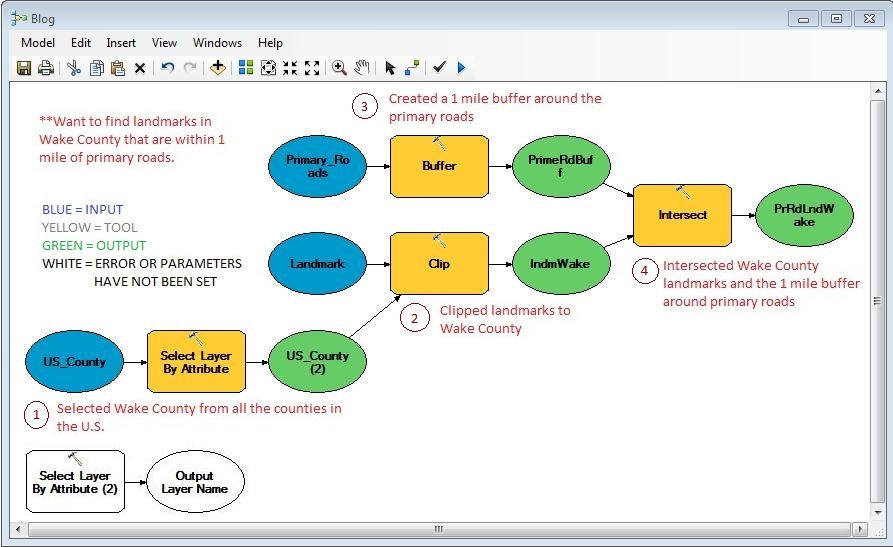
As research teams begin a project there are a variety Data Workflow Designof organizational and workflow decisions that need to be made from selecting appropriate tools to implementing storage and backup strategies (to name a few). Over the past 6 months, we have had the opportunity to help a multi-institutional Duke Marine Lab Behavioral Response Study (BRS) implement their project workflow using the Open Science Framework (OSF). We have worked with project staff to think through the organization of materials, provided training on the use of the tool, and strategized on storage and backup options.

Data and Documentation Review

During a project, researchers make decisions about how to format, Data and Documentation Reviewdescribe, and structure their data for sharing and preservation. Questions may also arise surrounding how to ethically share human subjects data and navigate intellectual property or copyright issues. In conversations with researchers, we have provided suggestions for what formats are best for portability and preservation, discussed their documentation and metadata plans, and helped resolve intellectual property questions for secondary data.

Data Repository Support

At the end of a project, researchers may be required Data Repository Supportor choose to deposit their data in an archive or repository. We have advised faculty and students on repository options based on their discipline, data type, and repository features. One option available to the Duke community is the Duke Digital Repository. Over the past nine months, we have assisted with the curation of a variety of datasets deposited within the DDR, many of which underlie journal publications.

This year Duke news articles have featured two research studies with datasets archived within the DDR, one describing a new cervical cancer screening device and another presenting cutting-edge research on a potential new state of matter. The accessibility of both Asiedu et al.’s screening device data and Charbonneau and Yaida’s glass study data enhances the overall transparency and reproducibility of these studies.

Our experiences thus far have enabled us to better understand the diversity of researchers’ needs and allowed us to continue to hone and expand our knowledge base of data management best practices, tools, and resources. We are excited to continue to work with and learn from researchers here at Duke!

Open Science Framework @ Duke

Center for Open ScienceThe Open Science Framework (OSF) is a free, open source project management tool developed and maintained by the Center for Open Science (COS). OSF offers many features that can help scholars manage their workflow and outputs throughout the research lifecycle. From collaborating effectively, to managing data, code, and protocols in a centralized location, to sharing project materials with the broader research community, the OSF provides tools that support openness, research integrity, and reproducibility. Some of the key functionalities of the OSF include:

  • Integrations with third-party tools that researchers already use (i.e., Box, Google Drive, GitHub, Mendeley, etc.)
  • Hierarchical organizational structures
  • Unlimited native OSF storage*
  • Built-in version control
  • Granular privacy and permission controls
  • Activity log that tracks all project changes
  • Built-in collaborative wiki and commenting pane
  • Analytics for public projects
  • Persistent, citable identifiers for projects, components, and files along with Digital Object Identifiers (DOIs) and Archival Resource Keys (ARKs) available for public OSF projects
  • And more!

Duke University is a partner institution with OSF, meaning  you can sign into the OSF using your NetID and affiliate your projects with Duke. Visit the Duke OSF page to see some Duke research projects and outputs from our community.

Duke University Libraries has also partnered with COS to host a workshop this fall entitled “Increasing Openness and Reproducibility in Quantitative Research.” This workshop will teach participants how they can increase the reproducibility of their work and will include hands-on exercises using the OSF.

Workshop Details
Date: October 3, 2017
Time: 9 am to 12 pm
Register:
http://duke.libcal.com/event/3433537

If you are interested in affiliating an existing OSF project, want to learn more about how the OSF can support your workflow, or would like a demonstration of the OSF, please contact askdata@duke.edu.

*Individual file size limit of 5 GB. Users can upload larger files by connecting third party add-ons to their OSF projects.

Fall Data and Visualization Workshops

2017 Data and Visualization Workshops

Visualize, manage, and map your data in our Fall 2017 Workshop Series.  Our workshops are designed for researchers who are new to data driven research as well as those looking to expand skills with new methods and tools. With workshops exploring data visualization, digital mapping, data management, R, and Stata, the series offers a wide range of different data tools and techniques. This fall, we are extending our partnership with the Graduate School and offering several workshops in our data management series for RCR credit (please see course descriptions for further details).

Everyone is welcome at Duke Libraries workshops.  We hope to see you this fall!

Workshop Series by Theme

Data Management

09-13-2017 – Data Management Fundamentals
09-18-2017 – Reproducibility: Data Management, Git, & RStudio 
09-26-2017 – Writing a Data Management Plan
10-03-2017 – Increasing Openness and Reproducibility in Quantitative Research
10-18-2017 – Finding a Home for Your Data: An Introduction to Archives & Repositories
10-24-2017 – Consent, Data Sharing, and Data Reuse 
11-07-2017 – Research Collaboration Strategies & Tools 
11-09-2017 – Tidy Data Visualization with Python

Data Visualization

09-12-2017 – Introduction to Effective Data Visualization 
09-14-2017 – Easy Interactive Charts and Maps with Tableau 
09-20-2017 – Data Visualization with Excel
09-25-2017 – Visualization in R using ggplot2 
09-29-2017 – Adobe Illustrator to Enhance Charts and Graphs
10-13-2017 – Visualizing Qualitative Data
10-17-2017 – Designing Infographics in PowerPoint
11-09-2017 – Tidy Data Visualization with Python

Digital Mapping

09-12-2017 – Intro to ArcGIS Desktop
09-27-2017 – Intro to QGIS 
10-02-2017 – Mapping with R 
10-16-2017 – Cloud Mapping Applications 
10-24-2017 – Intro to ArcGIS Pro

Python

11-09-2017 – Tidy Data Visualization with Python

R Workshops

09-11-2017 – Intro to R: Data Transformations, Analysis, and Data Structures  
09-18-2017 – Reproducibility: Data Management, Git, & RStudio 
09-25-2017 – Visualization in R using ggplot2 
10-02-2017 – Mapping with R 
10-17-2017 – Intro to R: Data Transformations, Analysis, and Data Structures
10-19-2017 – Developing Interactive Websites with R and Shiny 

Stata

09-20-2017 – Introduction to Stata
10-19-2017 – Introduction to Stata 


Love Your Data Week (Feb. 13-17)

In cooperation with the Triangle Research Library Network, Duke Libraries will be participating in Love Your Data Week on February 13-17, 2017. Love Your Data Week is an international event to help researchers take better care of their data. The campaign focuses on raising awareness and building community around data management, sharing, preservation, and reuse.

The theme for Love Your Data Week 2017 is data quality, with a related message for each day.

  • Monday: Defining Data Quality
  • Tuesday: Documenting, Describing, and Defining
  • Wednesday: Good Data Examples
  • Thursday: Finding the Right Data
  • Friday: Rescuing Unloved Data

Throughout the week, Data and Visualization Services will be contributing to the conversation on Twitter (@duke_data). We will also host the following local programming related to the daily themes:

In honor of Love Your Data Week chocolates will be provided at these workshops!

The new Research Data Management staff at the Duke Libraries are available to help researchers care for their data through consultations, support services, and instruction.  We can assist with writing data management plans that comply with funder policies, advise on data management best practices, and facilitate the ingest of data into repositories. To learn more about general data management best practices, see our newly updated RDM guide

Contact us at askdata@duke.edu to find out how we can help you love your data! 

Get involved in Love Your Data Week by following the conversation at #LYD17, #loveyourdata, and #trlndata.

All promotional Love Your Data 2017 materials used under a Creative Commons Attribution 4.0 International License.

Citation: Bass, M., Neeser, A., Atwood, T., and Coates, H. (2017). Love Your Data Week Promotional Materials. [image files]. Retrieved from https://osf.io/r8tht/files/

New Data Management Services @ Duke

Data ManagementDuke Libraries are happy to announce a new set of research data management services designed to help researchers secure grant funding, increase research impact, and preserve valuable data. Building on the recommendations of the Digital Research Faculty Working Group and the Duke Digital Research Data Services and Support report, Data and Visualization Services have added two new research data management consultants who are available to work with researchers across the university and medical center on a broad range of data management concerns from data creation to data curation.

Interested in learning more about data management?

Our New Data Management Consultants

sophialh2Sophia Lafferty-Hess attended the University of North Carolina at Chapel Hill where she received a Master of Science in Information Science and Master of Public Administration. Prior to coming to Duke, Sophia worked at the Odum Institute for Research in Social Science at UNC-Chapel Hill within the Data Archive as a Research Data Manager. In this position, Sophia provided consultations to researchers on data management best practices, curated research data to support long-term preservation and reuse, and provided training and instruction on data management policies, strategies, and tools.

While at Odum, Sophia also helped lead the development of a data curation and verification service for journals to help enforce data sharing and replication policies, which included verifying that data meet quality standards for reuse and that the data and code can properly reproduce the analytic results presented in the article. Sophia’s current research interests include the impact of journal data sharing policies on data availability and the development of data curation workflows.

jen2Jen Darragh comes to us from Johns Hopkins University where she served for the past seven years as the Data Services and Sociology Librarian, and Hopkins Population Center Restricted Projects Coordinator.  In this position, Jen  developed the libraries’ Restricted Data Room and designed the secure data enclave spaces and staff support for the Johns Hopkins Population Center.

Jen received her Bachelor of Arts Degree in Psychology from Westminster College (PA) and her Master of Library and Information Sciences degree from the University of Pittsburgh.  She has been involved with socio-behavioral research data throughout her career.  Jen is particularly interested in the development of centralized, controlled data access for sensitive human subjects’ data (subject to HIPAA or FERPA requirements) to facilitate broader, yet more secure sharing of existing research data as a means to produce new, cutting-edge research.


Duke Libraries and SSRI welcome Mara Sedlins!

On behalf of Duke Libraries and the Social Science Research Institute, I am happy to welcome Mara Sedlins to Duke.  As the library and SSRI work to develop a rich set of data management, analysis, and archiving strategies for Duke researchers, Mara’s postdoctoral position provides a unique opportunity to work closely with researchers across campus to improve both training and workflows for data curation at Duke.  – Joel Herndon, Head of Data and Visualization Services, Duke Libraries  

2016-08-25 11.06.17 HDRI am excited to join the Data and Visualization Services team this fall as a postdoctoral fellow in data curation for the social sciences (sponsored by CLIR and funded by the Alfred P. Sloan Foundation). For the next two years, I will be working with Duke Libraries and the Social Science Research Institute to develop best practices for managing a variety of research data in the social sciences.

My research background is in social and personality psychology. I received my PhD at the University of Washington, where I worked to develop and validate a new measure of automatic social categorization – to what extent do people, automatically and without conscious awareness, sort faces into socially constructed categories like gender and race? The measure has been used in studies examining beliefs about human genetic variation and the racial labels people assign to multiracial celebrities like President Barack Obama.

While in Seattle, I was also involved in several projects at Microsoft Research assessing computer-supported cooperative work technologies, focusing on people’s preferences for different types of avatar representations, compared to video or audio-only conferencing. I also have experience working with data from a study of risk factors for intimate partner violence, managing a database of donors and volunteers for a historical archive, and organizing thousands of high-resolution images for a large-scale digital comic art restoration project.

I look forward to applying the insights gained from working on a diverse array of data-intensive projects to the problem of developing and promoting best practices for data management throughout the research lifecycle.  I am particularly interested in questions such as:

  • How can researchers write actionable data management plans that improve the quality of their research?
  • What strategies can be used to organize and document data files during a project so that it’s easy to find and understand them later?
  • What steps need to be taken so that data can be discovered and re-used effectively by other researchers?

These are just a few of the questions that are central to the rapidly evolving field of data curation for the sciences and beyond.


Data and Visualization Spring 2016 Workshops

Spring 2016 DVS WorkshopsSPRING 2016: Data and Visualization Workshops 

Interested in getting started in data driven research or exploring a new approach to working with research data?  Data and Visualization Services’ spring workshop series features a range of courses designed to showcase the latest data tools and methods.  Begin working with data in our Basic Data Cleaning/Analysis or the new Structuring Humanities Data  workshop.  Explore data visualization in the Making Data Visual class.  Our wide range of workshops offers a variety of approaches for the meeting the challenges of 21st century data driven research.   Please join us!

Workshop by Theme

DATA SOURCES

DATA CLEANING AND ANALYSIS

DATA ANALYSIS

MAPPING AND GIS

DATA VISUALIZATION

* – For these workshops, no prior experience with data projects is necessary!  These workshops are great introductions to basic data practices.

Shapefiles vs. Geodatabases

Ever wonder what the difference between a shapefile and a geodatabase is in GIS and why each storage format is used for different purposes?  It is important to decide which format to use before beginning your project so you do not have to convert many files midway through your project.

Basics About Shapefiles:

Shapefiles are simple storage formats that have been used in ArcMap since the 1990s when Esri created ArcView (the early version of ArcMap 10.3).  Therefore, shapefiles have many limitations such as:

  • Takes up more storage space on your computer than a geodatabase
  • Do not support names in fields longer than 10 characters
  • Cannot store date and time in the same field
  • Do not support raster files
  • Do not store NULL values in a field; when a value is NULL, a shapefile will use 0 instead

Users are allowed to create points, lines, and polygons with a shapefile.  One shapefile must have at least 3 files but most shapefiles have around 6 files.  A shapefile must have:

  • .shp – this file stores the geometry of the feature
  • .shx – this file stores the index of the geometry
  • .dbf – this file stores the attribute information for the feature

All files for the shapefile must be stored in the same location with the same name or else the shapefile will not load.  When a shapefile is opened in Windows Explorer it will look different than when opened in ArcCatalog.

Shapefile_Windows


Basics About Geodatabases:

Geodatabases allow users to thematically organize their data and store spatial databases, tables, and raster datasets.  There are two types of single user geodatabases: File Geodatabase and Personal Geodatabase.  File geodatabases have many benefits including:

  • 1 TB of storage limits of each dataset
  • Better performance capabilities than Personal Geodatabase
  • Many users can view data inside the File Geodatabase while the geodatabase is being edited by another user
  • The geodatabase can be compressed which helps reduce the geodatabases’ size on the disk

On the other hand, Personal Geodatabases were originally designed to be used in conjunction with Microsoft Access and the Geodatabase is stored as an Access file (.mdb).  Therefore Personal Geodatabases can be opened directly in Microsoft Access, but the entire geodatabase can only have 2 GB of storage.

To organize your data into themes you can create Feature Datasets within a geodatabase.  Feature datasets store Feature Classes (which are the equivalent to shapefiles) with the same coordinate system.  Like shapefiles, users can create points, lines, and polygons with feature classes; feature classes also have the ability to create annotation, and dimension features.

Geodatabase

In order to create advanced datasets (such as add a network dataset, a geometric network, a terrain dataset, a parcel fabric, or run topology on an existing layer) in ArcGIS, you will need to create a Feature Dataset.

You will not be able to access any files of a File geodatabase in Windows Explorer.  When you do, the Durham_County geodatabase shown above will look like this:

Windows2


Tips:

  • When you copy shapefiles anytime, use ArcCatalog. If you use Windows Explorer and do not select all the files for a shapefile, the shapefile will be corrupt and will not load.
  • When using a geodatabase, use a File Geodatabase. There is more storage capacity, multiple users can view/read the database at the same time, and the file geodatabase runs tools and queries faster than a Personal Geodatabase.
  • Use a shapefile when you want to read the attribute table or when you have a one or two tools/processes you need to do. Long-term projects should be organized into a File Geodatabase and Feature Datasets.
  • Many files downloaded from the internet are shapefiles. To convert them into your geodatabase, right click the shapefile, click “Export,” and select “To Geodatabase (single).”

Export_Shp

DVS Fall Workshops

GenericWorkshops-01Data and Visualization Services is happy to announce its Fall 2015 Workshop Series.  With a range of workshops covering basic data skills to data visualization, we have a wide range of courses for different interests and skill levels..  New (and redesigned) workshops include:

  • OpenRefine: Data Mining and Transformations, Text Normalization
  • Historical GIS
  • Advanced Excel for Data Projects
  • Analysis with R
  • Webscraping and Gathering Data from Websites

Workshop descriptions and registration information are available at:

library.duke.edu/data/news


Workshop
 

Date

OpenRefine: Data Mining and Transformations, Text Normalization
Sep 9
Basic Data Cleaning and Analysis for Data Tables
Sep 15
Introduction to ArcGIS
Sep 16
Easy Interactive Charts and Maps with Tableau
Sep 18
Introduction to Stata
Sep 22
Historical GIS
Sep 23
Advanced Excel for Data Projects
Sep 28
Easy Interactive Charts and Maps with Tableau
Sep 29
Analysis with R
Sep 30
ArcGIS Online
Oct 1
Web Scraping and Gathering Data from Websites
Oct 2
Advanced Excel for Data Projects
Oct 6
Basic Data Cleaning and Analysis for Data Tables
Oct 7
Introduction to Stata
Oct 14
Introduction to ArcGIS
Oct 15
OpenRefine: Data Mining and Transformations, Text Normalization
Oct 20
Analysis with R
Oct 20


ModelBuilder

Ever have trouble conceptualizing your project workflow?  ModelBuilder  allows you to plan your project before you run any tools.  When using ModelBuilder in ESRI’s ArcMap, you create a workflow of your project by adding the data and tools you need.  To open ModelBuilder, click the ModelBuilder icon     (MB_Icon) in the Standard Toolbar.

MBIcon

Key Points Before You Build Your Model

ModelBuilder can only be created and saved in a toolbox.  In order to create your model, you first need to create a new toolbox in the Toolboxes, MyToolboxes folders in ArcCatalog.  Once you have a new toolbox, you will need to create a new Model; to do this, right click your newly created toolbox and select New, then Model.  When you wish to open an existing ModelBuilder, find your toolbox, right click your Model and select Edit.

In order to find the results of your model and the data created in the middle of your project workflow (also known as intermediate data), you will need to direct the data to any workspace or a Scratch Geodatabase.  To set your data results to a Scratch Geodatabase in ModelBuilder, click Model, then Model Properties.  A dialog box will open and you will want to select the Environments tab, Workspace category, and check Scratch Workspace.  Before closing the dialog box, select “Values” and navigate to your workspace or your geodatabase.

Set_Workspace

Building and Running a Model

To create a model, click the Add Data or Tool button (AddData).  Navigate to the SystemToolboxes, find the tool you wish to run, and add it to your model.  Double click the tool within the Model and its parameters will open.  Fill out the appropriate fields for the tool and select OK.

When the tools or variables are ready for processing, they will be colored blue, green, or yellow.  Blue variables are inputs, yellow variables are tools, and green variables are outputs.  When there is an error or the parameters have not been chosen, the variables will have no color.

ModelBlog_Good

Once you have your model built, click the Run icon (MBRun) to run the model.  Depending on the data and the amount of tools you run, the Model can take seconds or minutes to run.  You can also run one tool at a time; to do this, right click the tool and select “Run.”  When the Model is done running, the tools and outputs will have a gray background.  To find the results of your model, navigate to the Scratch Workspace you have set and add the shapefile or table to ArcMap or right-click the output variable before running the model and select “Add to Display.”

Applying ModelBuilder

The model above demonstrates how to take nationwide county data, North Carolina landmark data and North Carolina major roads data and find landmarks in Wake County that are within 1 mile of major roads.  The first tool in the model (Select Layer by Attribute tool) extracts Wake County from the nationwide counties polygon layer. 1

Once Wake County is extracted to a new layer, the North Carolina landmarks layer is clipped to the Wake County layer using the Clip tool2 The result of this tool creates a landmarks point layer in Wake County.  The third tool uses the Buffer tool on the primary roads layer in North Carolina.  Within the Buffer tool parameters, a distance of 1 mile is chosen and a new polygon layer is created.


Finally, the Wake County landmarks layer is intersected with the buffered major roads layer to create a final output using the Interect tool.4  Using ModelBuilder has many benefits: you document the steps you used to create your project and you can easily rerun the tool with different inputs after the model is built.  ModelBuilder allows users to easily determine if and where problems in the workflow are.  When there is an error in the workflow, a “Failed to Execute” message will appear and tell users which tool was unable to execute.  ModelBuilder also lets users easily change parameters.  In the model used above, you could change the Expression in the Select Layer by Attribute tool from ‘Wake’ to ‘Durham’ and find landmarks within 1 mile of major roads in Durham County.