Need held curating your data or identifying a repository to share data? Helenmary can help!
CDVS welcomes Helenmary Sheridan as the third member of the research data management (RDM) team. Helenmary joined Duke in August 2024 to help the library scale up classes, group trainings, and individualized consultations on RDM topics including NIH data management plans, data sharing in repositories such as the Duke Research Data Repository, and improving research reproducibility through documentation. Her position is supported by the Compute and Data Services Alliance for Research (CDSA), a new cross-campus initiative to support researchers with their computational needs.
Prior to joining Duke, Helenmary was the Data Services Librarian at the health sciences library at the University of Pittsburgh, where she provided data management training to faculty, staff, and students across the health disciplines. She has nearly ten years of experience working with scientific metadata and file formats, especially for data from imaging research (biomedical and otherwise.)
Helenmary’s favorite part of her job is teaching, especially Introduction to Research Data Management workshops for new graduate students and faculty that may be their first formal experience with research data methods. “It sounds like a dry subject,” she says, “so I love to see how excited researchers get when they realize how much easier these tools can make their lives.” You can contact Helenmary through the CDVS inbox at: askdata@duke.edu.
GIS Day is an international celebration of geographic information systems (GIS) technology. The event provides an opportunity for users of geospatial data and tools to build knowledge, share their work, and explore the benefits of GIS in their communities. Since its establishment in 1999, GIS Day events have been organized by nonprofit organizations, universities, schools, public libraries, and government agencies at all levels.
Held annually on the third Wednesday of November, this year GIS Day is officially today. Happy GIS Day! CDVS has participated in Duke GIS Day activities on campus in past years, but with COVID-19, we had to find other ways to celebrate.
A (Virtual) Map Showcase
To mark GIS Day this year, CDVS is launching an ArcGIS StoryMaps showcase! We invite any students, faculty, and staff to submit a story map to highlight their mapping and GIS work. Send us an email at askdata@duke.edu if you would like to add yours to the collection. We are keen to showcase the variety of GIS projects happening across Duke, and we will add contributions to the collection as we receive them. Our first entry is a story map created by Kerry Rork as part of a project for undergraduate students that used digital mapping to study the English CivilWars.
Why Story Maps?
If you aren’t familiar with ArcGIS StoryMaps, this easy-to-use web application integrates maps with narrative text, images, and video. The platform’s compelling, interactive format can be an effective communication tool for any project with a geographic component. We have seen a surge of interest in story maps at Duke, with groups using them to present research, give tours, provide instruction. Check out the learning resources to get started, or contact us at askdata@duke.edu to schedule a consultation with one of our GIS specialists.
One of the attractive features of Tableau for visualization is that it can produce maps in addition to standard charts and graphs. While Tableau is far from being a full-fledged GIS application, it continues to expand its mapping capabilities, making it a useful option to show where something is located or to show how indicators are spatially distributed.
Here, we’re going to go over a few of the Tableau’s mapping capabilities. We’ve recorded a workshop with examples relating to this blog post’s discussion:
Tableau is a visualization tool: Tableau can quickly and effectively visualize your data, but it will not do specialized statistical or spatial analysis.
Tableau makes it easy to import data: A big advantage of Tableau is the simplicity of tasks such as changing variable definitions between numeric, string, and date, or filtering out unneeded columns. You can easily do this at the time you connect to the data (“connect” is Tableau’s term for importing data into the program).
Tableau is quite limited for displaying multiple data layers: Tableau wants to display one layer, so you need to use join techniques to connect multiple tables or layers together. You can join data tables based on common attribute values, but to overlay two geographic layers (stack them), you must spatially join one layer to one other layer based on their common location.
Tableau uses a concept that it calls a “dual-axis” map to allow two indicators to display on the same map or to overlay two spatial layers. If, however, you do need to overlay a lot of data on the same map, consider using proper GIS software.
Overlay spatial files using dual-axis maps
Displaying paths on a map requires a special data structure: In order for tabular data with coordinate values (latitude/longitude) to display as lines on a map, you need to include a field that indicates drawing order. Tableau constructs the lines like connect-the-dots, each row of data being a dot, and the drawing order indicating how the dots are connected.
Using drawing order to create lines from points
You might use this, for instance, with hurricane tracking data, each row representing measurements and location collected sequentially at different times. The illustration above shows Paris metro lines with the station symbol diameter indicating passenger volume. See how to do this in Tableau’s tutorial.
You can take advantage of Tableau’s built-in geographies: Tableau has many built-in geographies (e.g., counties, states, countries), making it easy to plot tabular data that has an attribute with values for these geographic locations, even if you don’t have latitude/longitude coordinates or geographic files — Tableau will look up the places for you! (It won’t, however, look up addresses.)
Tableau also has several built-in base maps available for your background.
Tableau uses the “Web Mercator” projection: This is the same as Google Earth/Maps. Small-scale maps (i.e., large area of coverage) may look stretched out in an unattractive way since it greatly exaggerates the size of areas near the poles.
Useful Mapping Capabilities
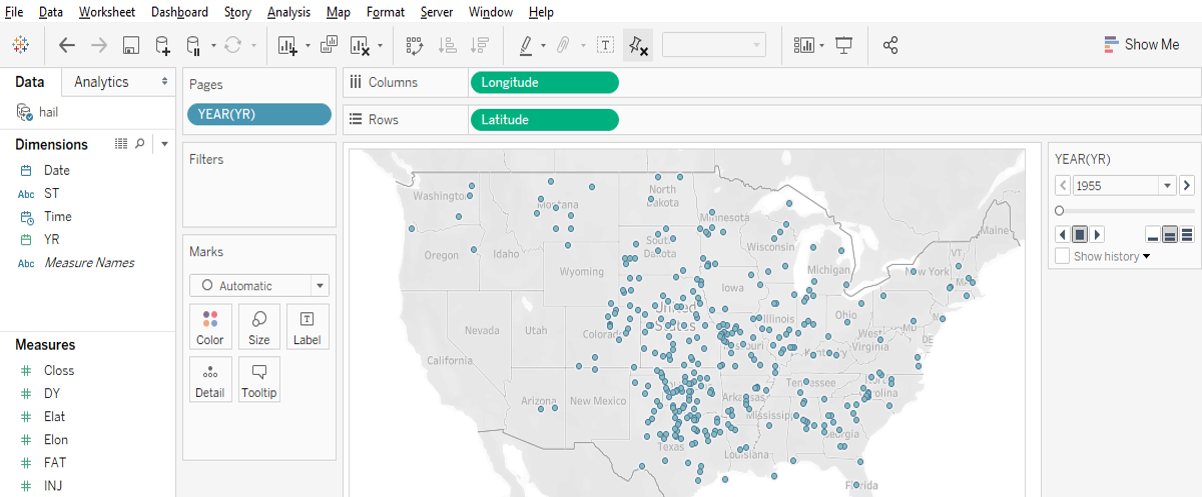
Plot points: Tableau works really well for plotting coordinate data (Longitude (X) and Latitude (Y) values) as points. The coordinates must have values in decimal degrees with negative longitudes being east of Greenwich and negative latitudes being south of the equator.
Point data with time slider
Time slider: If you move a categorical “Dimension” variable onto Tableau’s Pages Card, you can get a value-based slider to filter your data by that variable’s values (date, for instance, as in Google Earth). This is shown in the image above.
Heatmap of point distribution: You can choose Tableau’s “Density” option on its Marks card to create a heatmap, which may display the concentration of your data locations in a smoother manner.
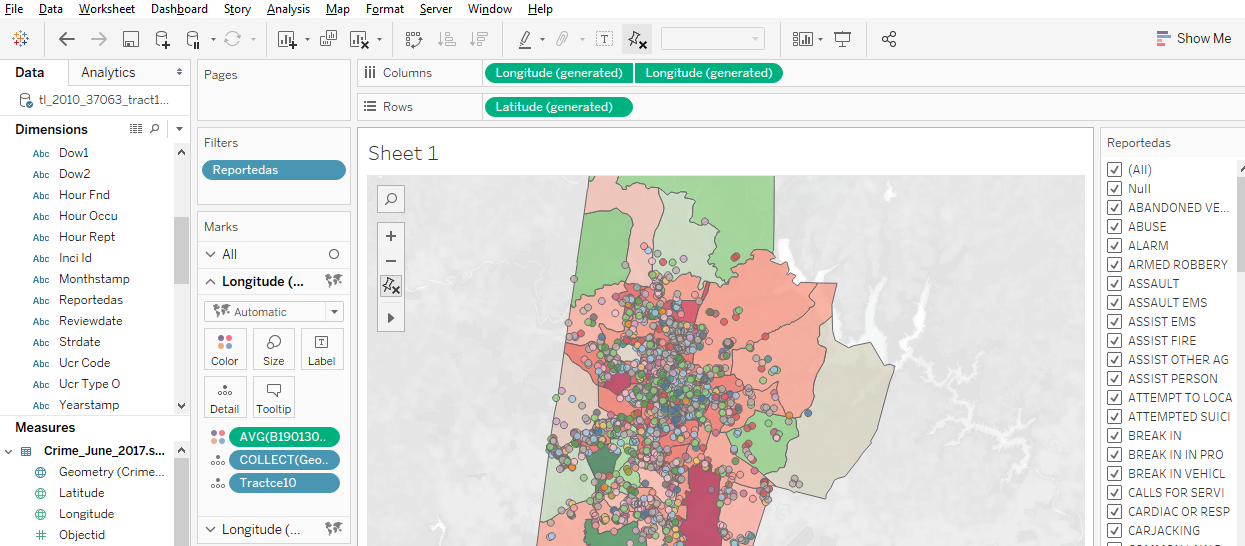
Filter a map’s features: Tableau’s Filter card is akin to ArcGIS’s Definition Query, to allow you to look at just a subset of the features in a data table.
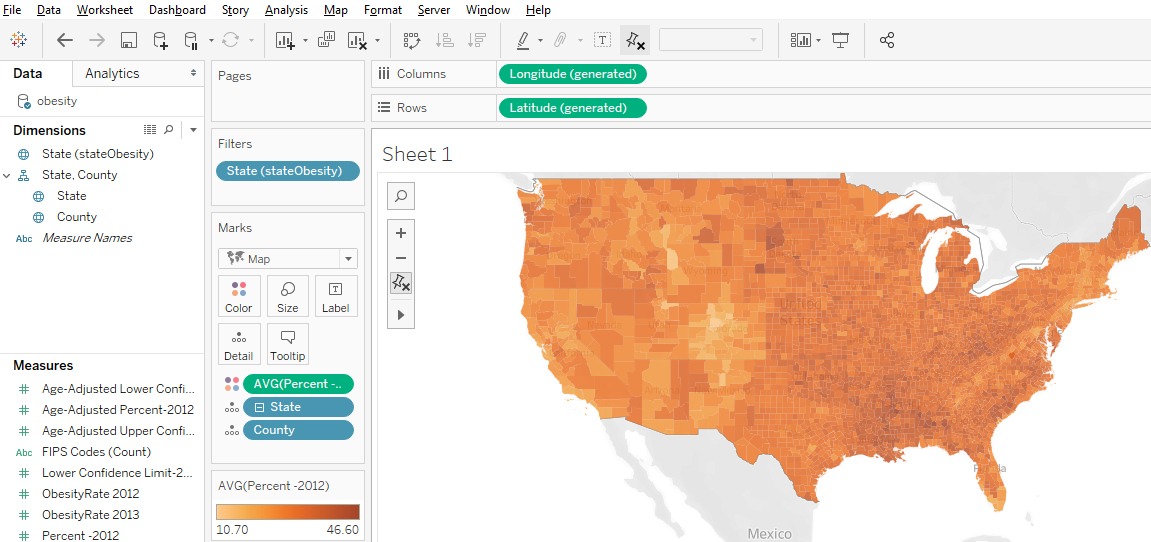
Shade polygons to reflect attribute values: Choropleth maps (polygons shaded to represent values of a variable) are easy to make in Tableau. Generally, you’ll have a field with values that match a built-in geography, like countries of the world or US counties. But you can also connect to spatial files (e.g., Esri shapefiles or GeoJSON files), which is especially helpful if the geography isn’t built into Tableau (US Census Tracts are an example).
Filled map using color to indicate values
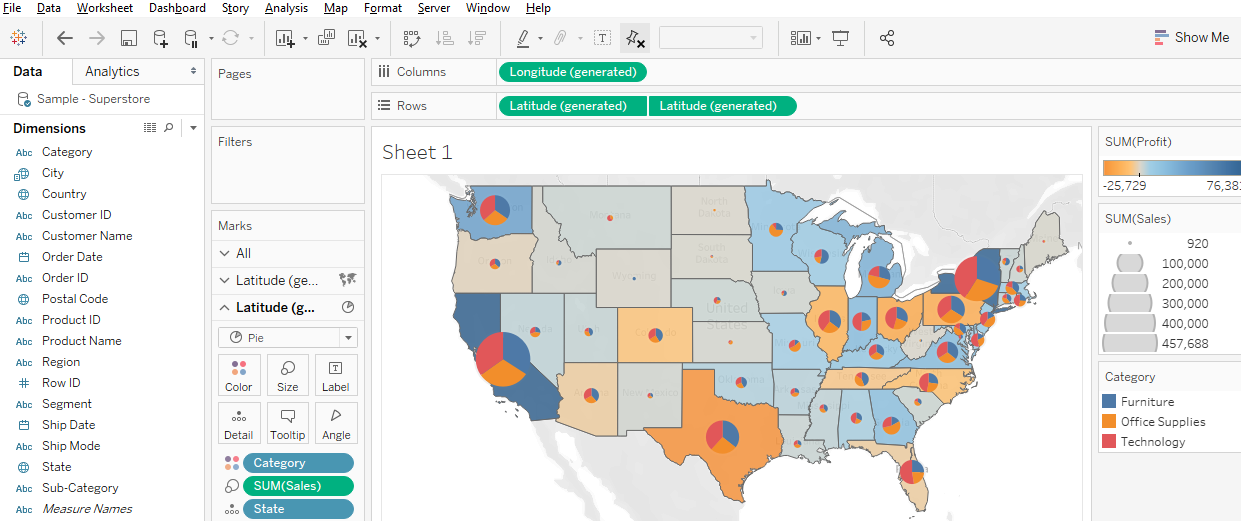
Display multiple indicators: Visualizing two variables on the same map is always problematic because the data patterns often get hidden in the confusion, but it is possible in Tableau. Use the “dual-axis” map concept mentioned above. An example might be pies for one categorical variable (with slices representing the categories) on top of choropleth polygons that visualize a continuous numeric variable.
Two variables using filled polygons and pies
Draw lines from tabular data: Tableau can display lines if your data is structured right, as discussed and illustrated previously, with a field for drawing order. You could also connect to a spatial line file, such as a shapefile or a GeoJSON file.
Help Resources
We’ve just given an overview of some of Tableau’s capabilities regarding spatial data. The developers are adding features in this area all the time, so stay tuned!