
![]()
In 2024, the GIS software ArcGIS Desktop (also known as ArcMap) will no longer be available through Duke’s education license. Esri has been encouraging users to upgrade to their more modern GIS software, ArcGIS Pro, or cloud-based platforms such as ArcGIS Online. CDVS’s GIS workshop series has not included an ArcMap session for the past several years, and we have been encouraging anyone interested in learning GIS software to start with ArcGIS Pro. You can read more details about the process in Esri’s blog post, ArcMap Retirement in Education Programs.
While the transition away from ArcMap has been moving forward, we occasionally hear from students and faculty who are still using this software. If you have yet to make the switch from ArcMap to ArcGIS Pro or ArcGIS Online, please consider doing so this semester.
Fortunately, there are many resources available to help you navigate the shift. Esri provides dozens of free, self-paced online tutorials about ArcGIS Pro and ArcGIS Online. You may also want to explore their tutorial series Modern GIS. For those looking for a more personal and interactive learning experience, we are offering several GIS workshops in Fall 2023. Finally, the in-depth Migrate to ArcGIS Pro (log-in required) documentation includes a training video and guide that address topics like migrating Python scripts and importing styles from ArcMap.
These guides should explain everything you might want to know (and much more) about the change. If you still have questions or want to learn more about other software options, please don’t hesitate to contact one of our GIS specialists by sending an email to askdata@duke.edu.

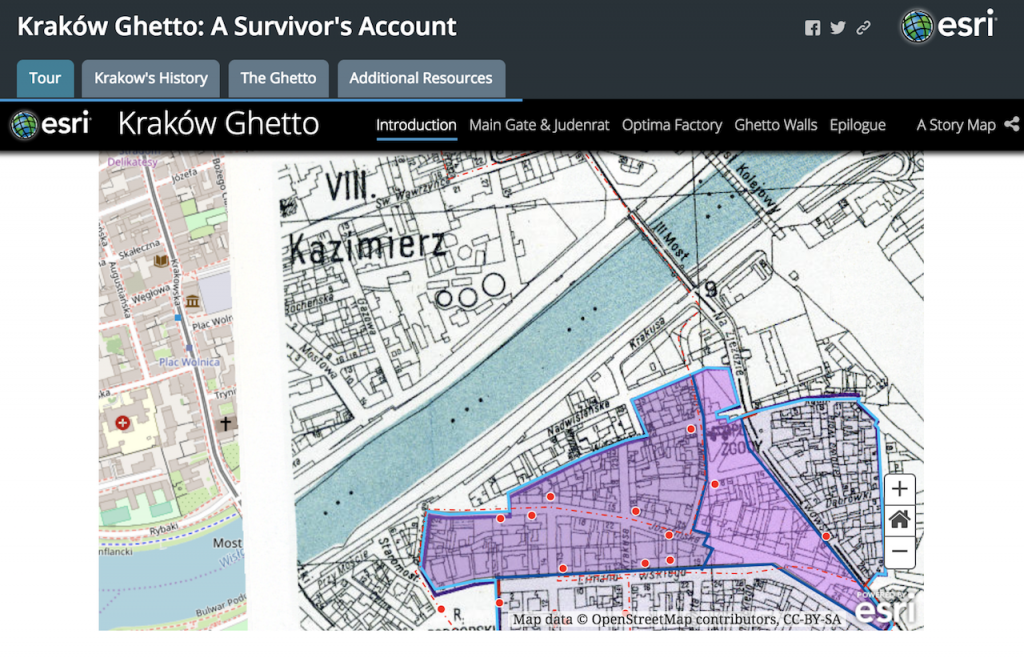 Christine Liu, a graduate student in the Department of Art, Art History & Visual Studies, created this Story Map to illustrate a journey through Kraków under Nazi occupation.