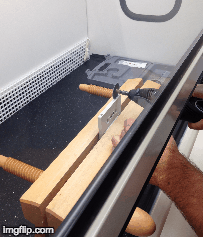
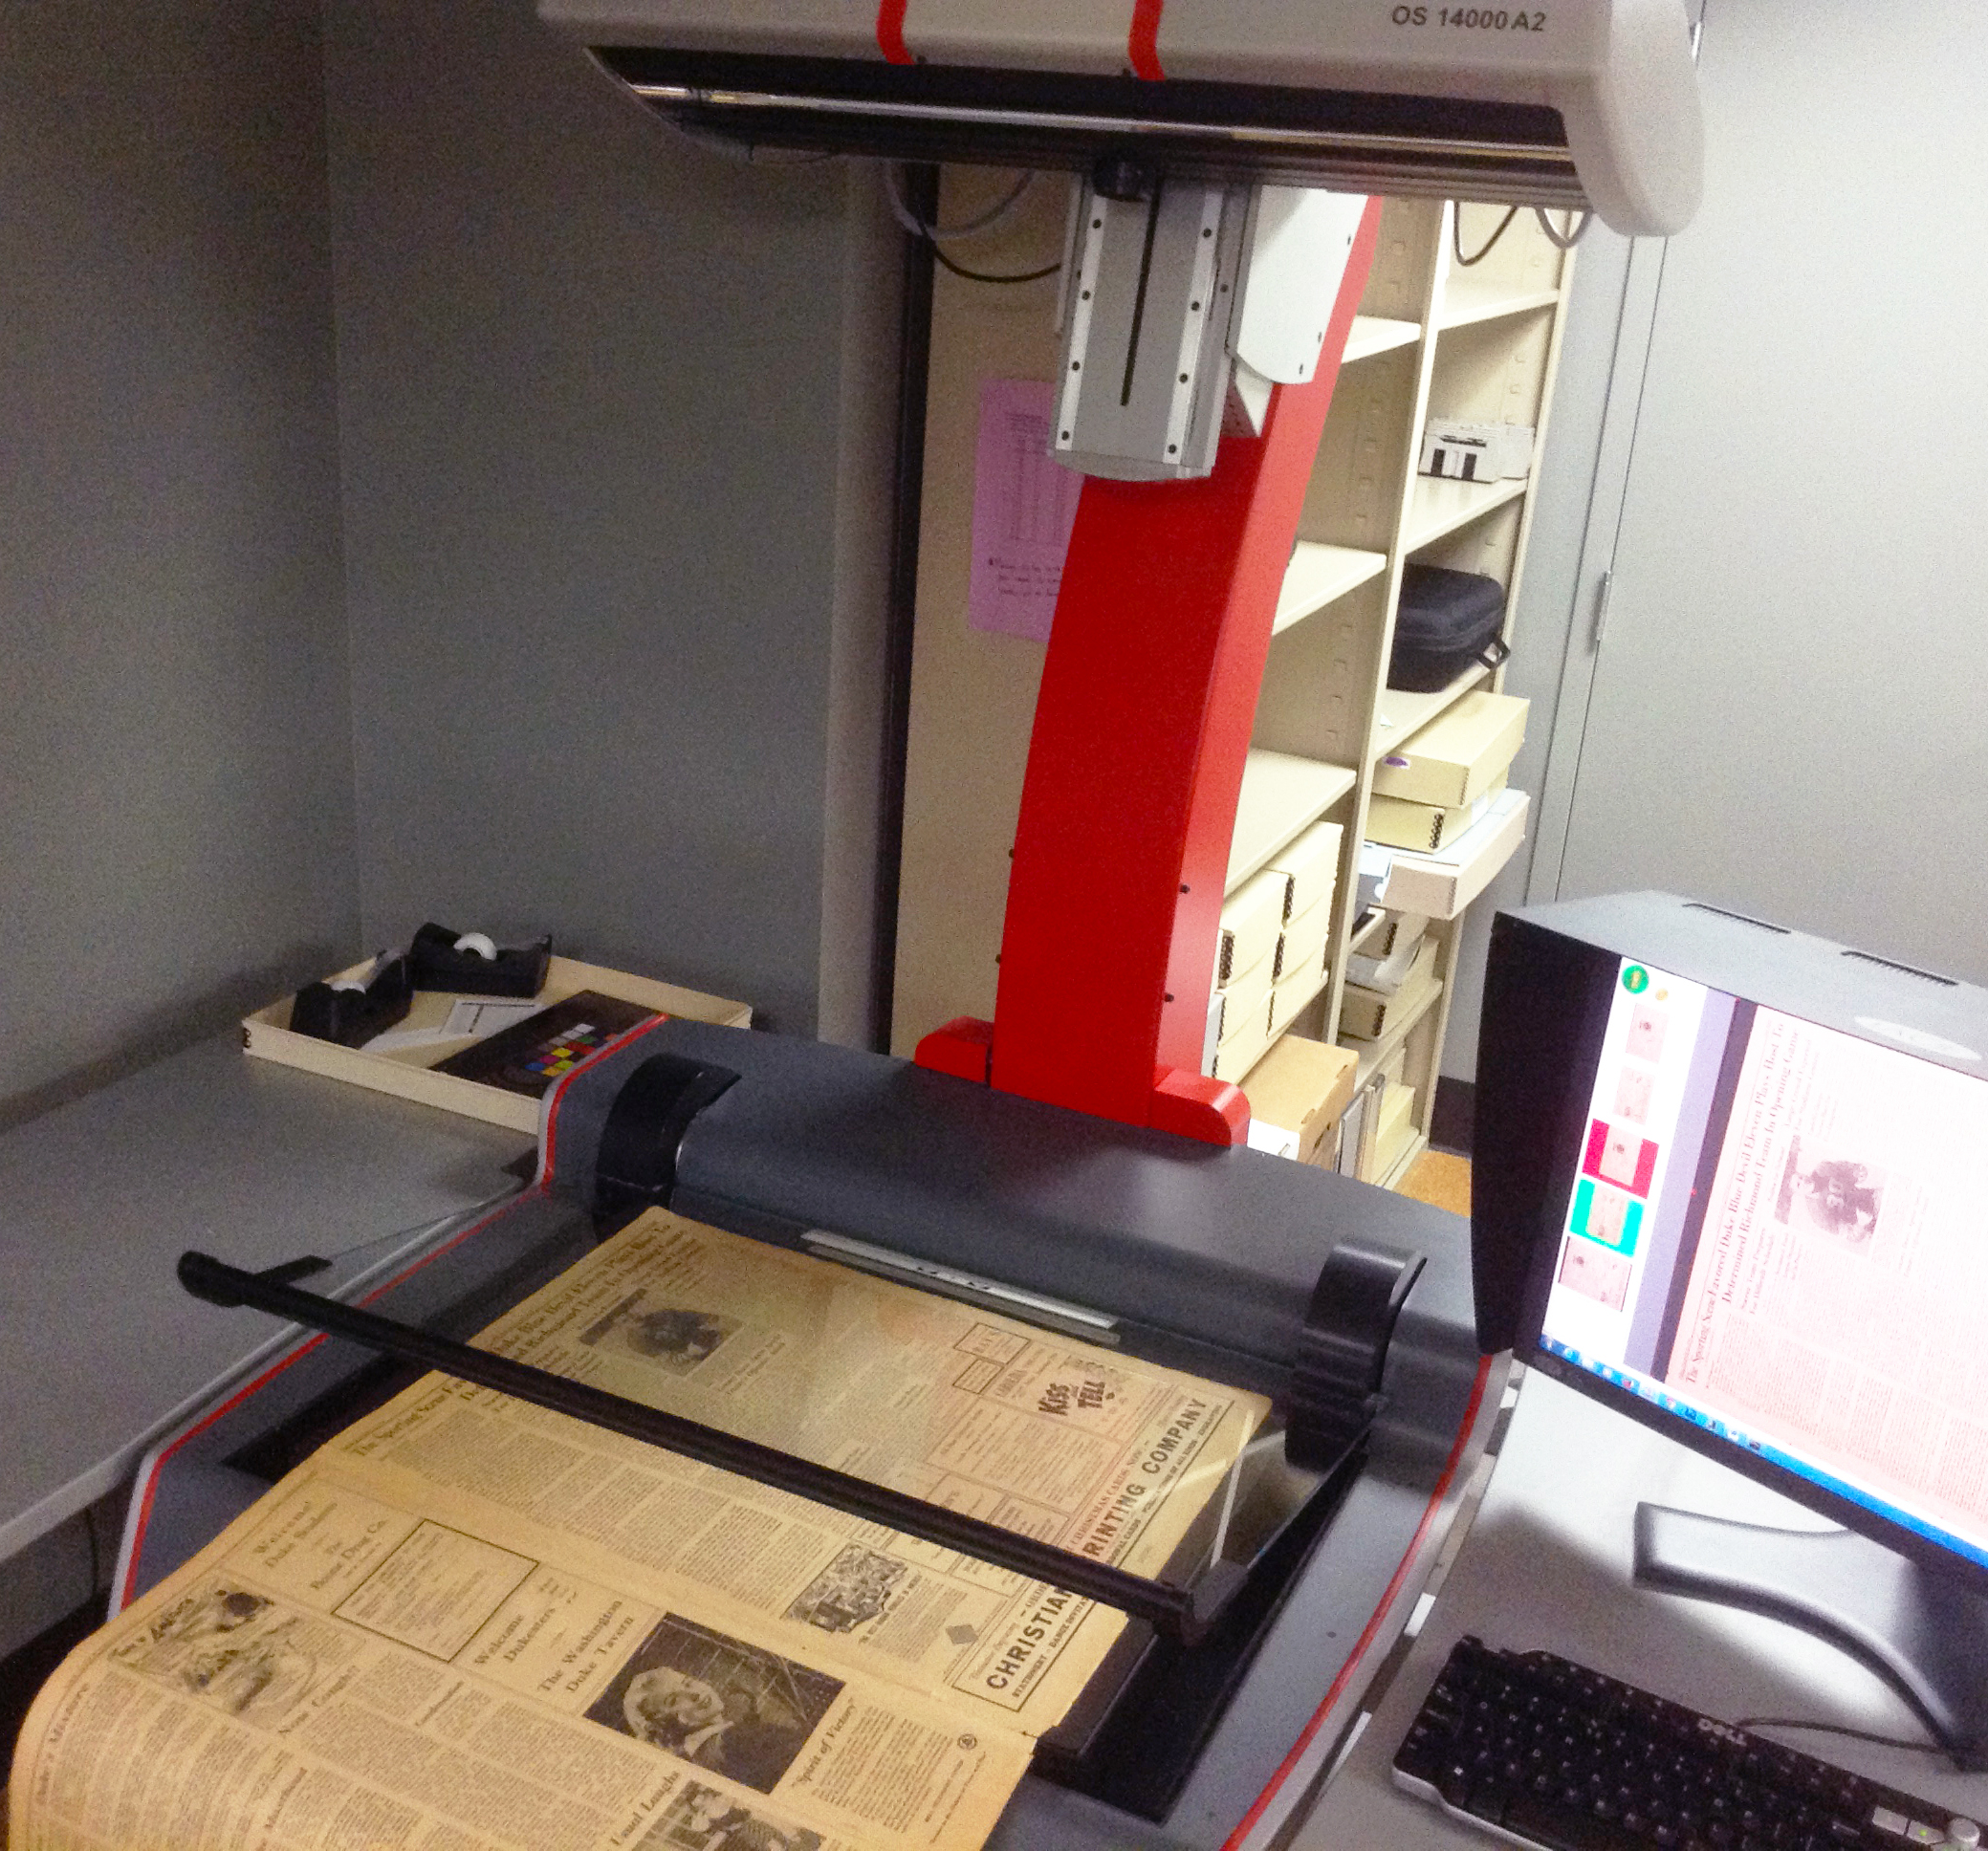
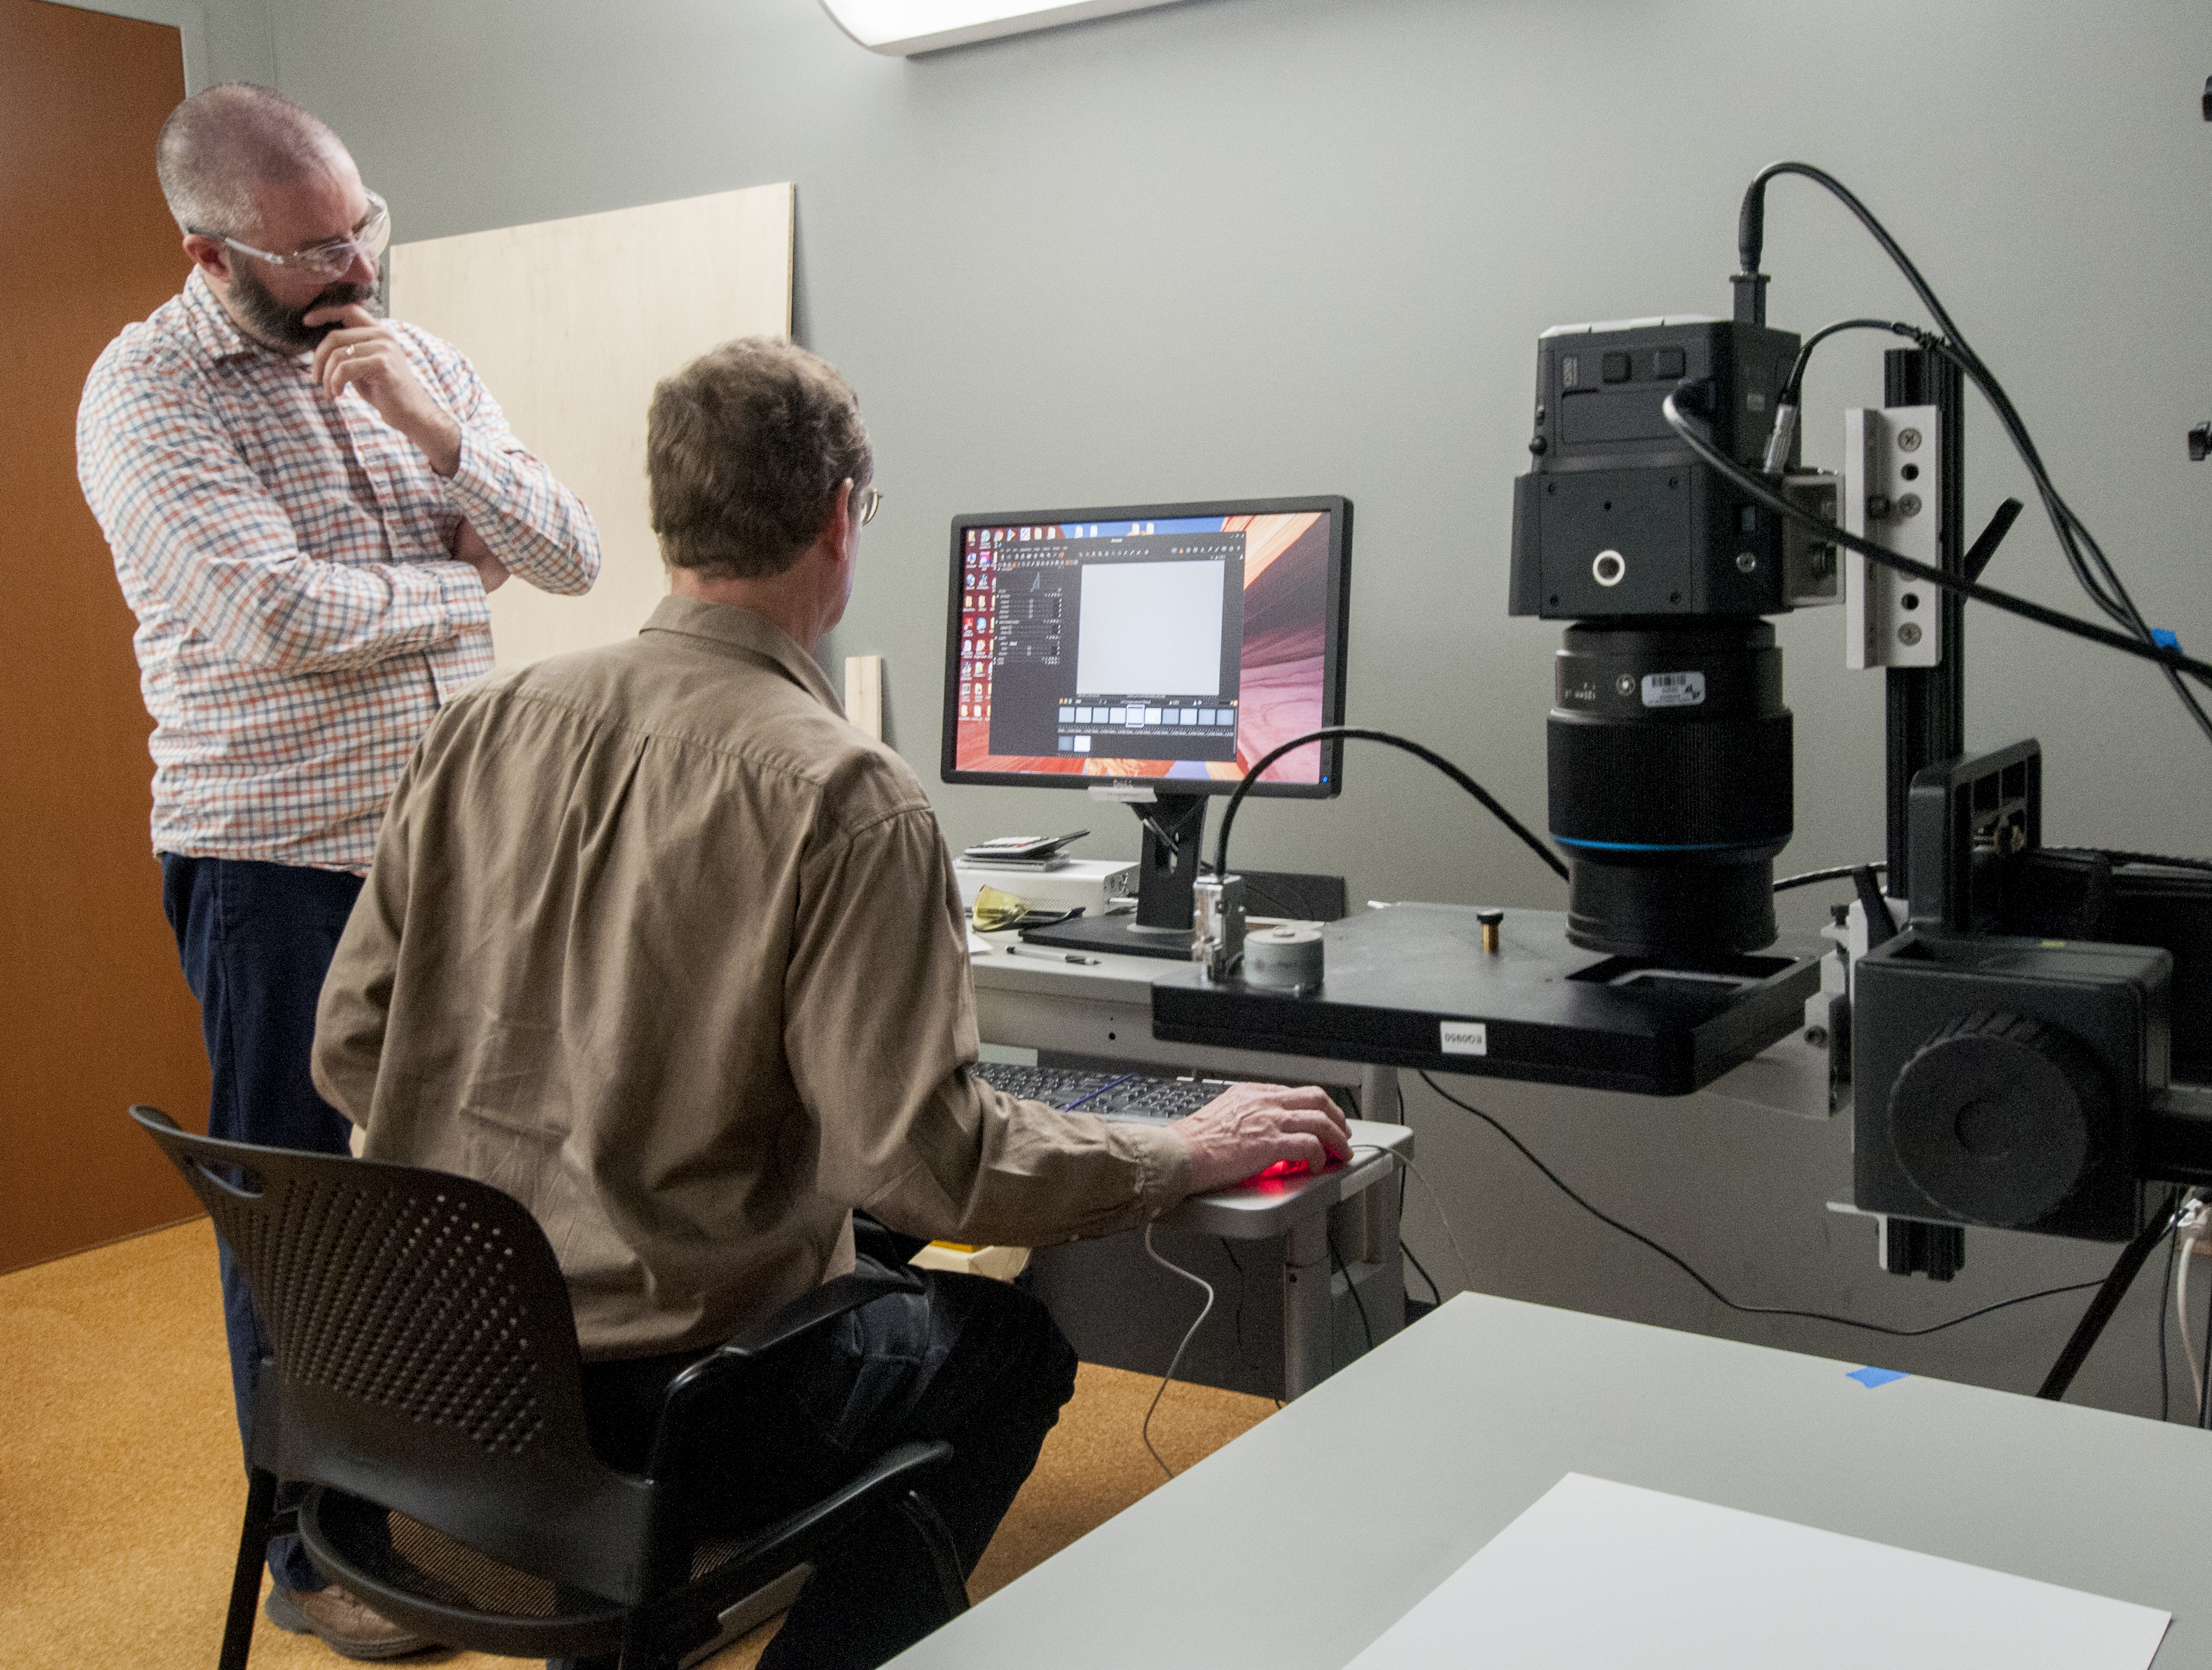
Bill Christens-Barry and Mike Adamo test the MSI system
Over the past 6 months or so the Digital Production Center has been collaborating with Duke Collaboratory for Classics Computing (DC3) and the Conservation Services Department to investigate multispectral imaging capabilities for the Library. Multispectral imaging (MSI) is a mode of image capture that uses a series of narrow band lights of specific frequencies along with a series of filters to illuminate an object. Highly tailored hardware and software are used in a controlled environment to capture artifacts with the goal of revealing information not seen by the human eye. This type of capture system in the Library would benefit many departments and researchers alike. Our primary focus for this collaboration are the needs of the Papyri community, Conservation Services along with additional capacity for the Digital Production Center.
Josh Sosin of DC3 was already in contact with Mike Toth of R. B. Toth Associates, a company that is at the leading edge of MSI for Cultural Heritage and research communities, on a joint effort between DC3, Conservation Services and the Duke Eye Center to use Optical Coherence Tomography (OCT) to hopefully reveal hidden layers of mummy masks made of papyri. The DPC has a long standing relationship with Digital Transitions, a reseller of the Phase One digital back, which happens to be the same digital back used in the Toth MSI system. And the Conservation lab was already involved in the OCT collaboration so it was only natural to invite R. B. Toth Associates to the Library to show us their MSI system.
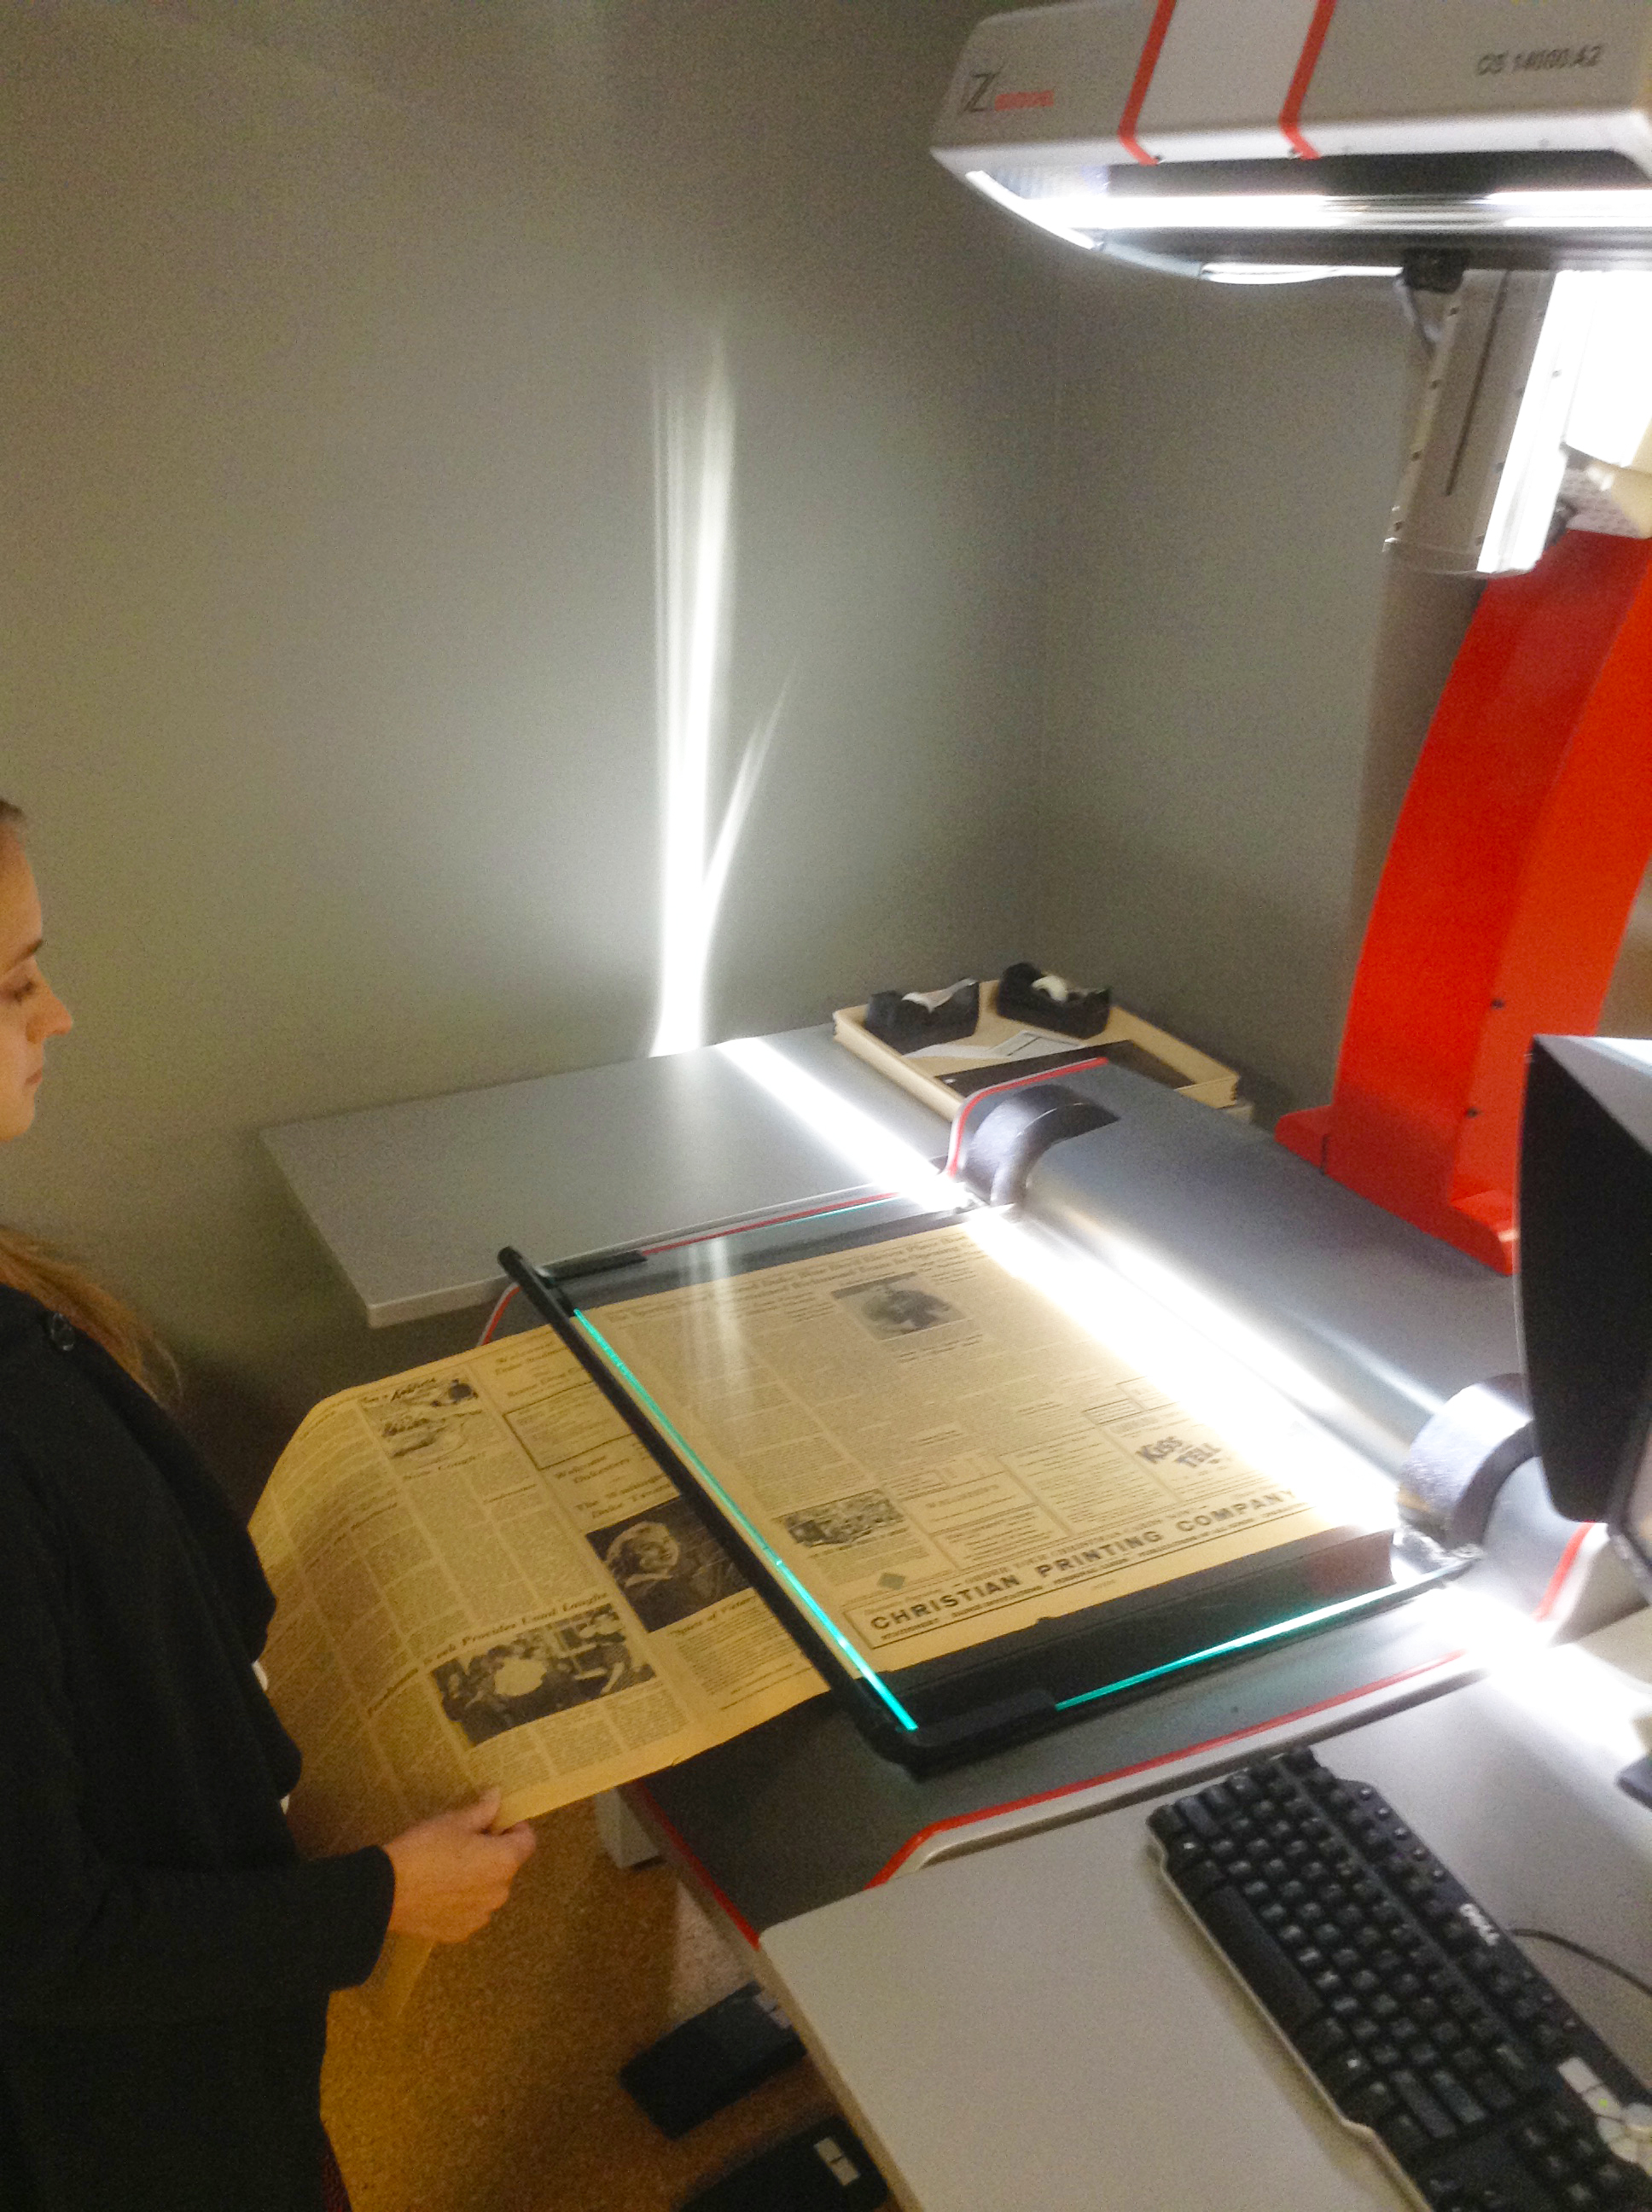
After observing the OCT work done at the Eye Center we made our way to the Library to setup the MSI system. Bill Christens-Barry of R. B. Toth Associates walked me through some very high-level physics related to MSI, we setup the system and got ready to capture selected material which included Ashkar-Gilson manuscripts, various papyri and other material that might benefit from MSI. By the time we started capturing images we had a full house. Crammed into the room were members of DC3, DPC, Conservation, Digital Transitions and Toth Associates all of whom had a stake in this collaboration. After long hours of sitting in the dark (necessary for MSI image capture) we emerged from the room blurry eyed and full of hope that something previously unseen would be revealed.
The text of this manuscript was revealed primarily with the IR narrowband light at 940 nm, which Bill enhanced.
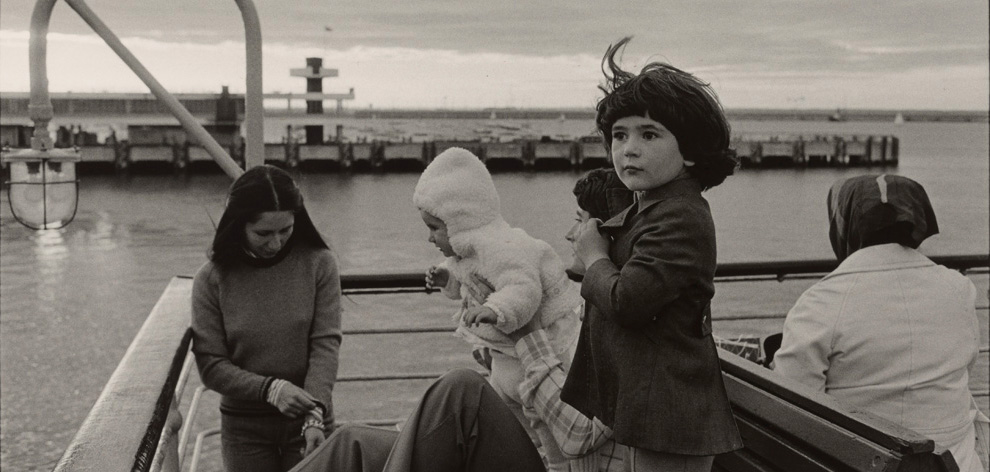
The resulting captures are as ‘stack’ or ‘block’ of monochromatic images captured using different wavelengths of light and ultraviolet and infrared filters. Using software developed by Bill Christens-Barry to process and manipulate the images will reveal information if it is there by combining, removing or enhancing images in the stack. One of the first items we processed was Ashkar-GilsonMS14 Deuteronomy 4.2-4.23 seen below. This really blew us away.
This item went from nearly unreadable to almost entirely readable! Bill assured me that he had only done minimal processing and that he should be able to uncover more of the text in the darker areas with some fine tuning. The text of this manuscript was revealed primarily through the use of the IR filter and was not necessarily the direct product of exposing the manuscript to individual bands of light but the result is no less spectacular. Because the capture process is so time consuming and time was limited no other Ashkar-Gilson manuscript was digitized at this time.
We digitized the image on the left in 2010 and ever since then, when asked, ‘What is the most exciting thing you have digitized’ I often answer, “The Ashkar-Gilson manuscripts. Manuscripts from ca. 7th to 8th Century C.E. Some of them still have fur on the back and a number of them are unreadable… but you can feel the history.” Now my admiration for these manuscripts is renewed and maybe Josh can tell me what it says.
It is our hope that we can bring this technology to Duke University so we can explore our material in greater depth and reveal information that has not been seen for a very, very long time.
Beth Doyle, Head of Conservation Services, wrote a blog post for Preservation Underground about her experience with MSI. Check it out!
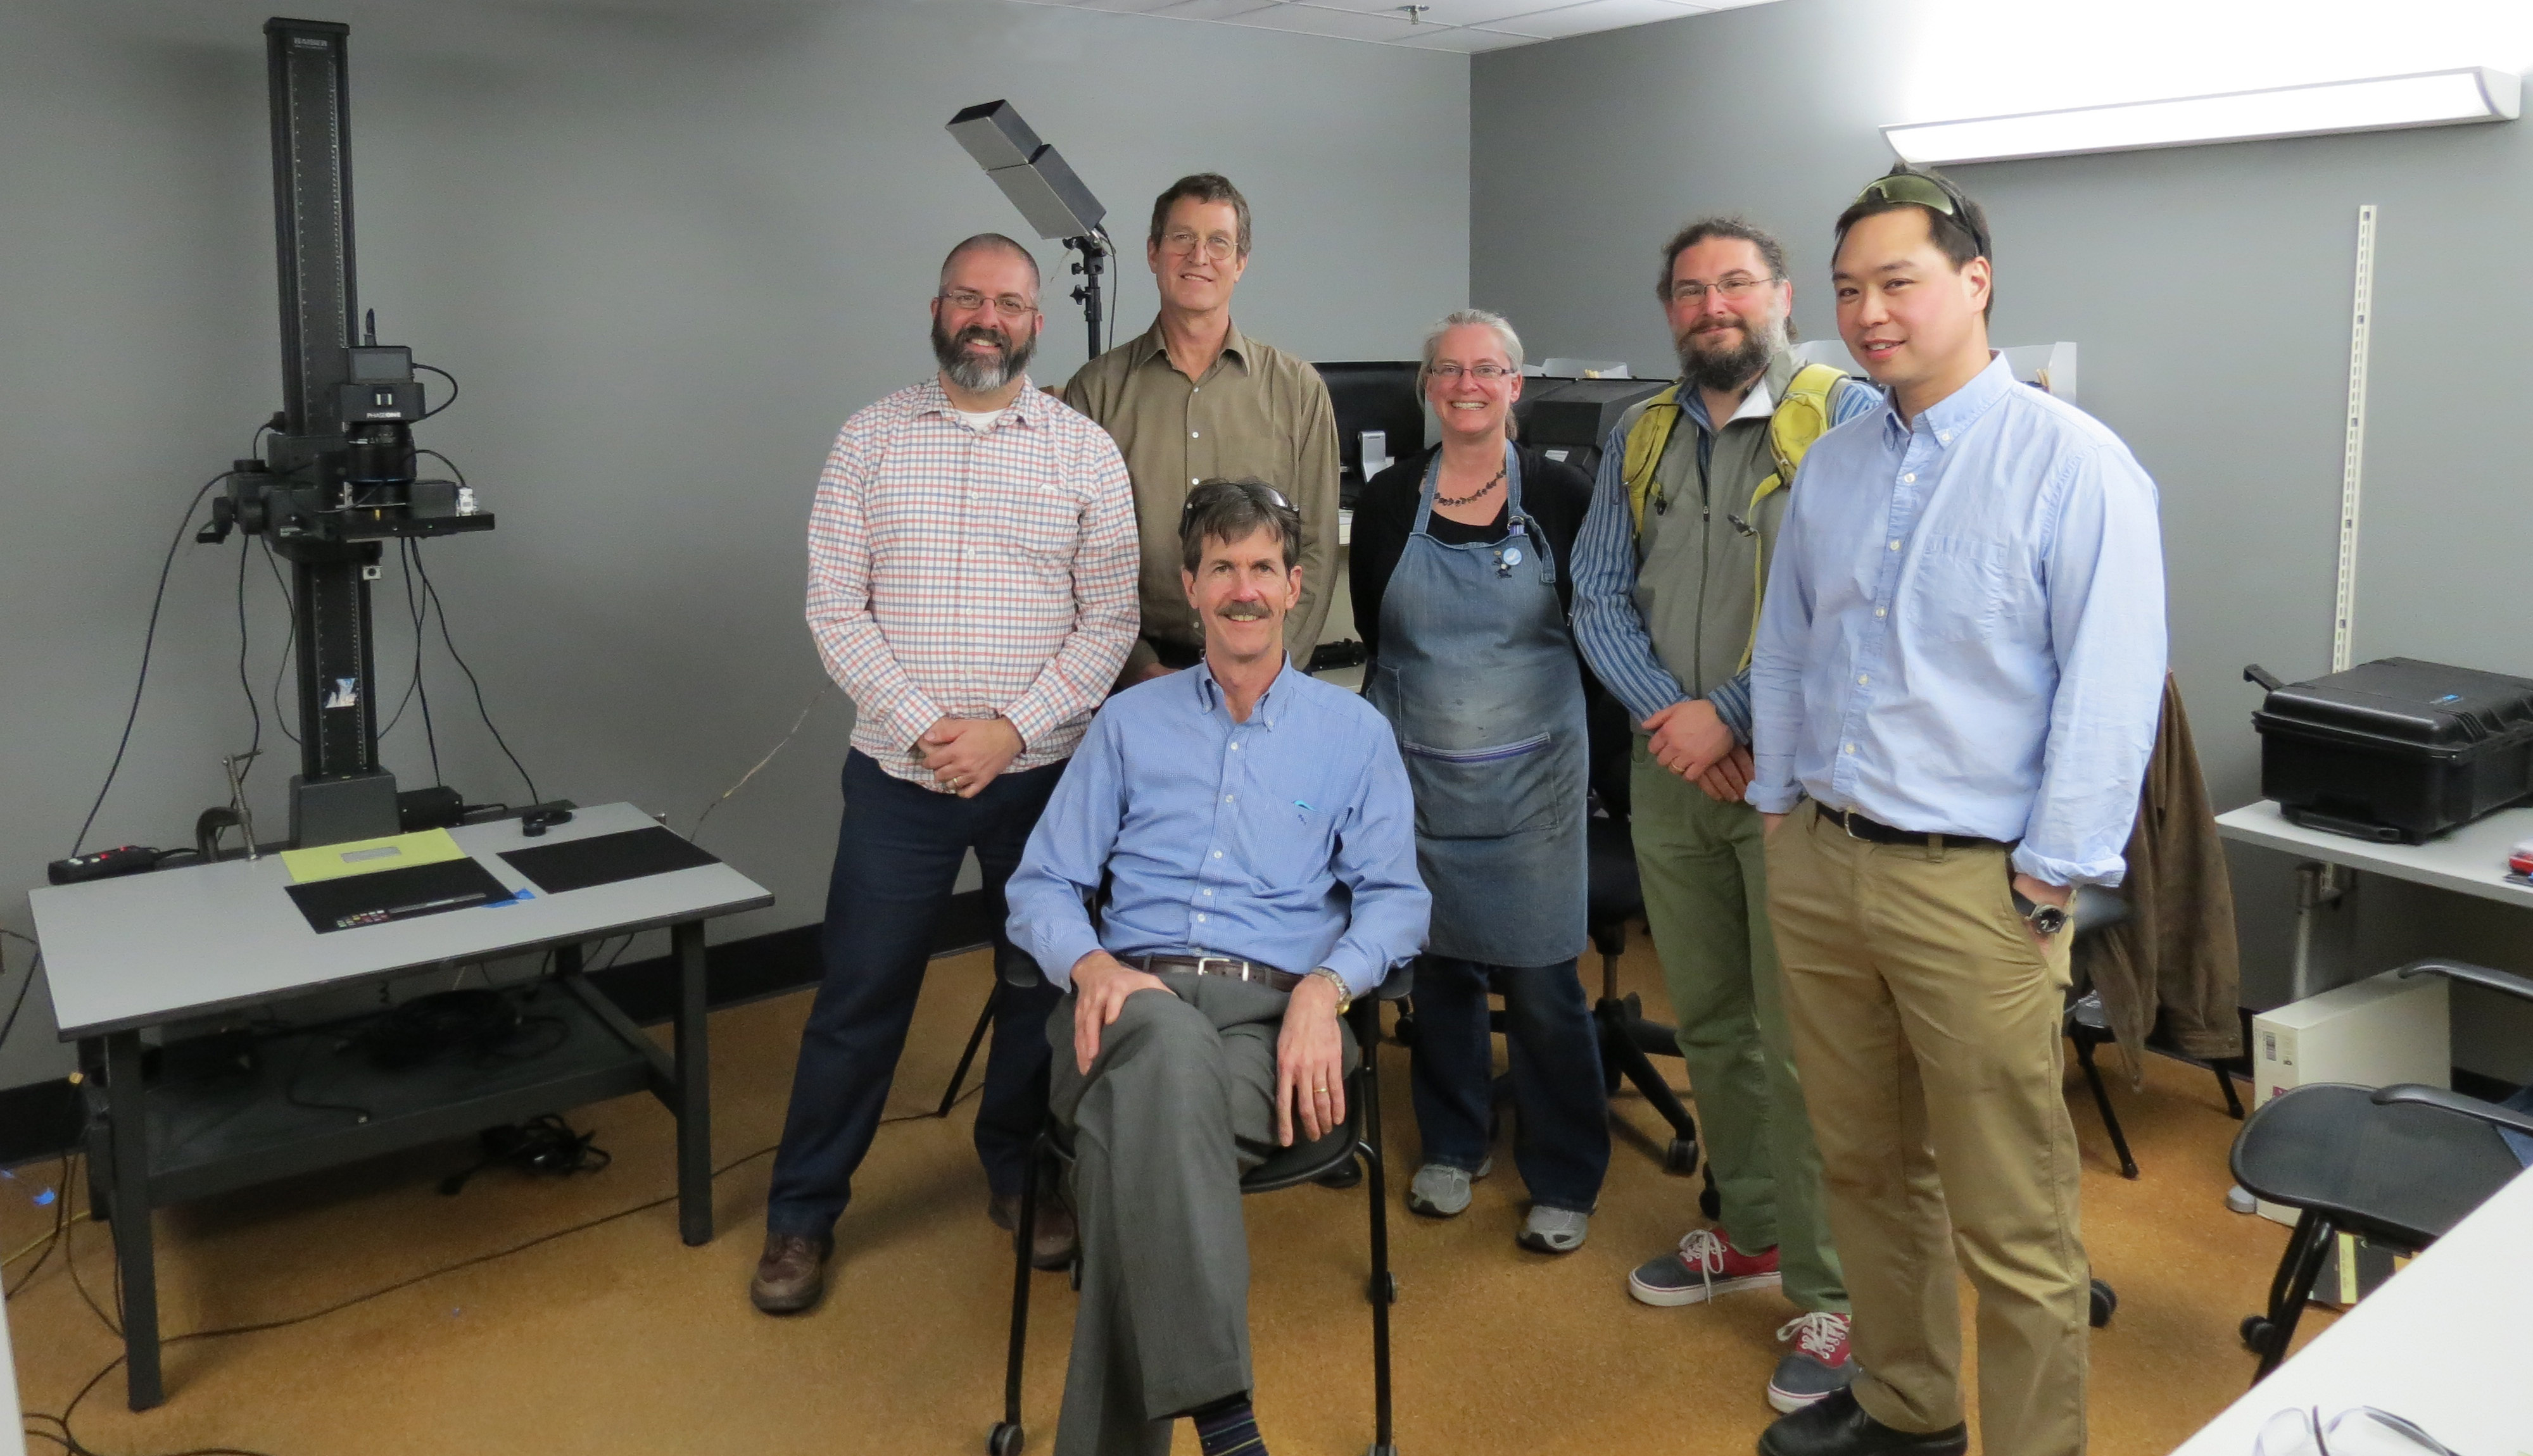
Mike Toth, Mike Adamo, Bill Christens-Barry, Beth Doyle, Josh Sosin and Michael Chan
Also, check out this article from the New & Observer.
Its that time of year when all the year end “best of” lists come out, best music, movies, books, etc. Well, we could not resist following suit this year, so… Ladies in gentlemen, I give you in – no particular order – the 2015 best of list for the Digital Projects and Production Services department (DPPS).
Metadata!
Metadata Architect
In 2015, DPPS welcomed a new staff member to our team; Maggie Dickson came on board as our metadata architect! She is already leading a team to whip our digital collections metadata into shape, and is actively consulting with the digital repository team and others around the library. Bringing metadata expertise into the DPPS portfolio ensures that collections are as discoverable, shareable, and re-purposable as possible.
An issue of the Chronicle from 1988
King Intern for Digital Collections
DPPS started the year with two large University Archives projects on our plates: the ongoing Duke University Chronicle digitization and a grant to digitize hundreds of Chapel recordings. Thankfully, University Archives allocated funding for us to hire an intern, and what a fabulous intern we found in Jessica Serrao (the proof is in her wonderful blogposts). The internship has been an unqualified success, and we hope to be able to repeat such a collaboration with other units around the library.
Tripod 3
Our digital project developers have spent much of the year developing the new Tripod3 interface for the Duke Digital Repository. This process has been an excellent opportunity for cross departmental collaborative application development and implementing Agile methodology with sprints, scrums, and stand up meetings galore! We launched our first collection not the new platform in October and we will have a second one out the door before the end of this year. We plan on building on this success in 2016 as we migrate existing collections over to Tripod3.
Repository ingest planning
Speaking of Tripod3 and the Duke Digital Repository, we have ingesting digital collections into the Duke Digital Repository since 2014. However, we have a plan to kick ingests up a notch (or 5). Although the real work will happen in 2016, the planning has been a long time coming and we are all very excited to be at this phase of the Tripod3 / repository process (even if it will be a lot of work). Stay tuned!
Digital Collections Promotional Card
This is admittedly a small achievement, but it is one that has been on my to-do list for 2 years so it actually feels like a pretty big deal. In 2015, we designed a 5 x 7 postcard to hand out during Digital Production Center (DPC) tours, at conferences, and to any visitors to the library. Also, I just really love to see my UNC fan colleagues cringe every time they turn the card over and see Coach K’s face. Its really the little things that make our work fun.
New Exhibits Website
In anticipation of opening of new exhibit spaces in the renovated Rubenstein library, DPPS collaborated with the exhibits coordinator to create a brand new library exhibits webpage. This is your one stop shop for all library exhibits information in all its well-designed glory.
Aggressive cassette rehousing procedures
Audio and Video Preservation
In 2014, the Digital production Center bolstered workflows for preservation based digitization. Unlike our digital collections projects, these preservation digitization efforts do not have a publication outcome so they often go unnoticed. Over the past year, we have quietly digitized around 400 audio cassettes in house (this doesn’t count outsourced Chapel Recordings digitization), some of which need to be dramatically re-housed.
On the video side, efforts have been sidelined by digital preservation storage costs. However some behind the scenes planning is in the works, which means we should be able to do more next year. Also, we were able to purchase a Umatic tape cleaner this year, which while it doesn’t sound very glamorous to the rest of the world, thrills us to no end.
Revisiting the William Gedney Digital Collection
Fans of Duke Digital Collections are familiar with the current Gedney Digital Collection. Both the physical and digital collection have long needed an update. So in recent years, the physical collection has been reprocessed, and this Fall we started an effort to digitized more materials in the collection and to higher standards than were practical in the late 1990s.
DPC’s new work room
Expanding DPC
When the Rubenstein Library re-opened, our neighbor moved into the new building, and the DPC got to expand into his office! The extra breathing room means more space for our specialists and our equipment, which is not only more comfortable but also better for our digitization practices. The two spaces are separate for now, but we are hoping to be able to combine them in the next year or two.
2015 was a great year in DPPS, and there are many more accomplishments we could add to this list. One of our team mottos is: “great productivity and collaboration, business as usual”. We look forward to more of the same in 2016!
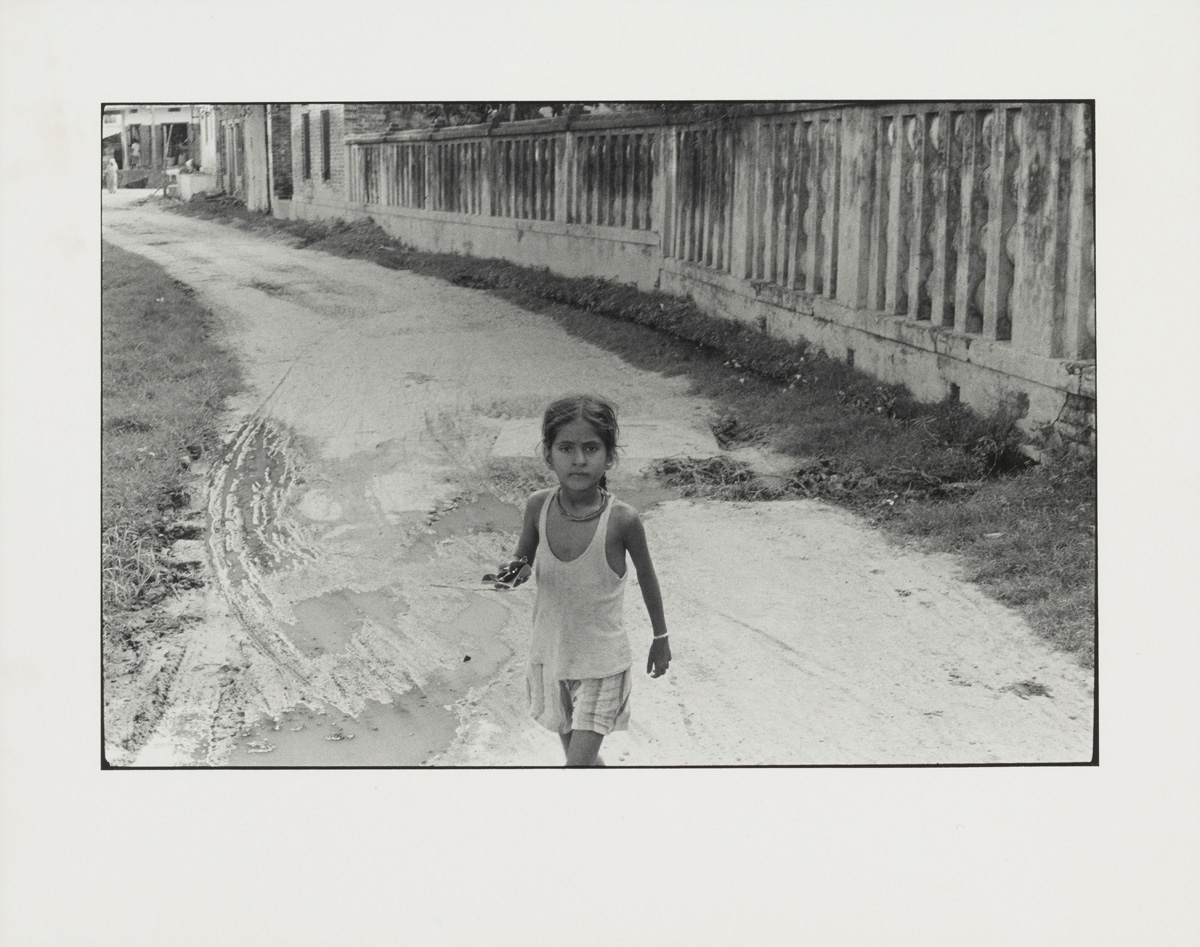
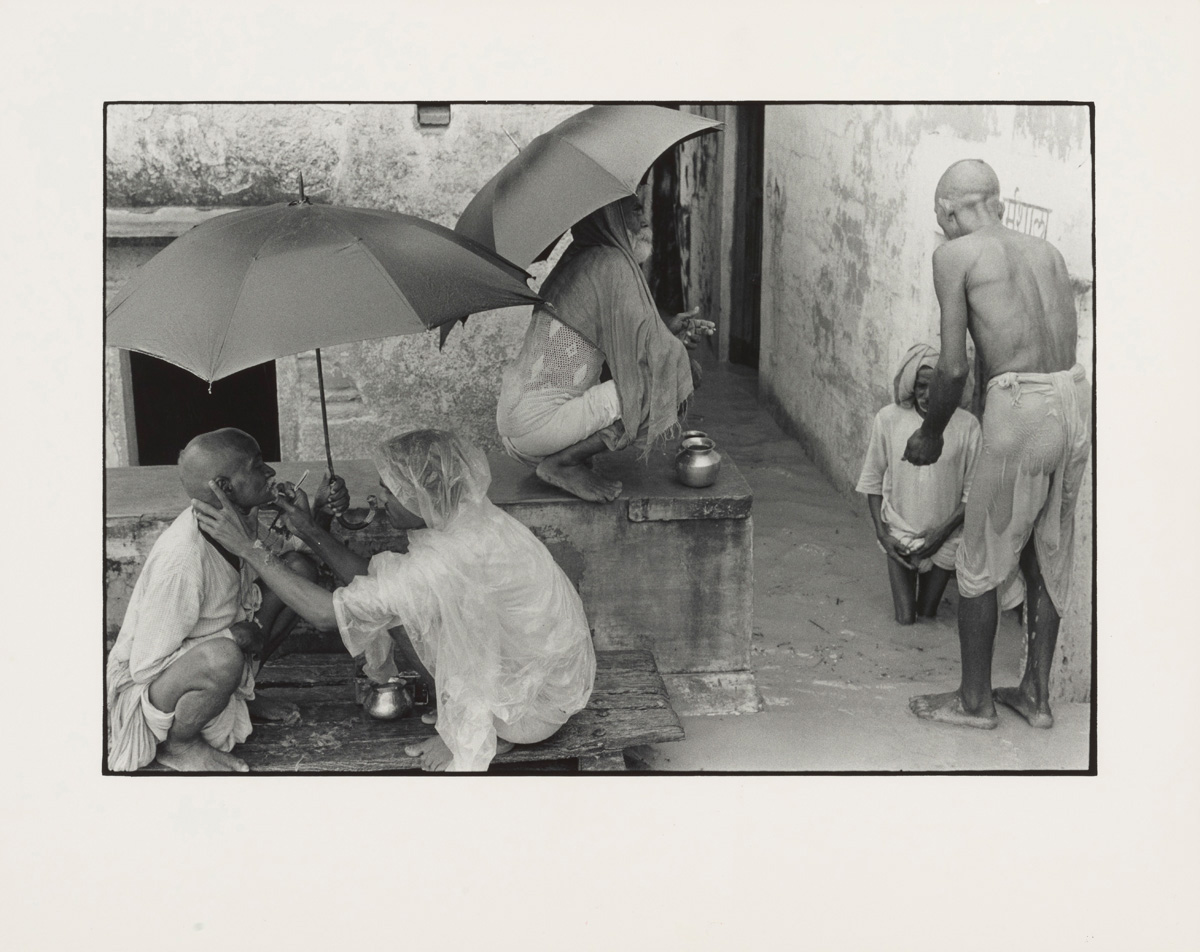
The initial thought I had for this blog post was to describe a slice of my day that revolved around the work of William Gedney. I was going to spin a tale about being on the hunt for a light meter to take lux (luminance) readings used to help calibrate the capture environment of one of our scanners. On my search for the light meter I bumped into the new exhibit of William Gedney’s handmade books displayed in the Chappell Family Gallery in the Perkins Library. I had digitized a number of these books a few months ago and enjoyed pretty much every image in the books. One of the books on display was opened to a particular photograph. To my surprise, I had just digitized a finished print of the same image that very morning while working on a larger project to digitize all of Gedney’s finished prints, proof prints, contact sheets and other material. Once the project is complete (a year or so from now) I will have personally seen, handled and digitized over 20,000 of Gedney’s photographs. Whoa! Would I be able to recognize Gedney images whenever one presented itself just like the book in the gallery? Maybe.
Once the collection is digitized and published through Duke Digital Collections the whole world will be able to see this amazing body of work. Instead of boring you with the details of that story I thought I would just leave you with a few images from the collection. For me, many of Gedney’s photographs have a kinetic energy to them. It seems as if I can almost feel the air. My imagination may be working overtime to achieve this and the reality of what was happening when the photograph was taken may be wholly different but the fact is these photographs spin up my imagination and transport me to the moments he has captured. These photographs inspire me to dust off my enlarger and set up a darkroom.
It may take some time to complete this particular project but there are other William Gedney related projects, materials and events available at Duke.
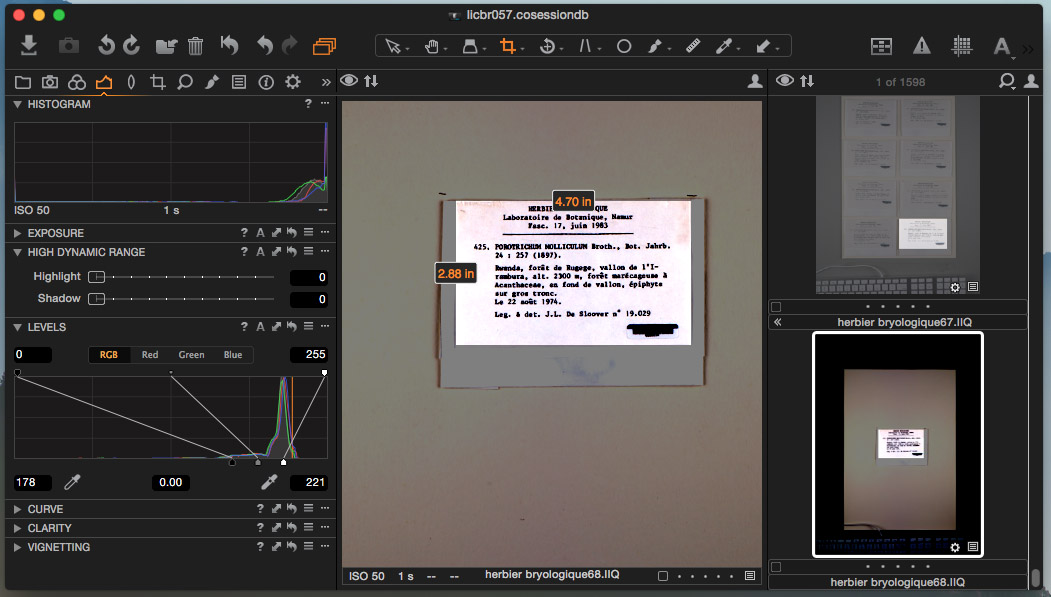
As 2015 winds down, the Digital Production Center is wrapping up a four-year collaboration with the Duke Herbarium to digitize their lichen and bryophyte specimens. The project is funded by the National Science Foundation, and the ultimate goal is to digitize over 2 million specimens from more than 60 collections across the nation. Lichens and bryophytes (mosses and their relatives) are important indicators of climate change. After the images from the participating institutions are uploaded to one central portal, called iDigBio, large-scale distribution mapping will be used to identify regions where environmental changes are taking place, allowing scientists to study the patterns and effects of these changes.
The specimens are first transported from the Duke Herbarium to Perkins Library on a scheduled timeline. Then, we photograph the specimen labels using our Phase One overhead camera. Some of the specimens are very bulky, but our camera’s depth of field is broad enough to keep them in focus. To be clear, what the project is utilizing is not photos of the actual plant specimens themselves, but rather images of the typed and hand-written scientific metadata adorning the envelopes which house the specimens. After we photograph them, the images are uploaded to the national database, where they are available for online research, along with other specimen labels uploaded from universities across the United States. Optical character recognition is used to digest and organize the scientific metadata in the images.
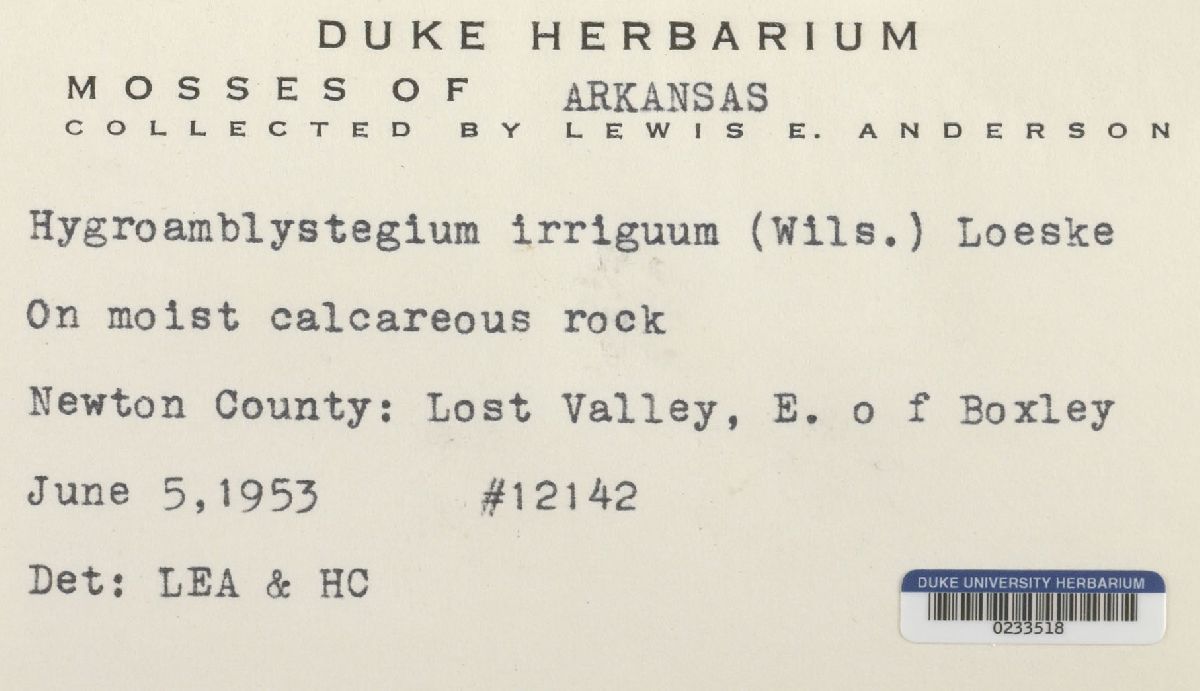
Over the past four years, the Digital Production Center has digitized approximately 100,000 lichen and bryophyte specimens. Many are from the Duke Herbarium, but some other institutions have also asked us to digitize some of their specimens, such as UNC-Chapel Hill, SUNY-Binghamton, Towson University and the University of Richmond. The Duke Herbarium is the second-largest herbarium of all U.S. private universities, next to Harvard. It was started in 1921, and it contains more than 800,000 specimens of vascular plants, bryophytes, algae, lichens, and fungi, some of which were collected as far back as the 1800s. Several specimens have unintentionally humorous names, like the following, which wants to be funky, but isn’t fooling anyone. Ok, maybe only I find that funny.
The project has been extensive, but enjoyable, thanks to the leadership of Duke Herbarium Data Manager Blanka Shaw. Dr. Shaw has personally collected bryophytes on many continents, and has brought a wealth of knowledge, energy and good humor to the collaboration with the Digital Production Center. The Duke Herbarium is open for visitors, and citizen scientists are also needed to volunteer for transcription and georeferencing of the extensive metadata collected in the national database.
We experience a number of different cycles in the Digital Projects and Production Services Department (DPPS). There is of course the project lifecycle, that mysterious abstraction by which we try to find commonalities in work processes that can seem unique for every case. We follow the academic calendar, learn our fate through the annual budget cycle, and attend weekly, monthly, and quarterly meetings.
The annual reporting cycle at Duke University Libraries usually falls to departments in August, with those reports informing a master library report completed later. Because of the activities and commitments around the opening of the Rubenstein Library, the departments were let off the hook for their individual reports this year. Nevertheless, I thought I would use my turn in the Bitstreams rotation to review some highlights from our 2014-15 cycle.
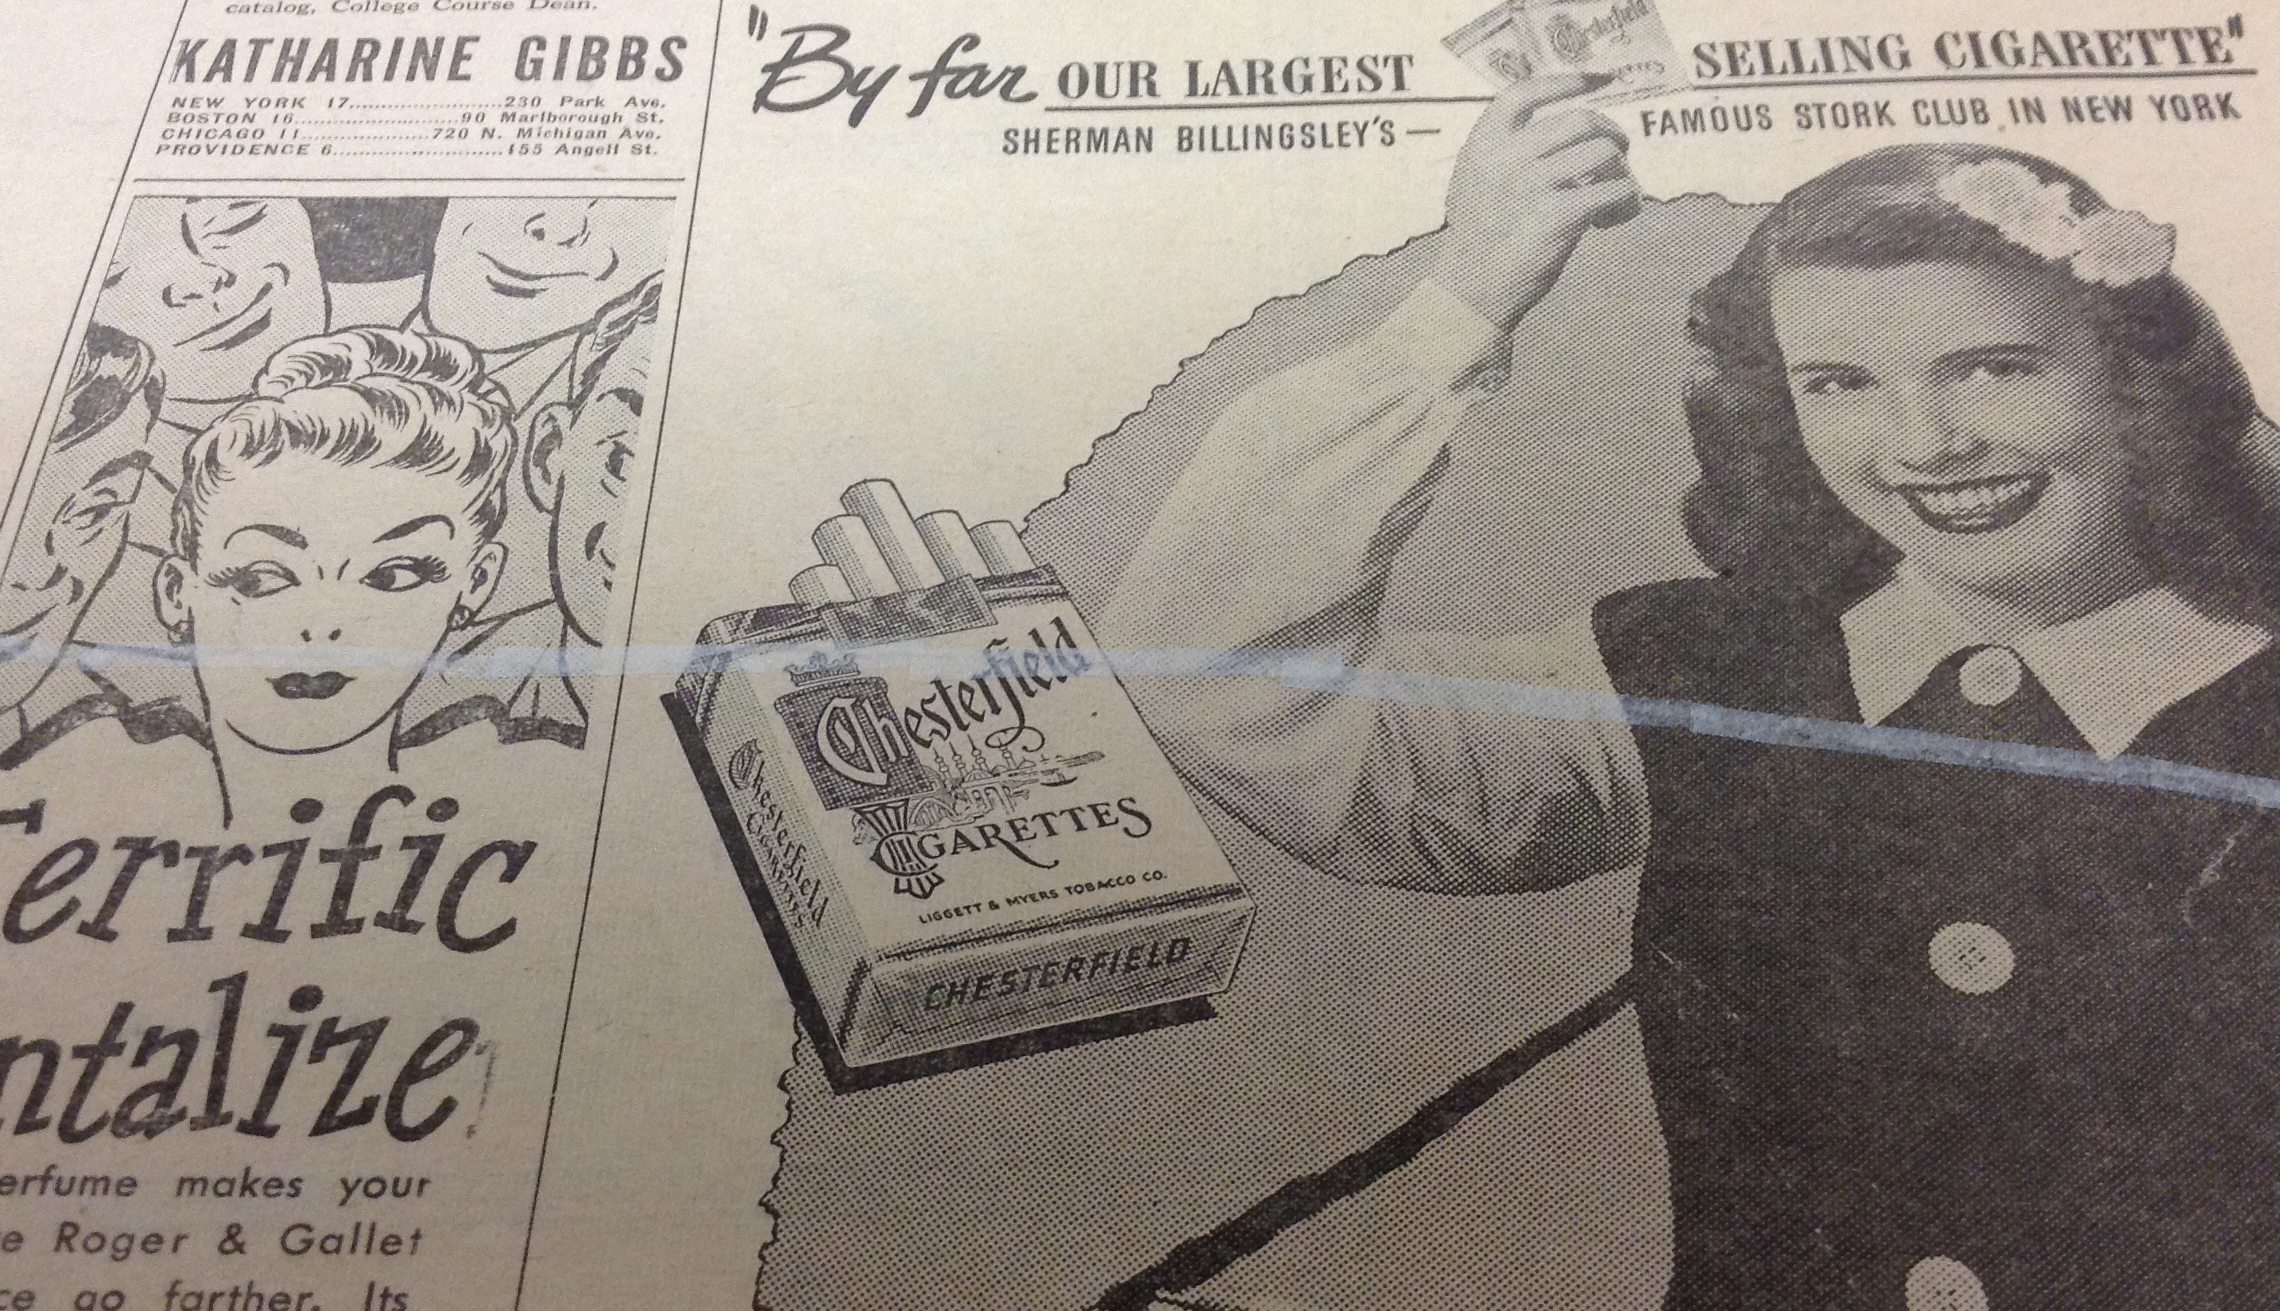
Today we will take a detailed look at how the Duke Chronicle, the university’s beloved newspaper for over 100 years, is digitized. Since our scope of digitization spans nine decades (1905-1989), it is an ongoing project the Digital Production Center (DPC), part of Digital Projects and Production Services (DPPS) and Duke University Libraries’ Digital Collections Program, has been chipping away at. Scanning and digitizing may seem straightforward to many – place an item on a scanner and press scan, for goodness sake! – but we at the DPC want to shed light on our own processes to give you a sense of what we do behind the scenes. It seems like an easy-peasy process of scanning and uploading images online, but there is much more that goes into it than that. Digitizing a large collection of newspapers is not always a fun-filled endeavor, and the physical act of scanning thousands of news pages is done by many dedicated (and patient!) student workers, staff members, and me, the King Intern for Digital Collections.
Pre-Scanning Procedures
Large format 1940s Chronicles in over-sized archival box
Many steps in the digitization process do not actually occur in the DPC, but among other teams or departments within the library. Though I focus mainly on the DPC’s responsibilities, I will briefly explain the steps others perform in this digital projects tango…or maybe it’s a waltz?
Each proposed project must first be approved by the Advisory Council for Digital Collections (ACDC), a team that reviews each project for its strategic value. Then it is passed on to the Digital Collections Implementation Team (DCIT) to perform a feasibility study that examines the project’s strengths and weaknesses (see Thomas Crichlow’s post for an overview of these teams). The DCIT then helps guide the project to fruition. After clearing these hoops back in 2013, the Duke Chronicle project started its journey toward digital glory.
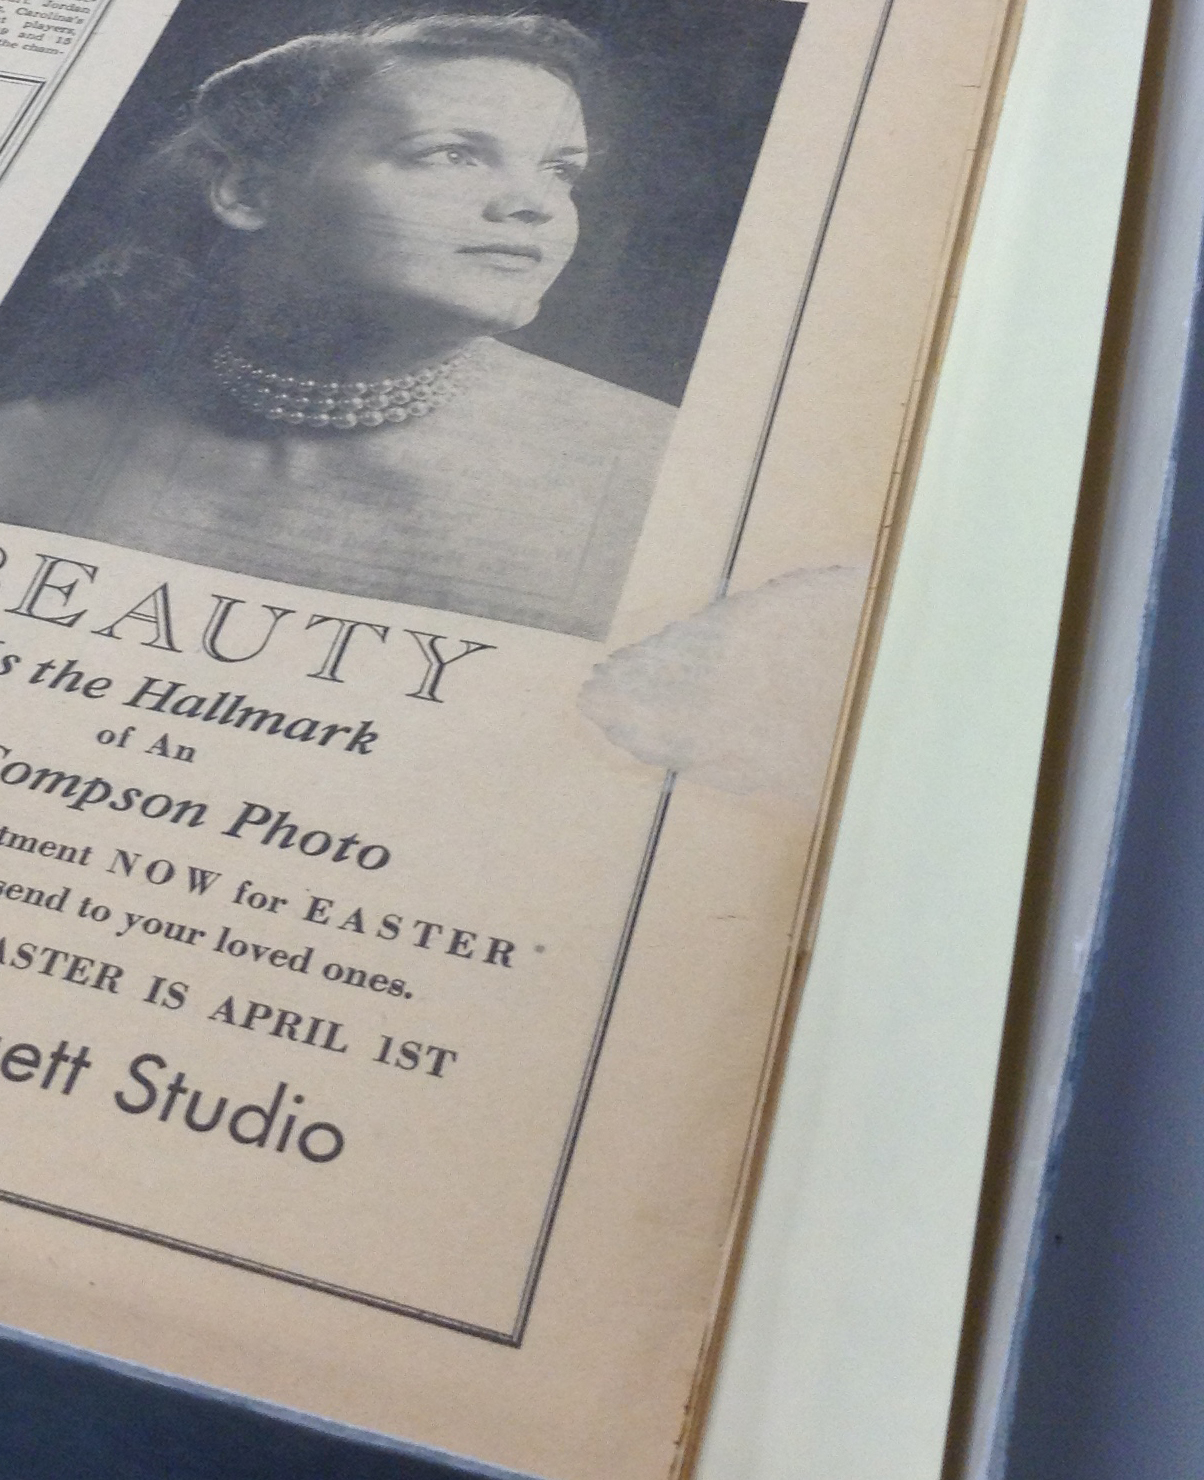
We pull 10 years’ worth of newspapers at a time from the University Archives in Rubenstein Library. Only one decade at a time is processed to make the 80+ years of Chronicle publications more manageable. The first stop is Conservation. To make sure the materials are stable enough to withstand digitizing, Conservation must inspect the condition of the paper prior to giving the DPC the go-ahead. Because newspapers since the mid-19th century were printed on cheap and very acidic wood pulp paper, the pages can become brittle over time and may warrant extensive repairs. Senior Conservator, Erin Hammeke, has done great work mending tears and brittle edges of many Chronicle pages since the start of this project. As we embark on digitizing the older decades, from the 1940s and earlier, Erin’s expertise will be indispensable. We rely on her not only to repair brittle pages but to guide the DPC’s strategy when deciding the best and safest way to digitize such fragile materials. Also, several volumes of the Chronicle have been bound, and to gain the best digital image scan these must be removed from their binding. Erin to the rescue!
Conservation repair on a 1940s Chronicle pageConservation repair to a torn 1940s Chronicle ad
1950s Duke Chronicle digitization guide
Now that Conservation has assessed the condition and given the DPC the green light, preliminary prep work must still be done before the scanner comes into play. A digitization guide is created in Microsoft Excel to list each Chronicle issue along with its descriptive metadata (more information about this process can be found in my metadata blog post). This spreadsheet acts as a guide in the digitization process (hence its name, digitization guide!) to keep track of each analog newspaper issue and, once scanned, its corresponding digital image. In this process, each Chronicle issue is inspected to collect the necessary metadata. At this time, a unique identifier is assigned to every issue based on the DPC’s naming conventions. This identifier stays with each item for the duration of its digital life and allows for easy identification of one among thousands of Chronicle issues. At the completion of the digitization guide, the Chronicle is now ready for the scanner.
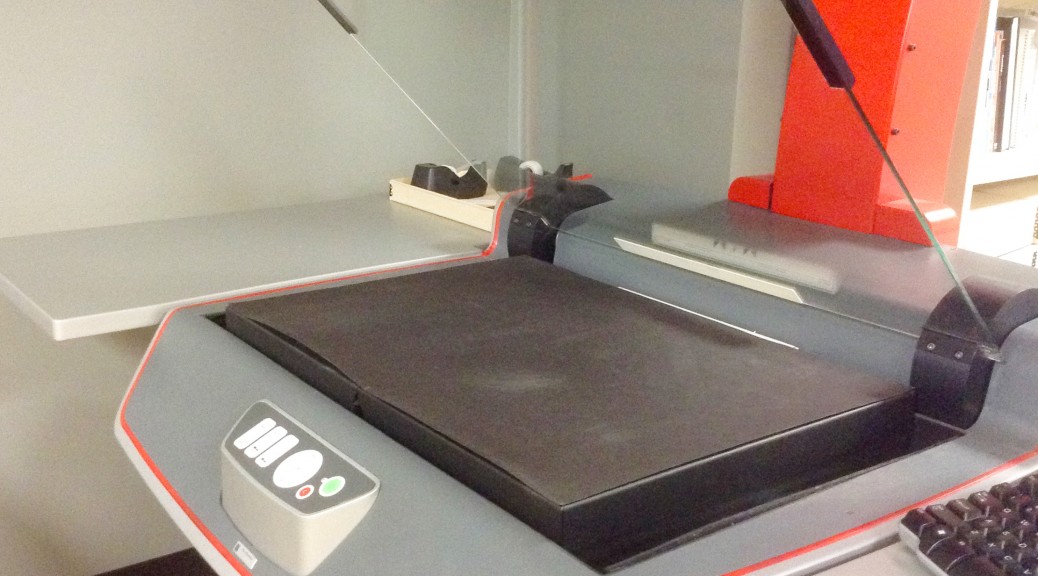
The DPC’s Zeutschel OS 14000 A2
The Scanning Process
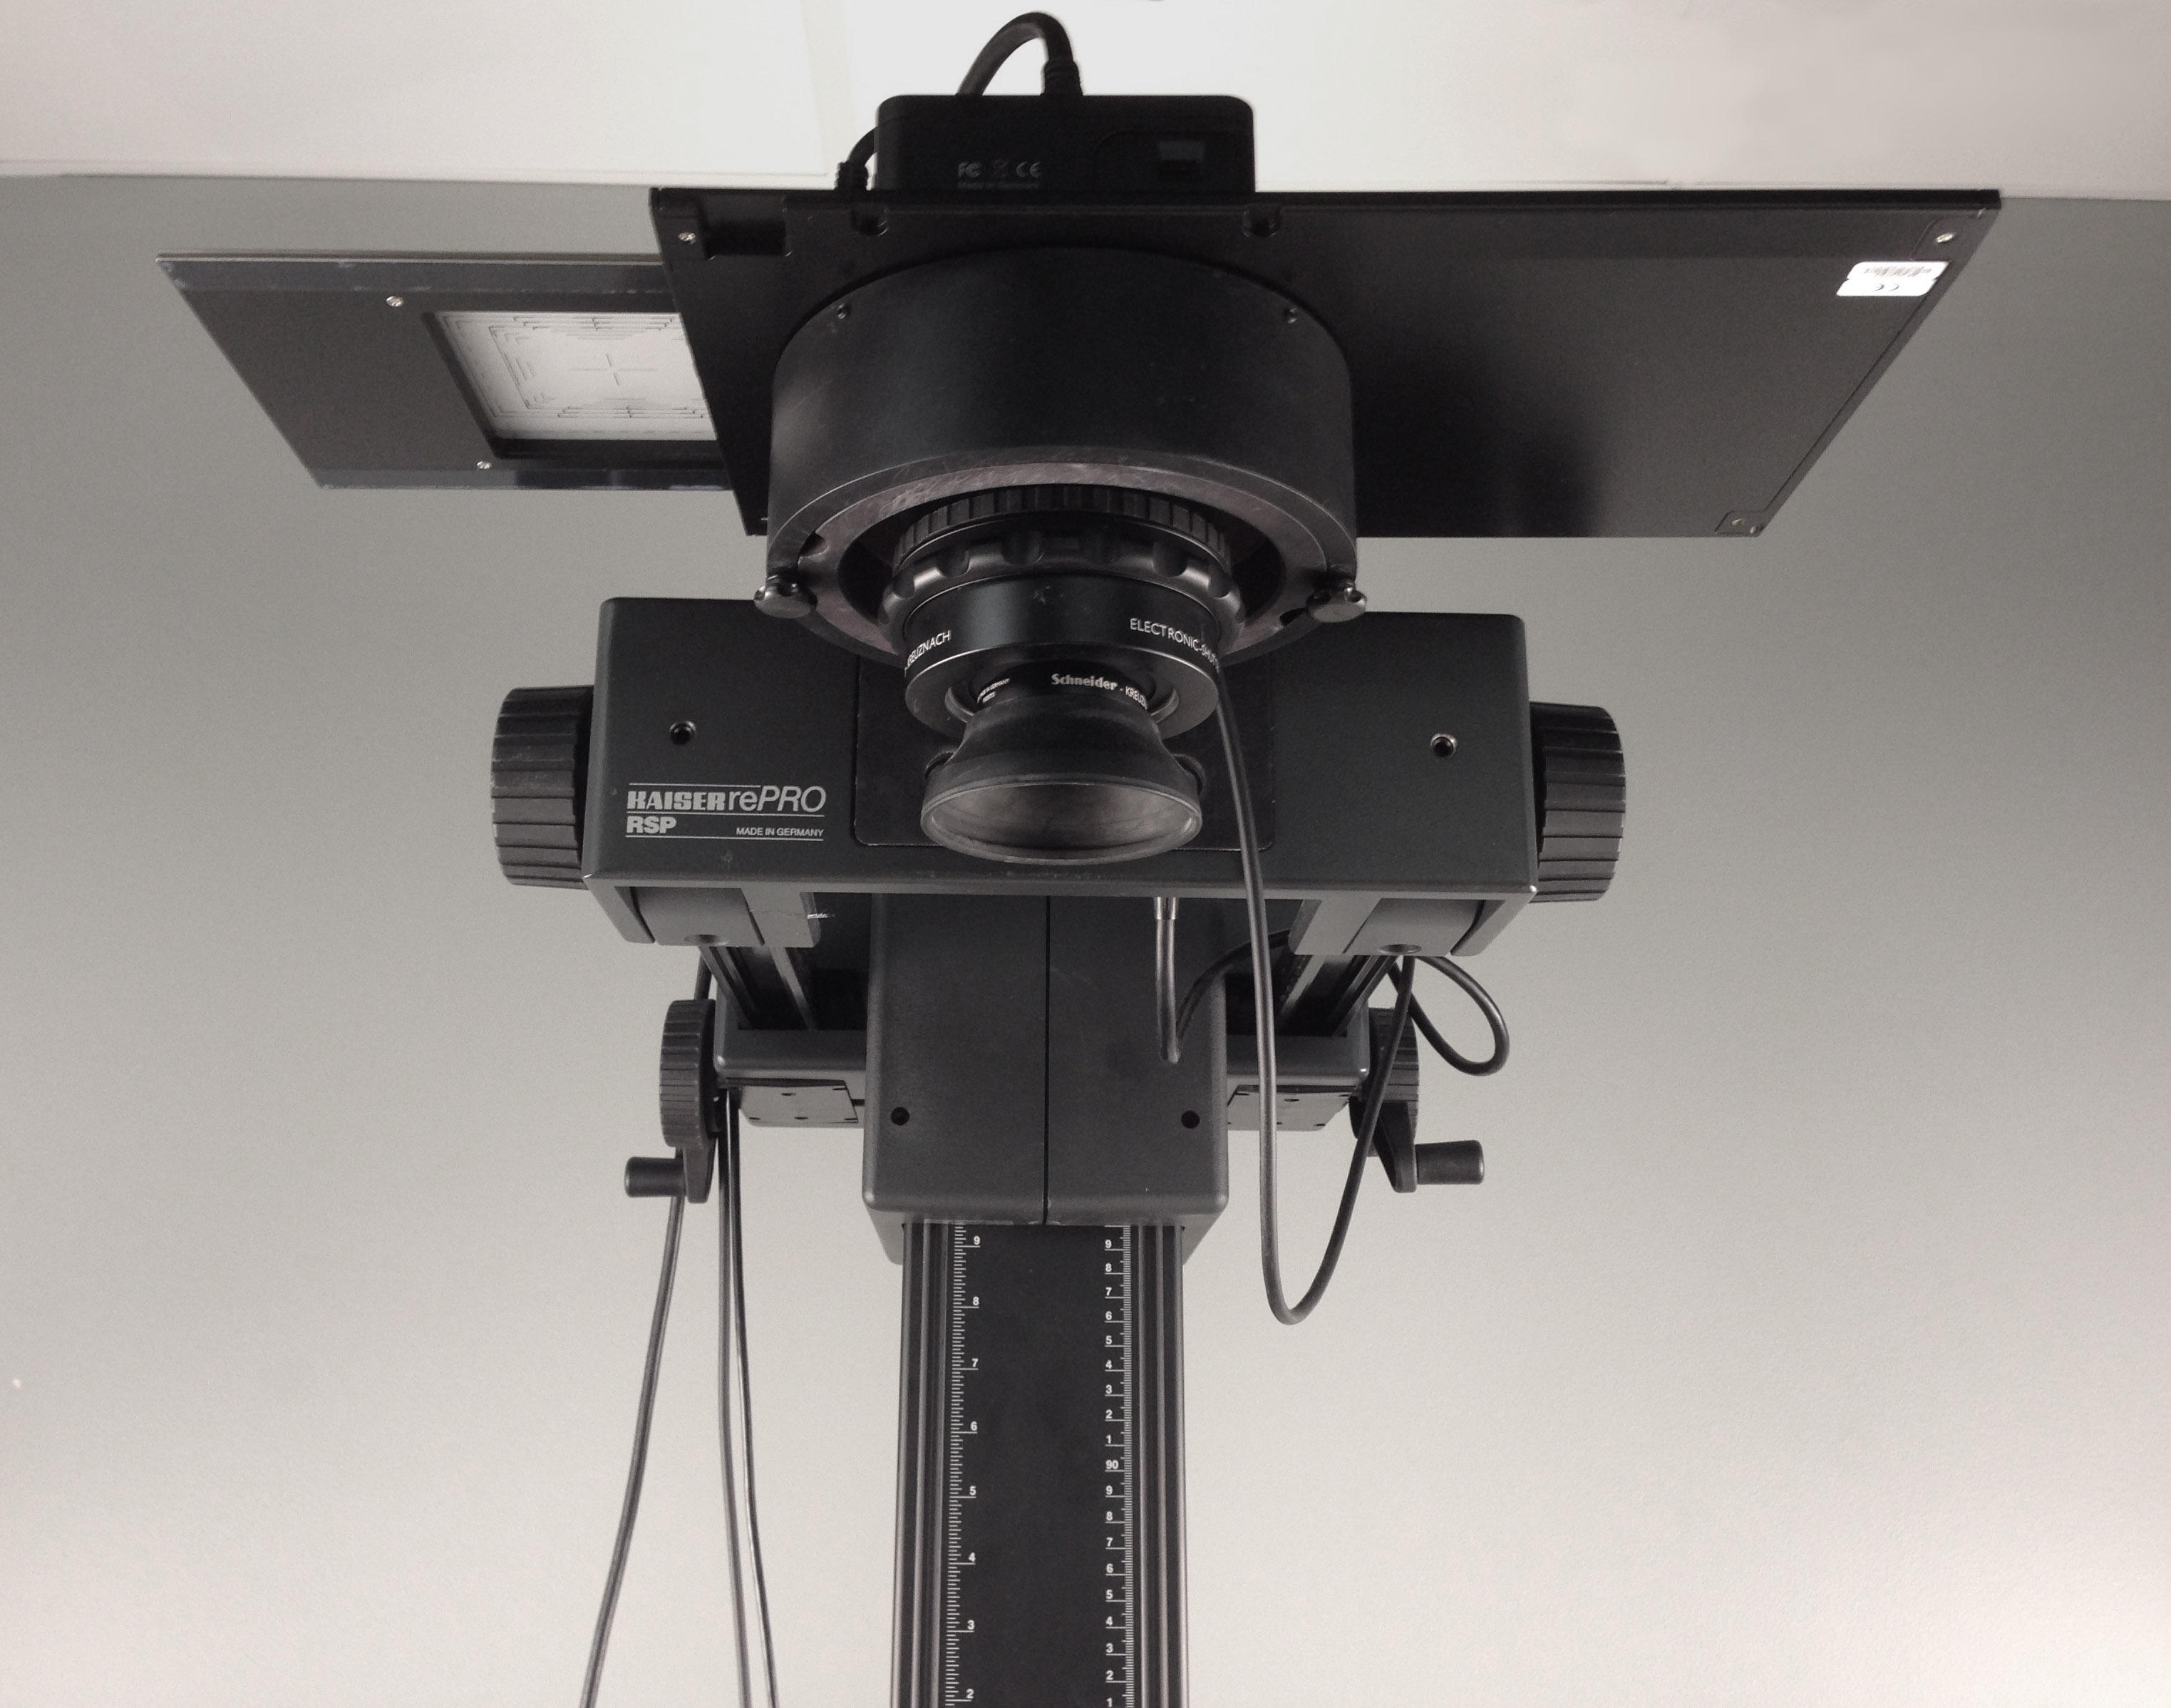
With all loose unbound issues, the Zeutschel is our go-to scanner because it allows for large format items to be imaged on a flat surface. This is less invasive and less damaging to the pages, and is quicker than other scanning methods. The Zeutschel can handle items up to 25 x 18 inches, which accommodates the larger sized formats of the Chronicle used in the 1940s and 1950s. If bound issues must be digitized, due to the absence of a loose copy or the inability to safely dis-bound a volume, the Phase One digital camera system is used as it can better capture large bound pages that may not necessarily lay flat.
Folders each containing multiple page images of one Chronicle issue
For every scanning session, we need the digitization guide handy as it tells what to name the image files using the previously assigned unique identifier. Each issue of the newspaper is scanned as a separate folder of images, with one image representing one page of the newspaper. This system of organization allows for each issue to become its own compound object – multiple files bound together with an XML structure – once published to the website. The Zeutschel’s scanning software helps organize these image files into properly named folders. Of course, no digitization session would be complete without the initial target scan that checks for color calibration (See Mike Adamo’s post for a color calibration crash course).
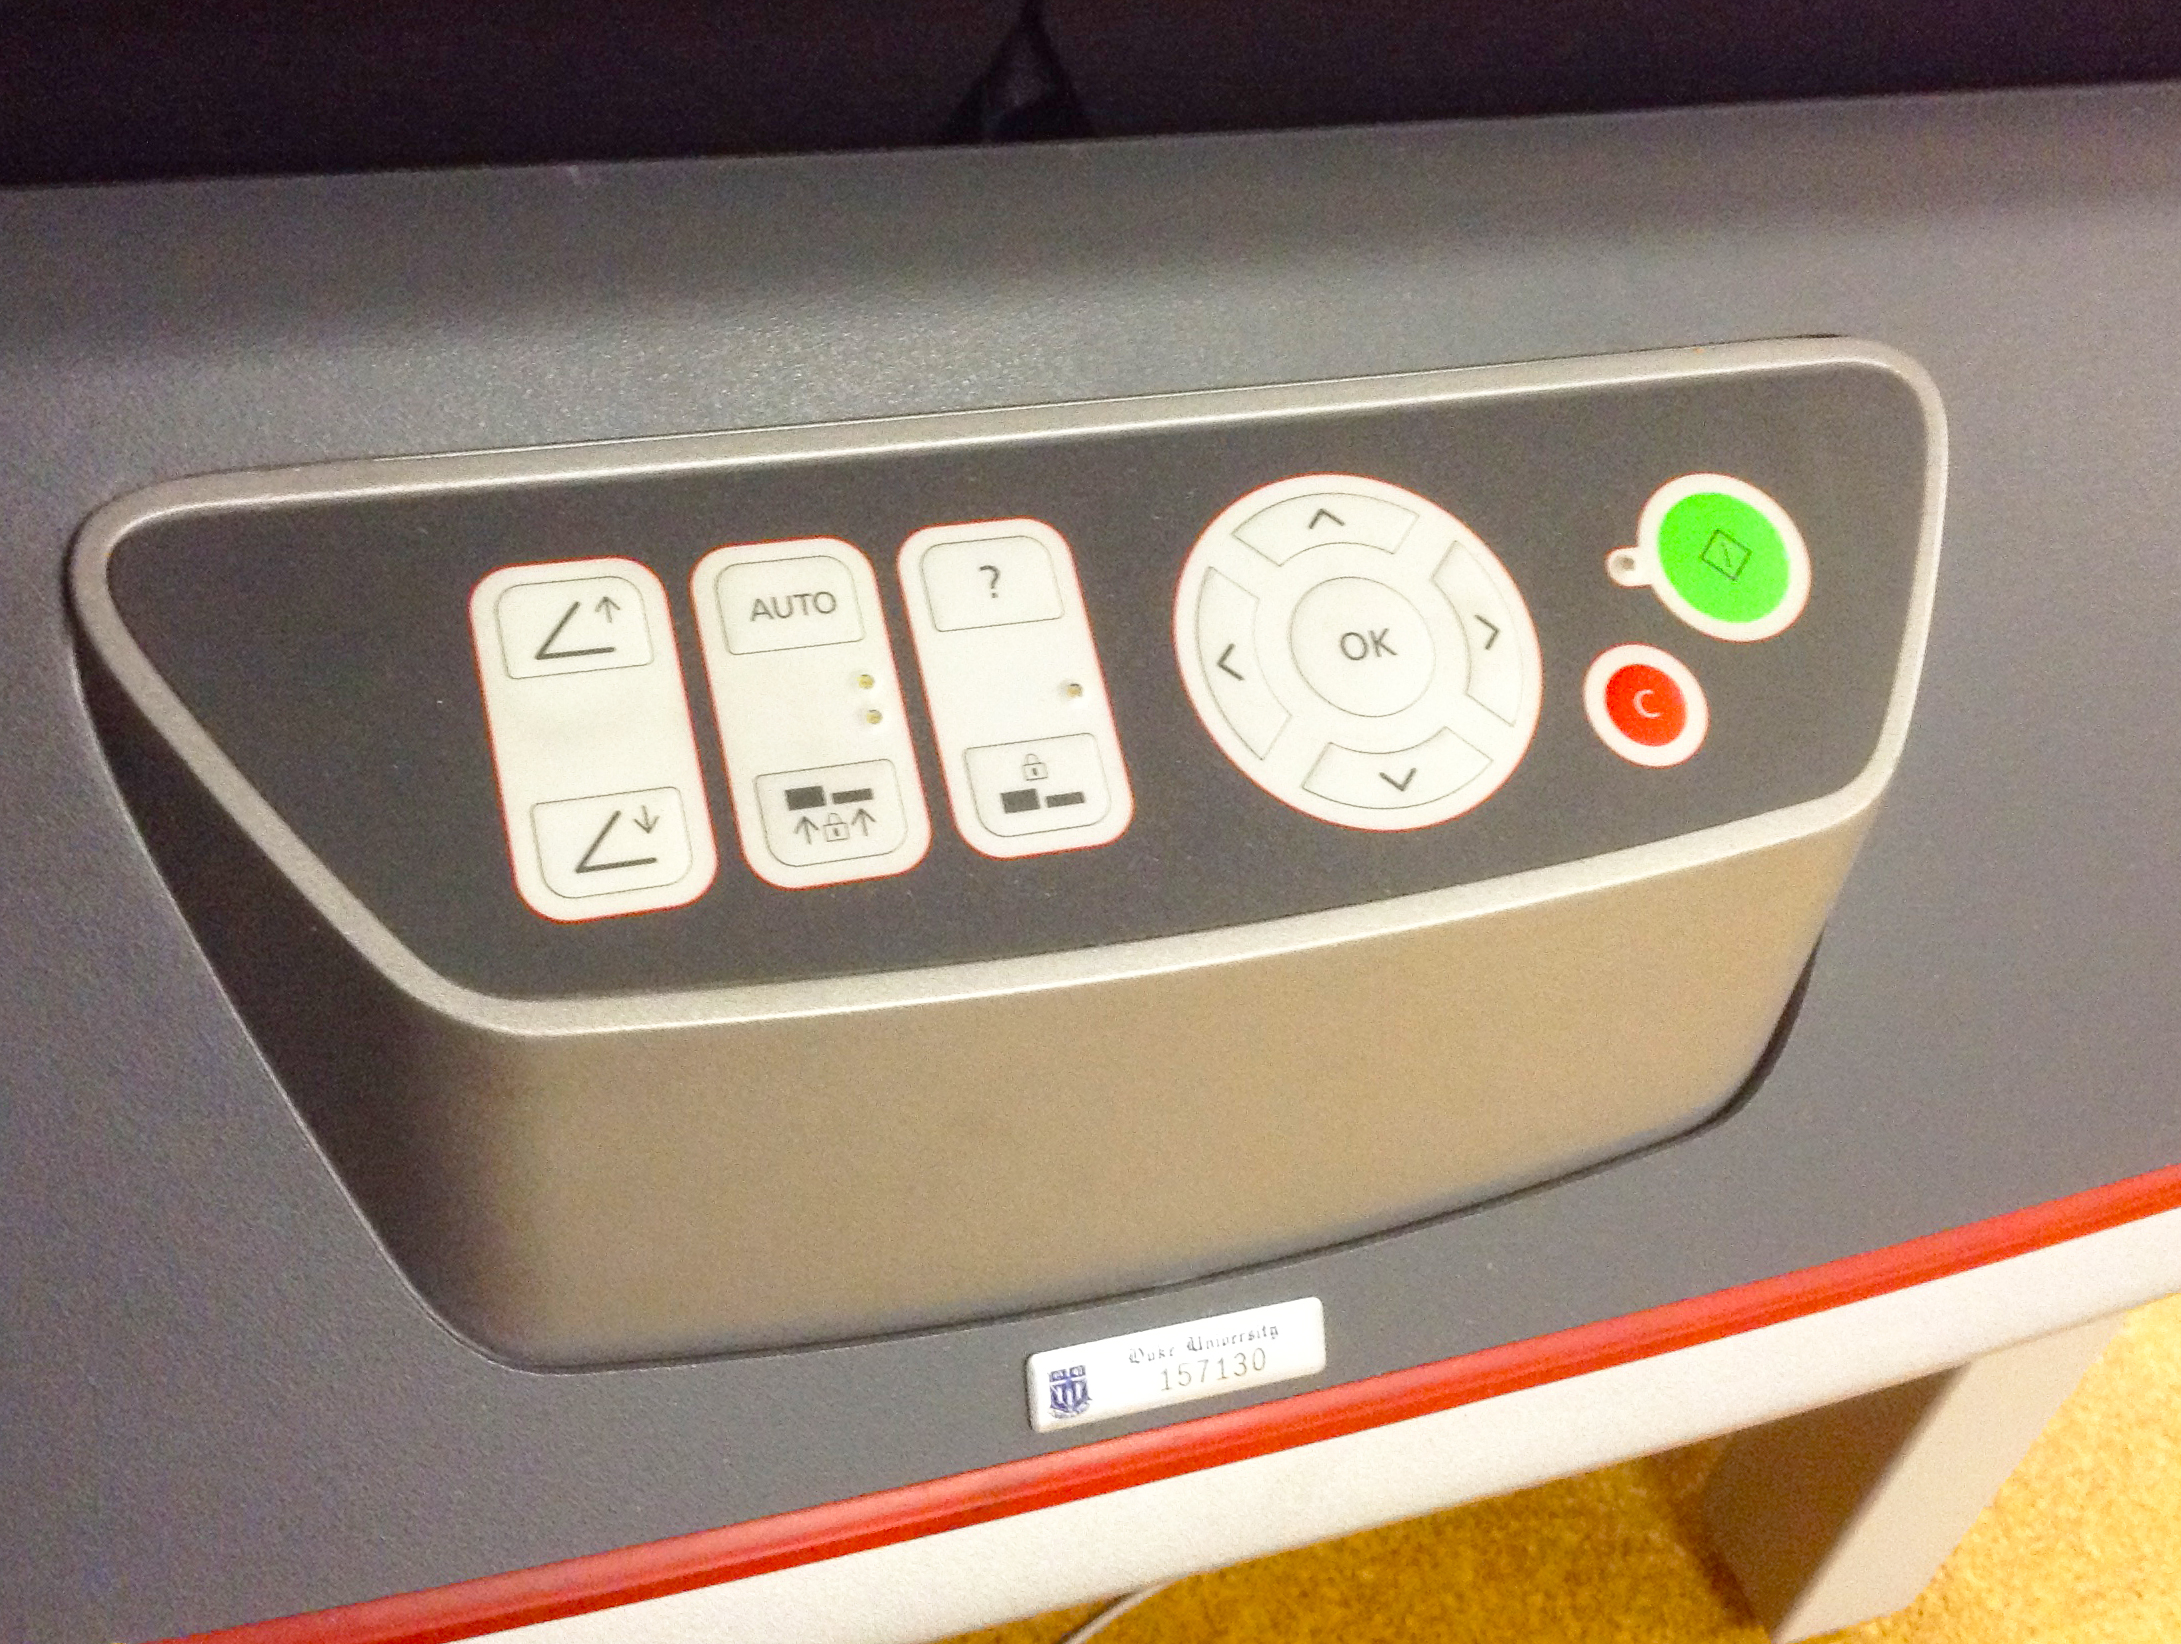
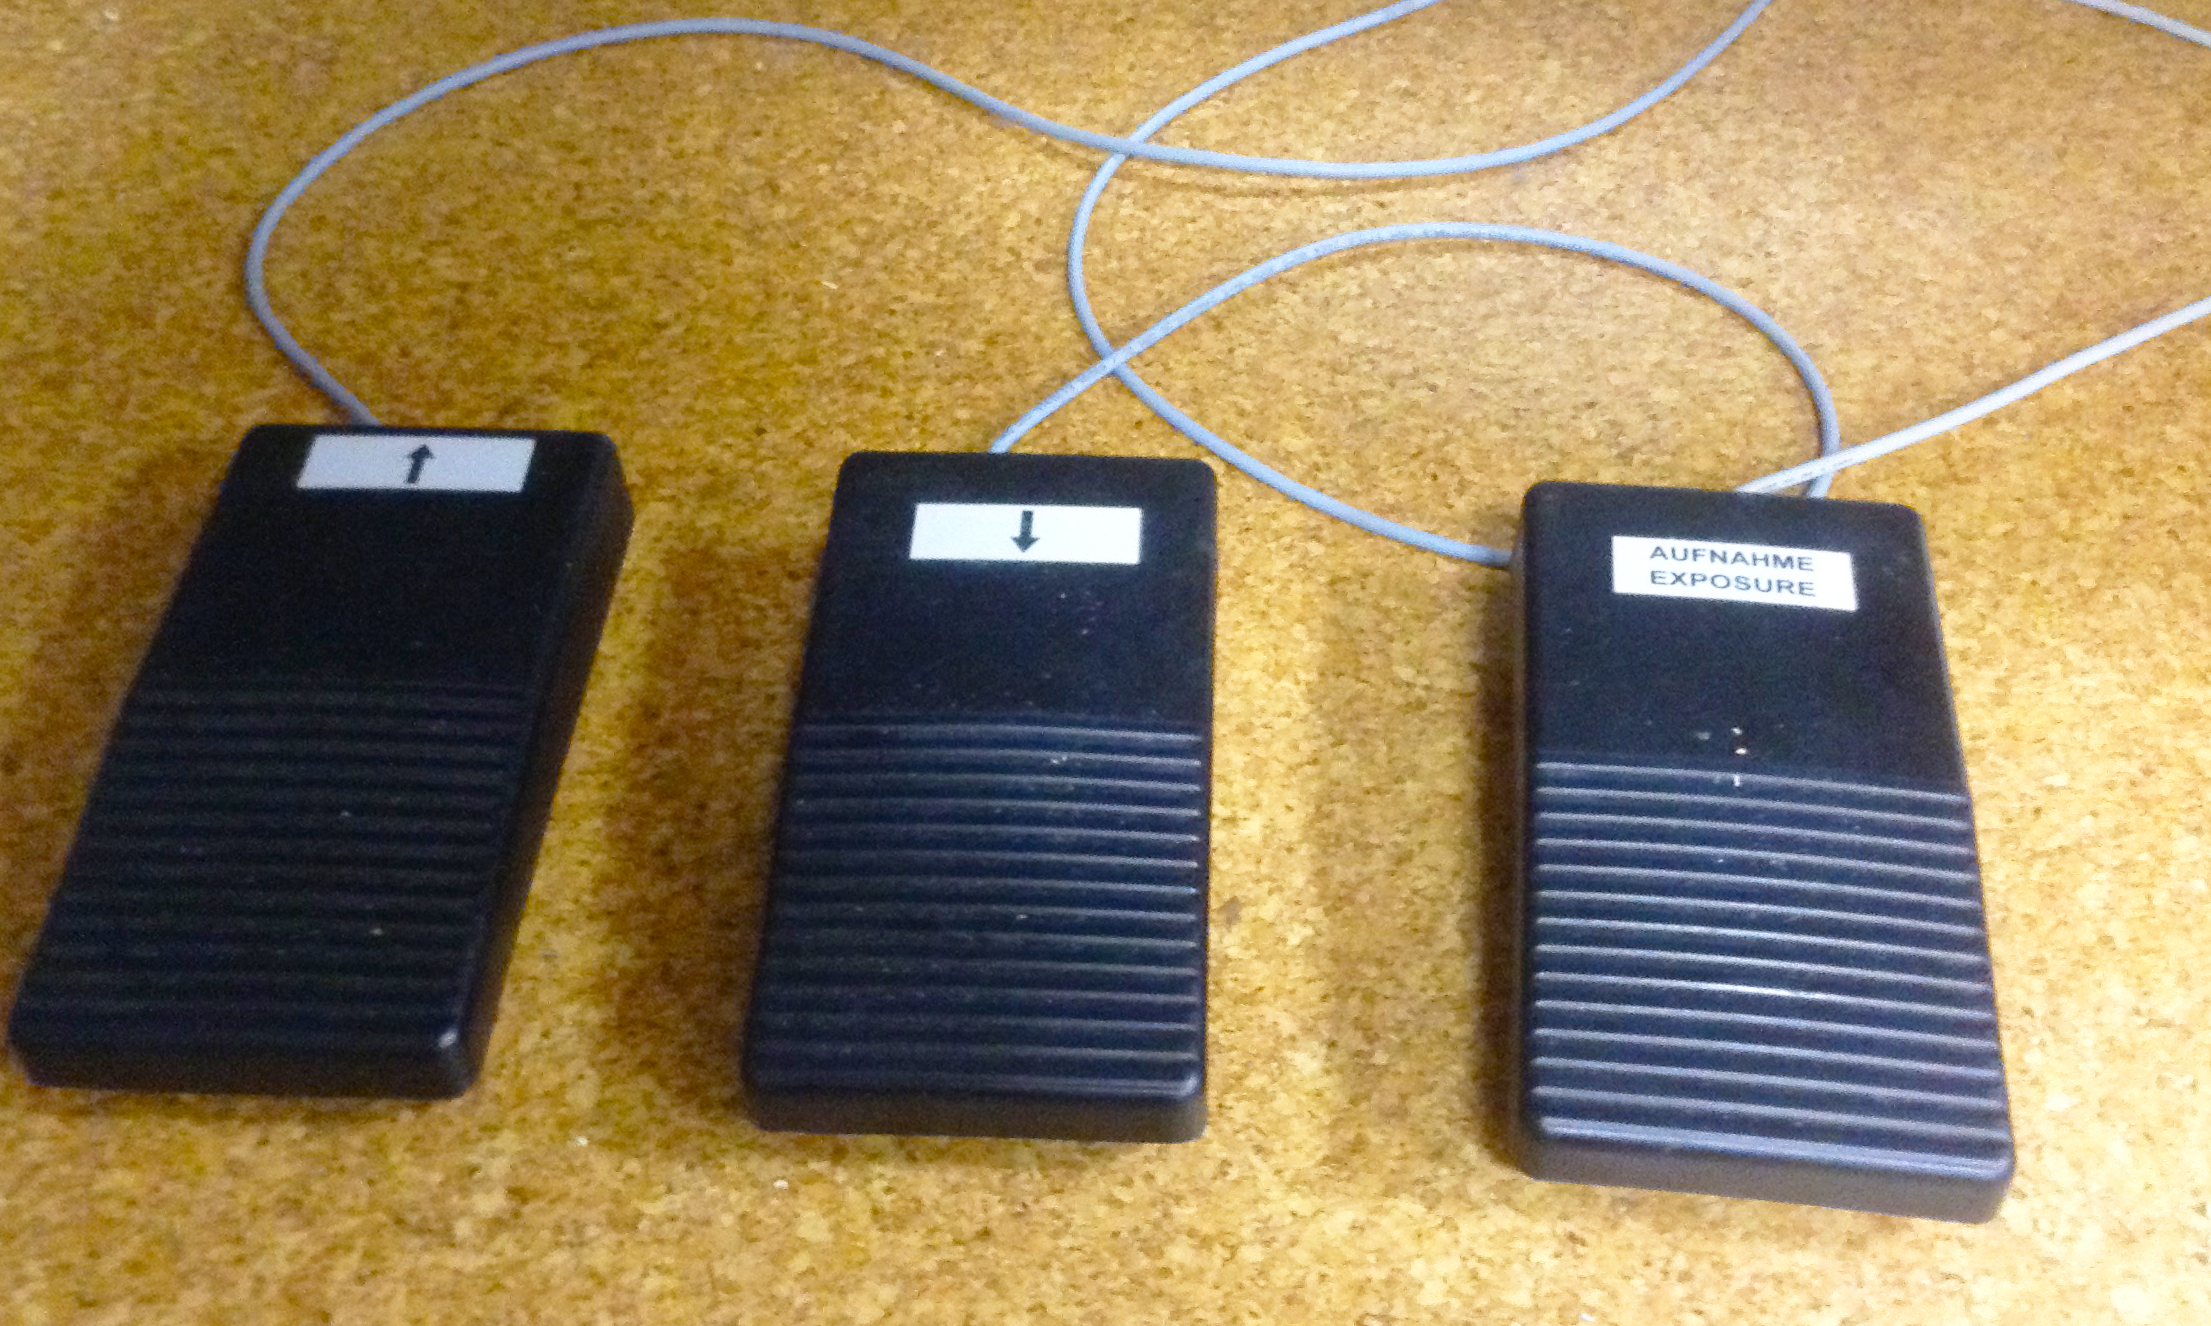
The Zeutschel’s control panel of buttonsThe Zeutschel’s optional foot pedals
The scanner’s plate glass can now be raised with the push of a button (or the tap of a foot pedal) and the Chronicle issue is placed on the flatbed. Lowering the plate glass down, the pages are flattened for a better scan result. Now comes the excitement… we can finally press SCAN. For each page, the plate glass is raised, lowered, and the scan button is pressed. Chronicle issues can have anywhere from 2 to 30 or more pages, so you can image this process can become monotonous – or even mesmerizing – at times. Luckily, with the smaller format decades, like the 1970s and 1980s, the inner pages can be scanned two at a time and the Zeutschel software separates them into two images, which cuts down on the scan time. As for the larger formats, the pages are so big you can only fit one on the flatbed. That means each page is a separate scan, but older years tended to publish less issues, so it’s a trade-off. To put the volume of this work into perspective, the 1,408 issues of the 1980s Chronicle took 28,089 scans to complete, while the 1950s Chronicle of about 482 issues took around 3,700 scans to complete.
A 1940s Chronicle page is placed on the flatbed for scanning
Scanning in progress of the 1940s Chronicle pageTarget image opened in Adobe Photoshop for color calibration
Every scanned image that pops up on the screen is also checked for alignment and cropping errors that may require a re-scan. Once all the pages in an issue are digitized and checked for errors, clicking the software’s Finalize button will compile the images in the designated folder. We now return to our digitization guide to enter in metadata pertaining to the scanning of that issue, including capture person, capture date, capture device, and what target image relates to this session (subsequent issues do not need a new target scanned, as long as the scanning takes place in the same session).
Now, with the next issue, rinse and repeat: set the software settings and name the folder, scan the issue, finalize, and fill out the digitization guide. You get the gist.
Post-Scanning Procedures
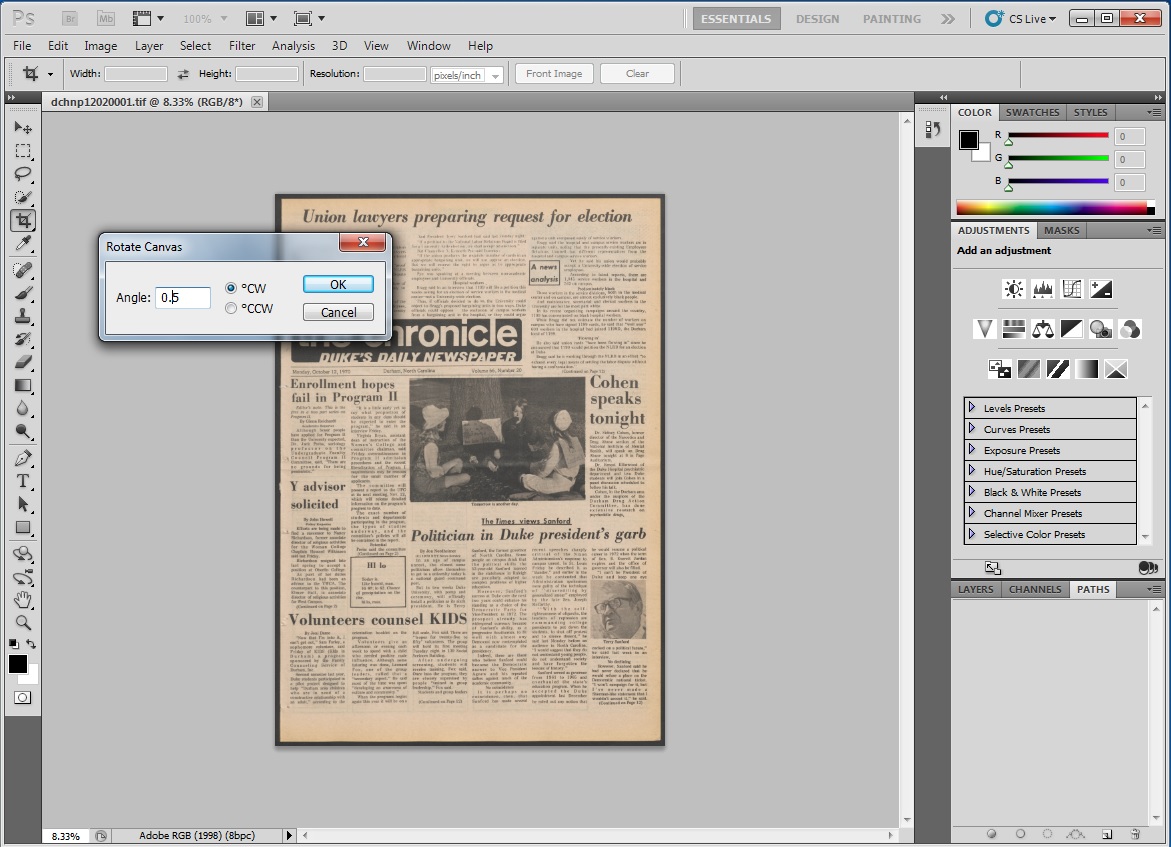
Rotating an image in Adobe Photoshop
We now find ourselves with a slue of folders filled with digitized Chronicle images. The next phase of the process is quality control (QC). Once every issue from the decade is scanned, the first round of QC checks all images for excess borders to be cropped, crooked images to be squared, and any other minute discrepancy that may have resulted from the scanning process. This could be missing images, pages out of order, or even images scanned upside down. This stage of QC is often performed by student workers who diligently inspect image after image using Adobe Photoshop. The second round of QC is performed by our Digital Production Specialist Zeke Graves who gives every item a final pass.
At this stage, derivatives of the original preservation-quality images are created. The originals are archived in dark storage, while the smaller-sized derivatives are used in the CONTENTdm ingest process. CONTENTdm is the digital collection management software we use that collates the digital images with their appropriate descriptive metadata from our digitization guide, and creates one compound object for each Chronicle issue. It also generates the layer of Optical Character Recognition (OCR) data that makes the Chronicle text searchable, and provides an online interface for users to discover the collection once published on the website. The images and metadata are ingested into CONTENTdm’s Project Client in small batches (1 to 3 years of Chronicle issues) to reduce the chance of upload errors. Once ingested into CONTENTdm, the items are then spot-checked to make sure the metadata paired up with the correct image. During this step, other metadata is added that is specific to CONTENTdm fields, including the ingest person’s initials. Then, another ingest must run to push the files and data from the Project Client to the CONTENTdm server. A third step after this ingest finishes is to approve the items in the CONTENTdm administrative interface. This gives the go-ahead to publish the material online.
Hold on, we aren’t done yet. The project is now passed along to our developers in DPPS who must add this material to our digital collections platform for online discovery and access (they are currently developing Tripod3 to replace the previous Tripod2 platform, which is more eloquently described in Will Sexton’s post back in April). Not only does this improve discoverability, but it makes all of the library’s digital collections look more uniform in their online presentation.
Then, FINALLY, the collection goes live on the web. Now, just repeat the process for every decade of the Duke Chronicle, and you can see how this can become a rather time-heavy and laborious process. A labor of love, that is.
I could have narrowly stuck with describing to you the scanning process and the wonders of the Zeutschel, but I felt that I’d be shortchanging you. Active scanning is only a part of the whole digitization process which warrants a much broader narrative than just “push scan.” Along this journey to digitize the Duke Chronicle, we’ve collectively learned many things. The quirks and trials of each decade inform our process for the next, giving us the chance to improve along the way (to learn how we reflect upon each digital project after completion, go to Molly Bragg’s blog post on post-mortem reports).
If your curiosity is piqued as to how the Duke Chronicle looks online, the Fall 1959-Spring 1970 and January 1980-February 1989 issues are already available to view in our digital collections. The 1970s Chronicle is the next decade slated for publication, followed by the 1950s. Though this isn’t a comprehensive detailed account of the digitization process, I hope it provides you with a clearer picture of how we bring a collection, like the Duke Chronicle, into digital existence.
One of the most tedious and time-consuming tasks we do in the Digital Production Center is cropping and straightening still image files. Hired students spend hours sitting at our computers, meticulously straightening and cropping extraneous background space out of hundreds of thousands of photographed images, using Adobe Photoshop. This process is neccessary in order to present a clean, concise image for our digital collections, but it causes delays in the completion of our projects, and requires a lot of student labor. Auto cropping software has long been sought after in digital imaging, but few developers have been able to make it work efficiently, for all materials. The Digital Production Center’s Zeutschel overhead scanner utilizes auto cropping software, but the scanner can only be used with completely flat media, due to its limited depth of field. Thicker and more fragile materials must be photographed using our Phase One digital camera system, shown above.
Capture One’s Cultural Heritage software includes the auto crop feature.
Recently, Digital Transitions, who is the supplier of Phase One and it’s accompanying Capture One software, announced an update to the software which includes an auto crop and straightening feature. The new software is called Capture One Cultural Heritage, and is specifically designed for use in libraries and archival institutions. The auto crop feature, previously unavailable in Capture One, is a real breakthrough, and there are several options for how to use it.
First of all, the user can choose to auto crop “On Capture” or “On Crop.” That is, the software can auto crop instantly, right after a photograph has been taken (On Capture), or it can be applied to the image, or batch of images, at a later time (On Crop). You can also choose between auto cropping at a fixed size, or by the edge of the material. For instance, if you are photographing a collection of posters that are all sized 18” x 24,” you would choose “Fixed Size” and set the primary crop to “18 x 24,” or slightly larger if you want your images to have an outer border. The software recognizes the rectangular shape, and applies the crop. If you are photographing a collection of materials that are a variety of different sizes, you would choose “Generic,” which tells the software to crop wherever it sees a difference between the edge of the material and the background. “Padding” can be used to give those images a border.
The Digital Production Center’s Phase One camera system.
Because Capture One utilizes raw files, the auto crops are non-destructive edits. One benefit of this is that if your background color is close to the color of your material, you can temporarily adjust the contrast of the photograph in order to darken the edges of the object, thus enhancing the delineation between object and background. Next apply the auto crop, which will be more successful due to it’s ability to recognize the newly-defined edges of the material. After the crops are applied, you can reverse the contrast adjustment, thus returning the images to their original state, while still keeping the newly-generated crops.
Temporarily increasing the contrast of your images can help the auto crop feature find the edges of the object.
Like a lot of technological advances, reliable auto cropping seemed like a fantasy just a few years ago, but is now a reality. It doesn’t work perfectly every time, and quality control is still necessary to uncover errors, but it’s a big step forward. The only thing disconcerting is the larger question facing our society. How long will it be before our work is completely automated, and humans are left behind?
My last several posts have focused on endangered–some would say obsolete–audio formats: open reel tape, compact cassette, DAT, and Minidisc. In this installment, we travel back to the dawn of recorded sound and the 20th Century to investigate some of the earliest commercial recording media. Unlike the formats above, which operate on post-WW2 magnetic and optical technology, these systems carved sound waves into stone (or, more accurately, wax) behind strictly acousto-mechanical principles.
Thomas Edison is credited as inventing the first phonograph (“soundwriter”) on July 18, 1877. It consisted of tinfoil wrapped around a hand-cranked metal cylinder. Sound waves would be funneled through a horn, causing a stylus to vibrate and indent a groove around the outside of the cylinder. The cylinder could be played by reversing the procedure: By retracing the groove with the stylus, the sound would be amplified back through the horn and heard as a rough approximation of the original sound.
Alexander Graham Bell quickly improved the innovation by introducing wax as a superior material for the cylinders and using a needle to scratch the sound waves into their surface. He called his device the “Graphophone”. By 1888, Edison had also adopted wax as the preferred medium for recorded cylinders and a patent-sharing agreement was signed. In 1889, the wax cylinder because the first commercially marketed audio medium.
Initially, the cylinders were installed in the ancestors of jukeboxes in public places. Drop a coin into the slot, and the machine would magically dispense a song, monologue, or comedy routine. The technology was soon adapted for home use. Consumers could purchase prerecorded cylinders to play on their machines. Perhaps more amazingly, they could buy a home recording attachment and cut their own content onto the wax.
[PAUSE—shift from PLAY to RECORD mode]
Biographical and Historical Note
Frank Clyde Brown (1870-1943) served as a Professor of English at Trinity College, Duke University, from 1909 until his death. A native of Virginia, he received his Ph.D. at the University of Chicago in 1908. While at Duke University he served in many capacities, including being chairman of his department, University Marshal, and Comptroller of the University during its initial construction. These aspects of his life are chronicled in his papers held by the Duke University Archives.
This collection of materials, however, is concerned with activities to which he devoted equal time and energy, the organization of the North Carolina Folklore Society in 1913 and his personal effort to gather and record the nuances and culture of “folk” of North Carolina and its near neighbors, which occupied him from 1912 until his death. Under the impetus of a 1912 mailing from John A. Lomax, then President of the American Folklore Society, Brown as well as other faculty members and other citizens in North Carolina, became interested in folklore and organized the North Carolina Folklore Society in 1913, with Brown as secretary-treasurer. As secretary-treasurer of this organization from its inception until his death, he provided the organizational impetus behind the Society. Through his course in folklore at Duke, he also sent class after class out to gather the folklore of their locales, both during their studies and afterward. And virtually every summer he could be found in the most remote parts of the state, with notebook and recorder — first a dictaphone employing cylinders, and later a machine employing aluminum discs provided for his use by the University. The result, by 1943, was a collection of about 38,000 written notes on lore, 650 musical scores, 1400 songs vocally recorded, and numerous magazine articles, student theses, books, lists, and other items related to this study. The material originated in at least 84 North Carolina counties, with about 5 percent original in 20 other states and Canada, and came from the efforts of 650 other contributors besides Brown himself.
[STOP]
[POWER OFF]
Thanks to our Audiovisual Archivist, Craig Breaden, for the excellent photos and unused title suggestion (“The Needle and the Damage Done”). Future posts will include updates on work with the Frank C. Brown Collection, other audio collections at Duke, and the history of sound recording and reproduction.
Before you let your eyes glaze over at the thought of metadata, let me familiarize you with the term and its invaluable role in the creation of the library’s online Digital Collections. Yes, metadata is a rather jargony word librarians and archivists find themselves using frequently in the digital age, but it’s not as complex as you may think. In the most simplistic terms, the Society of American Archivists defines metadata as “data about data.” Okay, what does that mean? According to the good ol’ trusty Oxford English Dictionary, it is “data that describes and gives information about other data.” In other words, if you have a digitized photographic image (data), you will also have words to describe the image (metadata).
Better yet, think of it this way. If that image were of a large family gathering and grandma lovingly wrote the date and names of all the people on the backside, that is basic metadata. Without that information those people and the image would suddenly have less meaning, especially if you have no clue who those faces are in that family photo. It is the same with digital projects. Without descriptive metadata, the items we digitize would hold less meaning and prove less valuable for researchers, or at least be less searchable. The better and more thorough the metadata, the more it promotes discovery in search engines. (Check out the metadata from this Cornett family photo from the William Gedney collection.)
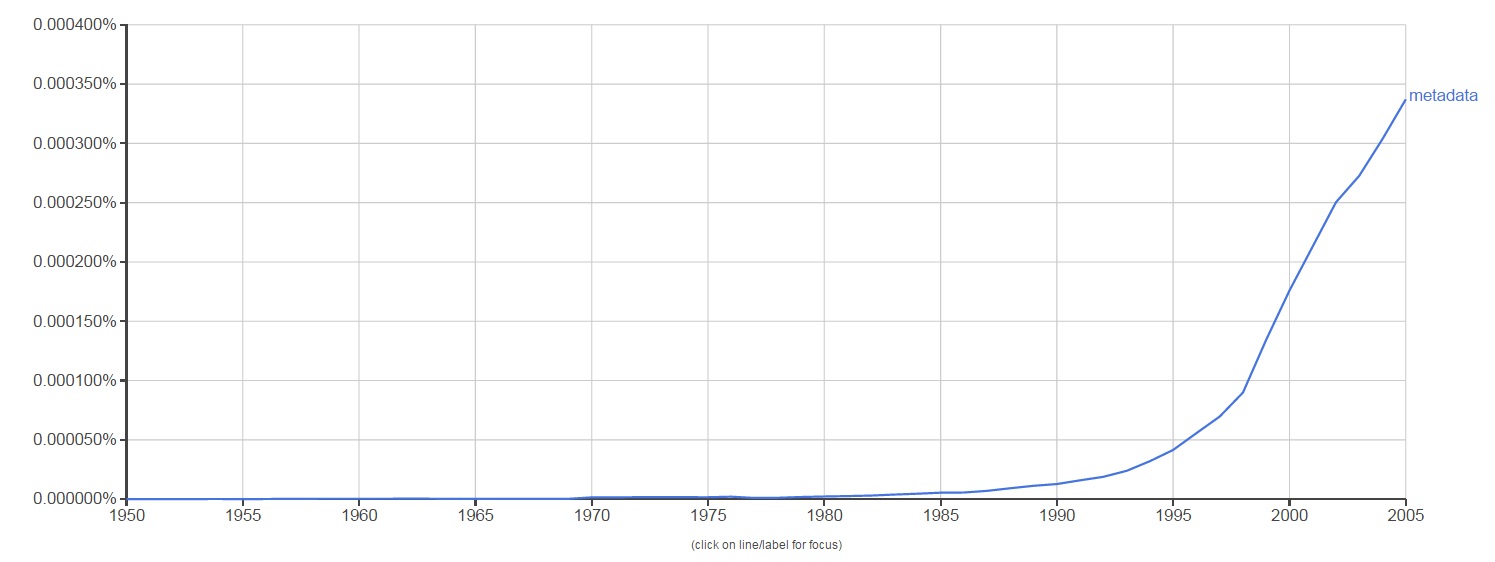
The term metadata was first used in the late 1960s in computer programming language. With the advent of computing technology and the overabundance of digital data, metadata became a key element to help describe and retrieve information in an automated way. The use of the word metadata in literature over the last 45 years shows a steeper increase from 1995 to 2005, which makes sense. The term became used more and more as technology grew more widespread. This is reflected in the graph below from Google’s Ngram Viewer, which scours over 5 million Google Books to track the usage of words and phrases over time.
Google Ngram Viewer for “metadata”
Because of its link with computer technology, metadata is widely used in a variety of fields that range from computer science to the music industry. Even your music playlist is full of descriptive metadata that relates to each song, like the artist, album, song title, and length of audio recording. So, libraries and archives are not alone in their reliance on metadata. Generating metadata is an invaluable step in the process of preserving and documenting the library’s unique collections. It is especially important here at the Digital Production Center (DPC) where the digitization of these collections happens. To better understand exactly how important a role metadata plays in our job, let’s walk through the metadata life cycle of one of our digital projects, the Duke Chapel Recordings.
The Chapel Recordings project consists of digitizing over 1,000 cassette and VHS tapes of sermons and over 1,300 written sermons that were given at the Duke Chapel from the 1950s to 2000s. These recordings and sermons will be added to the existing Duke Chapel Recordings collection online. Funded by a grant from the Lilly Foundation, this digital collection will be a great asset to Duke’s Divinity School and those interested in hermeneutics worldwide.
Before the scanners and audio capture devices are even warmed up at the DPC, preliminary metadata is collected from the analog archival material. Depending on the project, this metadata is created either by an outside collaborator or in-house at the DPC. For example, the Duke Chronicle metadata is created in-house by pulling data from each issue, like the date, volume, and issue number. I am currently working on compiling the pre-digitization metadata for the 1950s Chronicle, and the spreadsheet looks like this:
1950s Duke Chronicle preliminary metadata
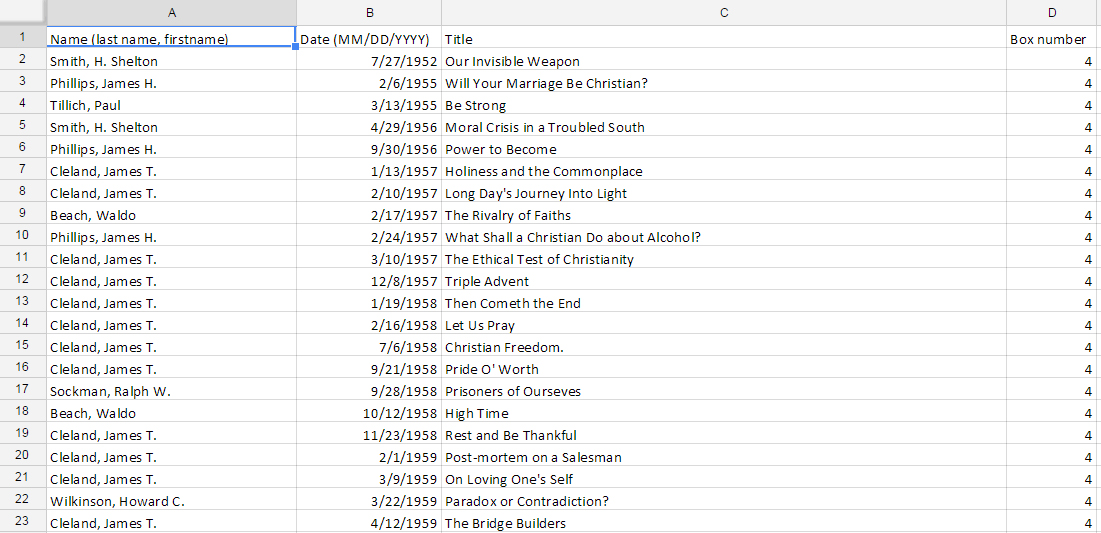
As for the Chapel Recordings project, the DPC received an inventory from the University Archives in the form of an Excel spreadsheet. This inventory contained the preliminary metadata already generated for the collection, which is also used in Rubenstein Library‘s online collection guide.
Chapel Recordings inventory metadata
The University Archives also supplied the DPC with an inventory of the sermon transcripts containing basic metadata compiled by a student.
Duke Chapel Records sermon metadata
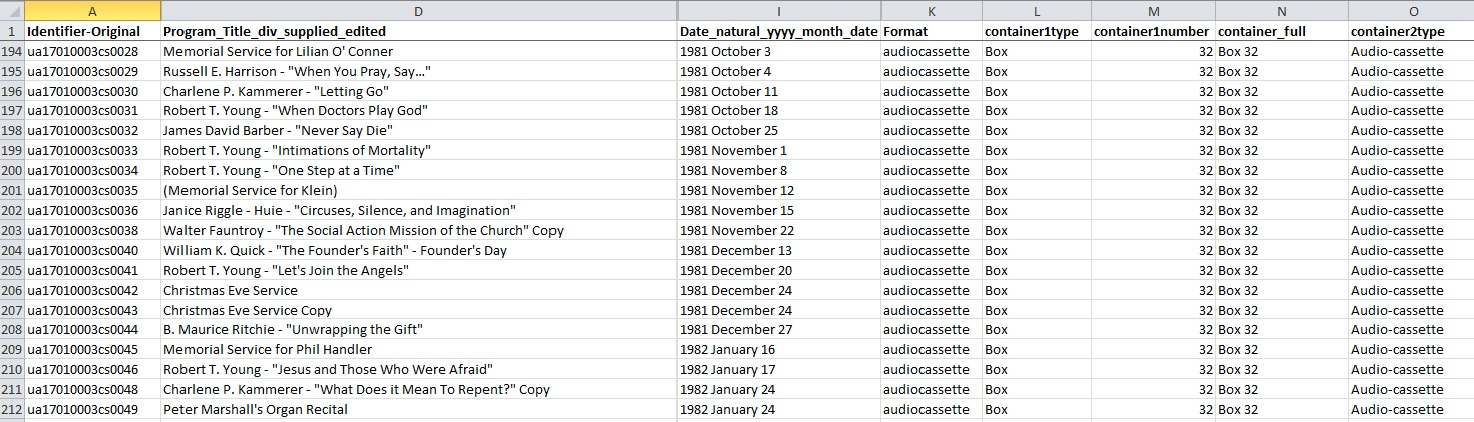
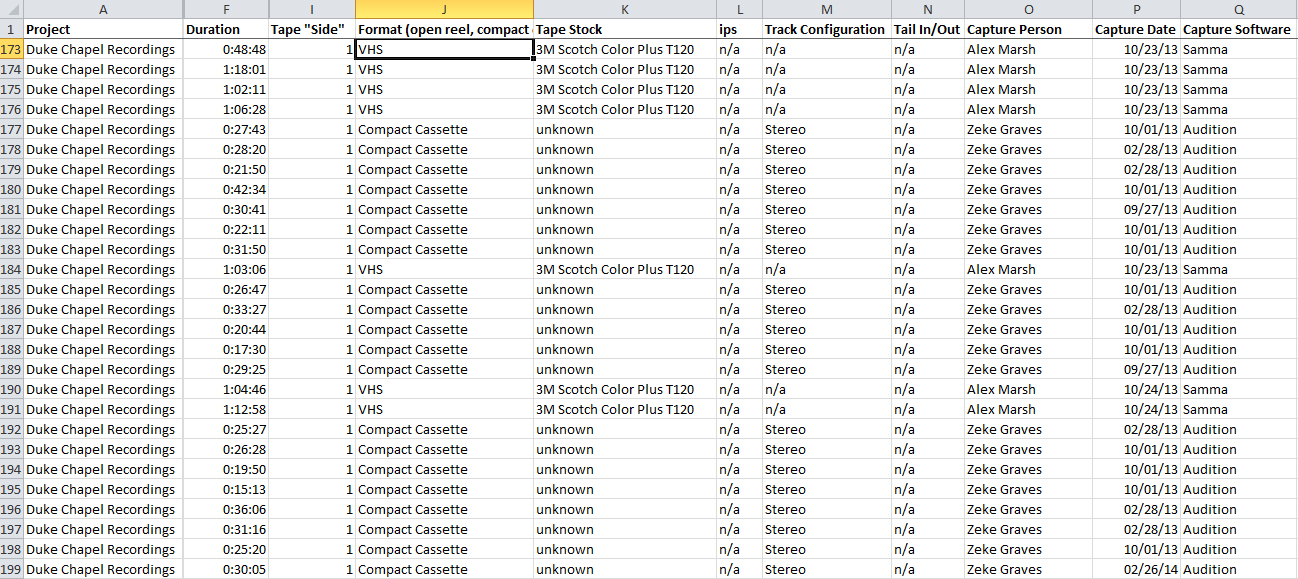
Here at the DPC, we convert this preliminary metadata into a digitization guide, which is a fancy term for yet another Excel spreadsheet. Each digital project receives its own digitization guide (we like to call them digguides) which keeps all the valuable information for each item in one place. It acts as a central location for data entry, but also as a reference guide for the digitization process. Depending on the format of the material being digitized (image, audio, video, etc.), the digitization guide will need different categories. We then add these new categories as columns in the original inventory spreadsheet and it becomes a working document where we plug in our own metadata generated in the digitization process. For the Chapel Recordings audio and video, the metadata created looks like this:
Chapel Recordings digitization metadata
Once we have digitized the items, we then run the recordings through several rounds of quality control. This generates even more metadata which is, again, added to the digitization guide. As the Chapel Recordings have not gone through quality control yet, here is a look at the quality control data for the 1980s Duke Chronicle:
1980s Duke Chronicle quality control metadata
Once the digitization and quality control is completed, the DPC then sends the digitization guide filled with metadata to the metadata archivist, Noah Huffman. Noah then makes further adds, edits, and deletes to match the spreadsheet metadata fields to fields accepted by the management software, CONTENTdm. During the process of ingesting all the content into the software, CONTENTdm links the digitized items to their corresponding metadata from the Excel spreadsheet. This is in preparation for placing the material online. For even more metadata adventures, see Noah’s most recent Bitstreams post.
In the final stage of the process, the compiled metadata and digitized items are published online at our Digital Collections website. You, the researcher, history fanatic, or Sunday browser, see the results of all this work on the page of each digital item online. This metadata is what makes your search results productive, and if we’ve done our job right, the digitized items will be easily discovered. The Chapel Recordings metadata looks like this once published online:
Chapel Recordings metadata as viewed online
Further down the road, the Duke Divinity School wishes to enhance the current metadata to provide keyword searches within the Chapel Recordings audio and video. This will allow researchers to jump to specific sections of the recordings and find the exact content they are looking for. The additional metadata will greatly improve the user experience by making it easier to search within the content of the recordings, and will add value to the digital collection.
On this journey through the metadata life cycle, I hope you have been convinced that metadata is a key element in the digitization process. From preliminary inventories, to digitization and quality control, to uploading the material online, metadata has a big job to do. At each step, it forms the link between a digitized item and how we know what that item is. The life cycle of metadata in our digital projects at the DPC is sometimes long and tiring. But, each stage of the process creates and utilizes the metadata in varied and important ways. Ultimately, all this arduous work pays off when a researcher in our digital collections hits gold.
We have digitized some fairly complex objects over the years that have challenged our Digital Collections team to push the boundaries of typical digital library solutions for digitization and publication. It happens often: objects we want to digitize are sort of like something we’ve done for a previous project, but not quite, so we can’t simply mimic whatever we did before to get the new project done. We’re frequently flexing our creative muscles. In many cases, our most successful projects ended up that way because we didn’t concede to the temptation of representing items digitally in an oversimplified manner, or, worse still, as something they are not.
Working with so many rare and unique items from the Rubenstein Library through the years, we’ve become unfazed by these representation challenges and time and again have simply pulled together our team’s brainpower (and willpower) to make something work. Dare I say it, we’ve been unflappable. But this year, we met our match and surely needed some help.
In March, we published ten anatomical fugitive sheets from the 1500s to 1600s. They’re printed illustrations from the Rubenstein Library’s History of Medicine Collections, depicting the human body using layers of paper flaps that can be lifted to reveal internal organs. They’re amazing. They’re distinctive. And they’re really complicated.
The complexity of this project necessitated enlisting help from beyond the library’s walls. Early on, Prof. Mark Olson in Duke’s Art, Art History & Visual Studies department was instrumental in helping us identify modern technical approaches for capturing and modeling such objects. We contracted out development work through local web firm Cuberis, who programmed the bulk of the UI. In-house, we handled digitization, metadata, and integration with our discovery & access application with a lot of collaborative creativity between the digital collections team, the collection curator, conservators, and rare materials cataloger.
In a moment, I’ll discuss what modern technologies make the Fugitive Sheets interface hum. But first, here’s a look at what others have done with flap-based items.
Flaps in the Wind, Er… Wild
There are a few examples of anatomical flap objects represented on the Web, both at Duke and beyond. Common approaches include:
A Sequence of Images. Capture one image of the full item for every state of the flaps possible, then let a user navigate them as if viewing a paginated document or photo sequence.
The third approach is actually what powers Duke’s Four Seasons project, which remains one of the best interactive historical anatomy interfaces available today. Developed way back in 2000 by Educational Media Services, Four Seasons began as a Java program distributed on CD-ROM (gasp!) and in subsequent years found a home as a Flash application embedded on the library website.
Flash has fallen out of favor over the last decade for many reasons, most notably: 1) it won’t work on iOS devices, 2) it’s bad for accessibility, 3) it’s invisible to search engines, and most importantly, 4) most of what Flash used to do exclusively can now be done just as well using HTML5.
Anatomy of a Modern Flap Interface
The Web has made giant leaps forward in the past five years due to advances in HTML, CSS, and Javascript and the evolution of web browsers. Key specs for HTML5 and CSS3 have been supported by all major browsers for several years now. Below are the vital bits (so to speak) in use by the Anatomical Fugitive Sheets. Many of these things would not have worked (or worked well) on the Web five years ago.
HTML5 Parts
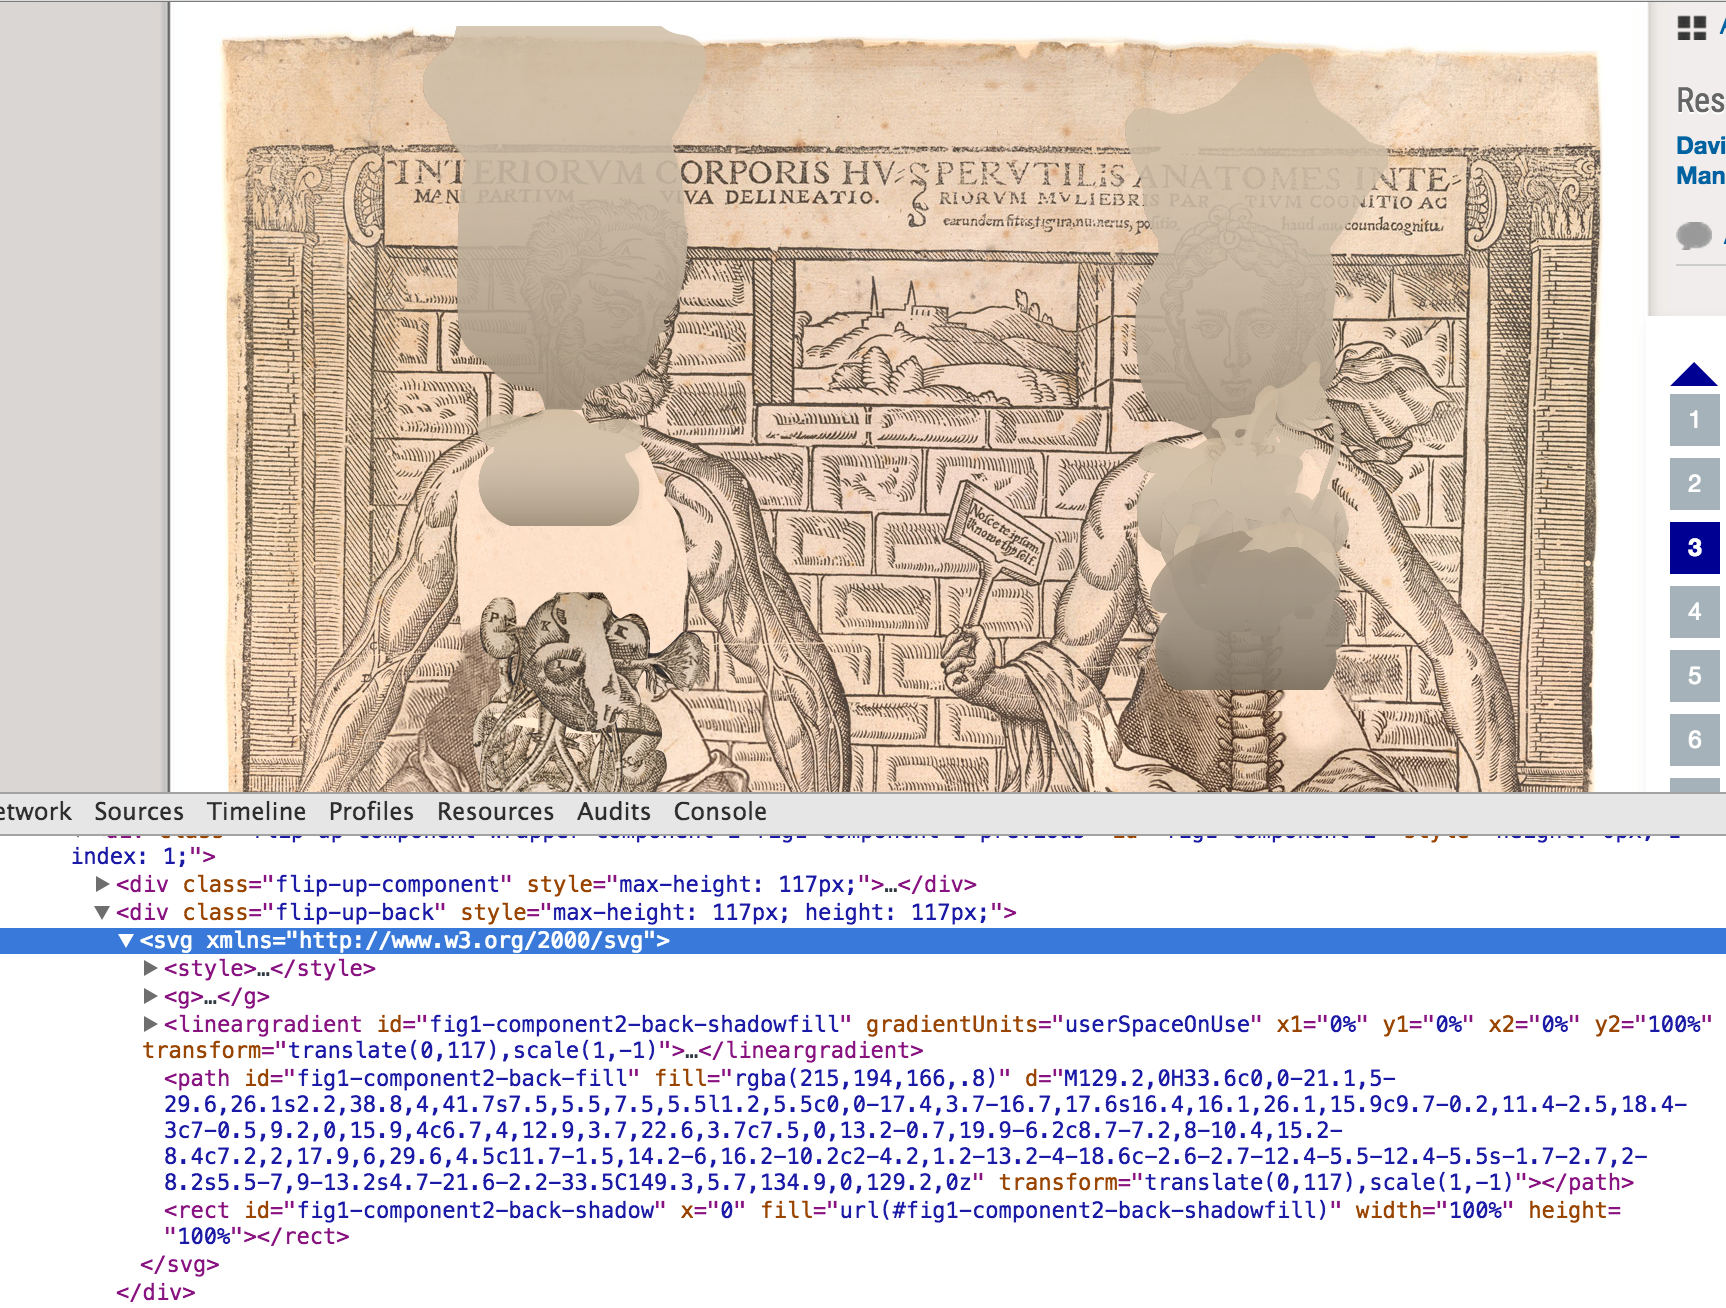
1. SVG (scalable vector graphics). An <svg> element in HTML contains shape data for each flap using a coordinates system. The <path> holds a string with line instructions using shorthand (M, L, c, etc.) for tracing the contour: MoveTo, Lineto, Curveto, Arcto. We duplicate the <path> with a transform attribute to render the shape of the back of the flap.
SVG coordinates in a <path> element representing the back of a flap.
2. Cross-window messaging API. Each fugitive sheet is rendered within an <iframe> on a page and the clickable layer navigation lives in its parent page, so they’re essentially two separate web pages presented as if one. Having a click in one page do something in another is possible through the Javascript method postMessage, part of the HTML5 spec.
From parent page to iframe:frame.contentWindow.postMessage(message, '*');
From iframe to parent page:window.top.postMessage(message, '*');
CSS3 Parts
transition Property. Here’s where the flap animation action happens. The flap elements all have the style declaration transition:1s ease-in-out. That ensures that when a flap property like height changes, it animates over the course of one second, slower at the start and end and quicker in the middle. Clicking to open a flap calls a Javascript function that simultaneously switches the height of the flap front to zero and the back to its full size.
transform Property. This scales down the figure and all its interactive components for display in the iframe, e.g., body.framed .flip-up-wrapper { transform:scale(.5) }; This scaling doesn’t apply in the full-size and zoomed-in views and thus enables the flaps to work identically at full- or half-resolution.
Capture & Encoding
Capture
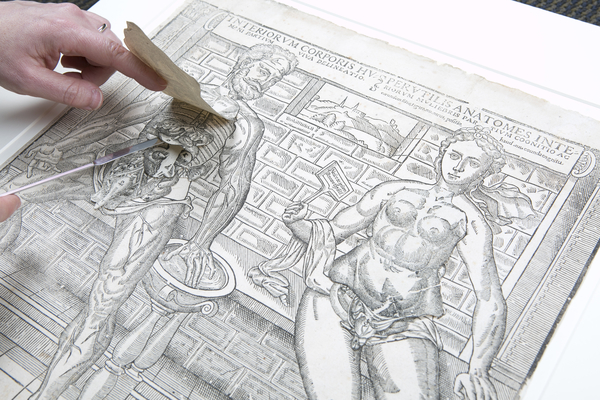
Because the fugitive sheets are large and extremely fragile, our Digital Production Center staff and conservators worked carefully together to untangle and prop open each flap to be photographed separately. It often required two or more people to steady and flatten the flaps while being careful not to cast shadows on the layer being shot. I wasn’t there, but in my mind I imagine a game of library Twister.
Staff captured images using an overhead reproduction camera using white paper below each flap to make it easier to later determine and crop the contours. Unlike most images we digitize, the flaps’ derivative images are stored and delivered in PNG format to preserve transparency.
Encoding
As we do for all digital collections, we encode in an XML document the structural, administrative, and descriptive data about the digital objects using accepted library standards so that 1) the data can be preserved and ported between applications, and 2) we can use it to power our discovery & access interface. We use METS, a flexible Library of Congress standard for describing all kinds of digital objects.
METS worked pretty well for representing the flap data (see example), and we tapped into a few parts of the standard that we’ve never or rarely used for other items. Specifically, we:
added the LC MIX namespace for technical image metadata
used an amdSec to store flap heights & widths
used file/@GROUPID to divide flap images between figure 1, figure 2, etc.
used fptr/area/@COORDS to hold the SVG path coordinates for each flap
The descriptive metadata for the fugitive sheets posed its own challenges outside the box for our usual projects. All the information about the sheets existed as MARC catalog records, and crosswalking from MARC to anything else is more of an art than a science.
Looking Ahead
We’ll try to build on the accomplishments from the Fugitive Sheets Collection as we tackle new complex digitization projects. The History of Medicine Collections in particular are brimming with items that will be far more challenging than these sheets to model, like paginated flap books with fold-out pages and flaps that open in different directions. Undaunted, we’ll keep flapping our wings to stay aloft.
Notes from the Duke University Libraries Digital Projects Team


 Digital Collections Promotional Card