Tag Archives: research

DVS Fall Workshops

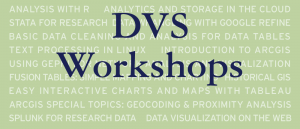
GenericWorkshops-01Data and Visualization Services is happy to announce its Fall 2015 Workshop Series.  With a range of workshops covering basic data skills to data visualization, we have a wide range of courses for different interests and skill levels..  New (and redesigned) workshops include:

  • OpenRefine: Data Mining and Transformations, Text Normalization
  • Historical GIS
  • Advanced Excel for Data Projects
  • Analysis with R
  • Webscraping and Gathering Data from Websites

Workshop descriptions and registration information are available at:

library.duke.edu/data/news


Workshop
 

Date

OpenRefine: Data Mining and Transformations, Text Normalization
Sep 9
Basic Data Cleaning and Analysis for Data Tables
Sep 15
Introduction to ArcGIS
Sep 16
Easy Interactive Charts and Maps with Tableau
Sep 18
Introduction to Stata
Sep 22
Historical GIS
Sep 23
Advanced Excel for Data Projects
Sep 28
Easy Interactive Charts and Maps with Tableau
Sep 29
Analysis with R
Sep 30
ArcGIS Online
Oct 1
Web Scraping and Gathering Data from Websites
Oct 2
Advanced Excel for Data Projects
Oct 6
Basic Data Cleaning and Analysis for Data Tables
Oct 7
Introduction to Stata
Oct 14
Introduction to ArcGIS
Oct 15
OpenRefine: Data Mining and Transformations, Text Normalization
Oct 20
Analysis with R
Oct 20


New Year- New Data and Visualization Lab!

Data and Visualization Services is happy to announce our new Data and Visualization Lab in Duke Libraries new Edge research space.  Located on the first floor of the Bostock Library, the Brandaleone Family Lab for Data and Visualization Services offers a dedicated space for researchers working on data driven projects.

The lab features three distinct areas for supporting data driven research.

Data and Visualization Lab Space

Data and Visualization Lab Computing Zone

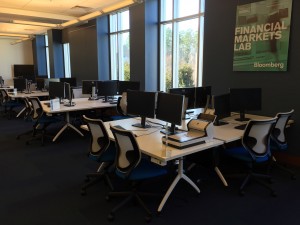
Our lab space features twelve high end workstations with dual monitors with the latest software for data visualization, digital mapping, statistics, and qualitative research.  All of the machines have two dedicated displays to encourage collaborative work and data consultations.  Additionally, all twelve machines have a dedicated power port located conveniently under the edge of the table for powering a laptop or usb powered device.

Bloomberg Professional “Bar”

bloom

Since the launch of our Bloomberg terminals, we have seen a steady increase in both individual and team based usage of Bloomberg financial data.  Our three Bloomberg Professional workstations are now located on a dedicated “bar” across from our lab machines.  The  new Bloomberg zone will facilitate collaborate work and provide a base for groups such as the Duke University Investment Club and Duke Financial Economics Center.

Consult and Collaborative SpaceCollaboration Zone

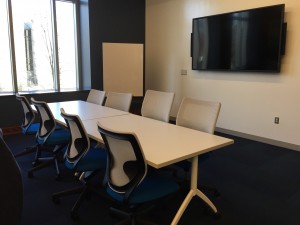
Our third lab space provides a set of four rolling tables for small groups to collaborate or for projects that don’t require a fixed computing space.   An 85″ flat panel display near this zone features data visualizations and other data driven research projects at Duke.

Come See Us!

With ample natural light,  almost 24/7 availability, and a welcoming staff eager to work with you on your next data driven project.  We look forward to working with you in the upcoming year!