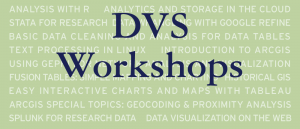
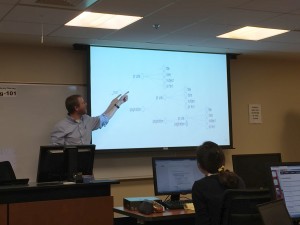
 Data and Visualization Services is happy to announce its Fall 2016 Workshop Series. Learn new ways of enhancing your research with a wide range of data driven research methods, data tools, and data sources.
Can’t attend a session? We record and share most of our workshops online. We are also happy to consult on any of the topics above in person. We look forward to seeing you in the workshops, in the library, or online!
Data Sources
Data Cleaning and Analysis
Regular Expressions (Sep 26)
Data Analysis
Mapping and GIS
Introduction to QGIS (Sep 29)
ArcGIS Online (Oct 17)
Data Visualization
Data Visualization with Excel (Sep 19)
Making Data Visual (Sep 29)
Visualizing Qualitative Data (Oct 19)
Visualizing Basic Survey Data in Tableau – Likert Scales (Nov 10)


