Category Archives: Digital Collections

The Value of Metadata in Digital Collections Projects

Before you let your eyes glaze over at the thought of metadata, let me familiarize you with the term and its invaluable role in the creation of the library’s online Digital Collections.  Yes, metadata is a rather jargony word librarians and archivists find themselves using frequently in the digital age, but it’s not as complex as you may think.  In the most simplistic terms, the Society of American Archivists defines metadata as “data about data.”  Okay, what does that mean?  According to the good ol’ trusty Oxford English Dictionary, it is “data that describes and gives information about other data.”  In other words, if you have a digitized photographic image (data), you will also have words to describe the image (metadata).

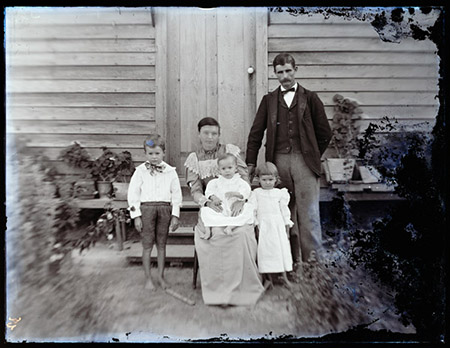
Better yet, think of it this way.  If that image were of a large family gathering and grandma lovingly wrote the date and names of all the people on the backside, that is basic metadata.  Without that information those people and the image would suddenly have less meaning, especially if you have no clue who those faces are in that family photo.  It is the same with digital projects.  Without descriptive metadata, the items we digitize would hold less meaning and prove less valuable for researchers, or at least be less searchable.  The better and more thorough the metadata, the more it promotes discovery in search engines.  (Check out the metadata from this Cornett family photo from the William Gedney collection.)

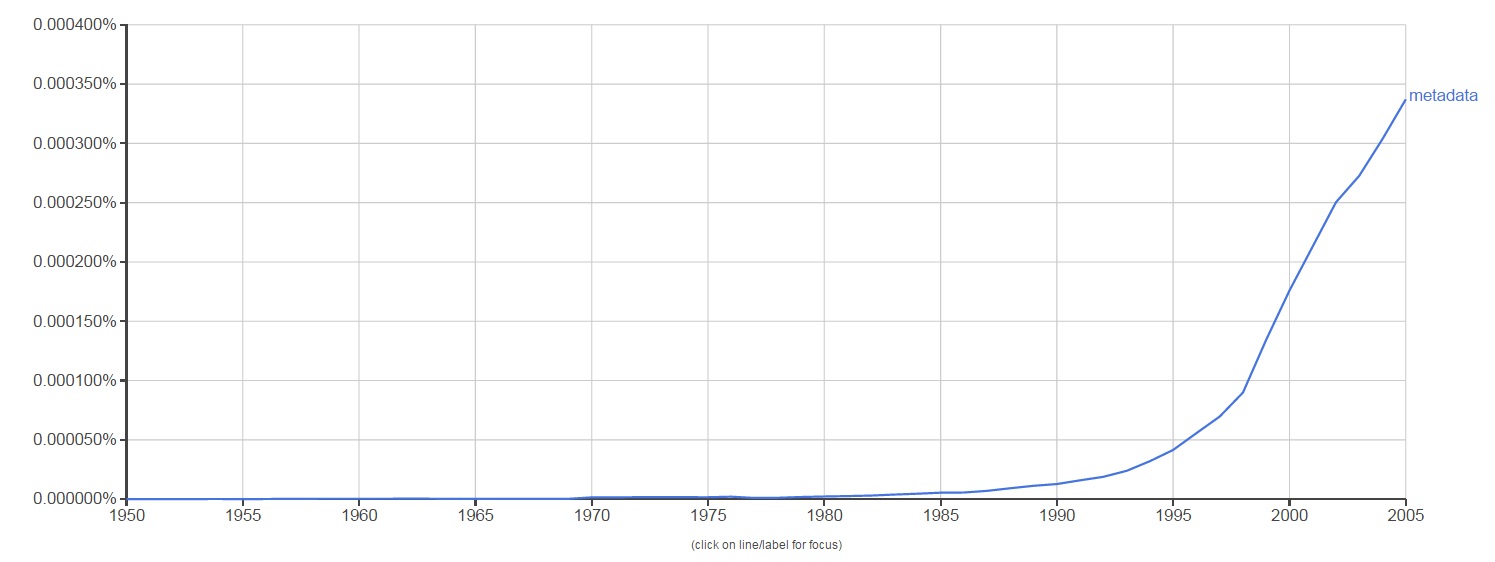
The term metadata was first used in the late 1960s in computer programming language.  With the advent of computing technology and the overabundance of digital data, metadata became a key element to help describe and retrieve information in an automated way.  The use of the word metadata in literature over the last 45 years shows a steeper increase from 1995 to 2005, which makes sense.  The term became used more and more as technology grew more widespread.  This is reflected in the graph below from Google’s Ngram Viewer, which scours over 5 million Google Books to track the usage of words and phrases over time.
metadatangram_blog
Google Ngram Viewer for “metadata”

Because of its link with computer technology, metadata is widely used in a variety of fields that range from computer science to the music industry.  Even your music playlist is full of descriptive metadata that relates to each song, like the artist, album, song title, and length of audio recording.  So, libraries and archives are not alone in their reliance on metadata.  Generating metadata is an invaluable step in the process of preserving and documenting the library’s unique collections.  It is especially important here at the Digital Production Center (DPC) where the digitization of these collections happens.  To better understand exactly how important a role metadata plays in our job, let’s walk through the metadata life cycle of one of our digital projects, the Duke Chapel Recordings.

The Chapel Recordings project consists of digitizing over 1,000 cassette and VHS tapes of sermons and over 1,300 written sermons that were given at the Duke Chapel from the 1950s to 2000s.  These recordings and sermons will be added to the existing Duke Chapel Recordings collection online.  Funded by a grant from the Lilly Foundation, this digital collection will be a great asset to Duke’s Divinity School and those interested in hermeneutics worldwide.

Before the scanners and audio capture devices are even warmed up at the DPC, preliminary metadata is collected from the analog archival material.  Depending on the project, this metadata is created either by an outside collaborator or in-house at the DPC.  For example, the Duke Chronicle metadata is created in-house by pulling data from each issue, like the date, volume, and issue number.  I am currently working on compiling the pre-digitization metadata for the 1950s Chronicle, and the spreadsheet looks like this:

1950sChronicle_blog
1950s Duke Chronicle preliminary metadata

As for the Chapel Recordings project, the DPC received an inventory from the University Archives in the form of an Excel spreadsheet.  This inventory contained the preliminary metadata already generated for the collection, which is also used in Rubenstein Library‘s online collection guide.

inventorymetadata_blog
Chapel Recordings inventory metadata

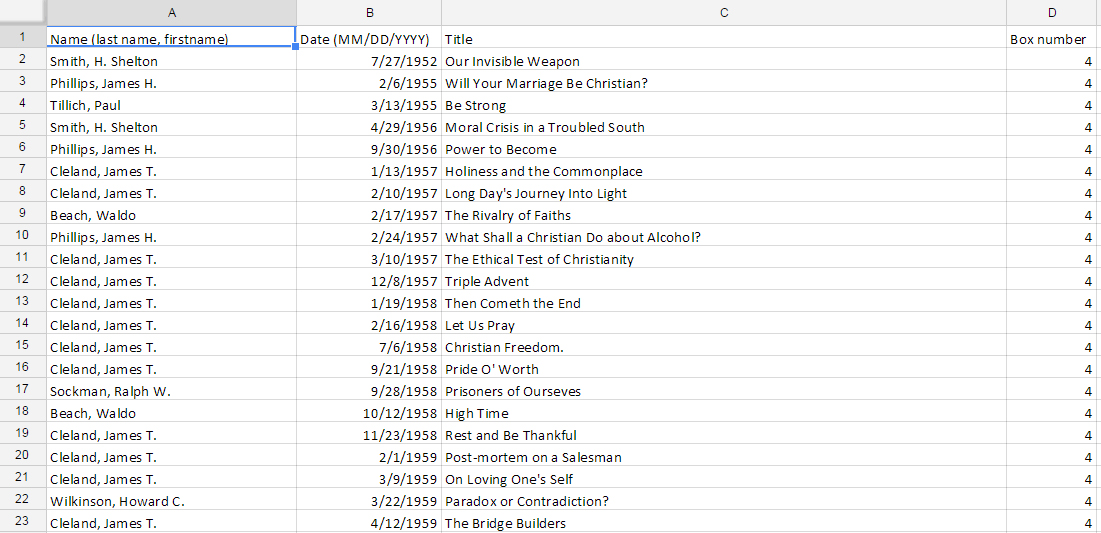
The University Archives also supplied the DPC with an inventory of the sermon transcripts containing basic metadata compiled by a student.
inventorysermons_blog
Duke Chapel Records sermon metadata

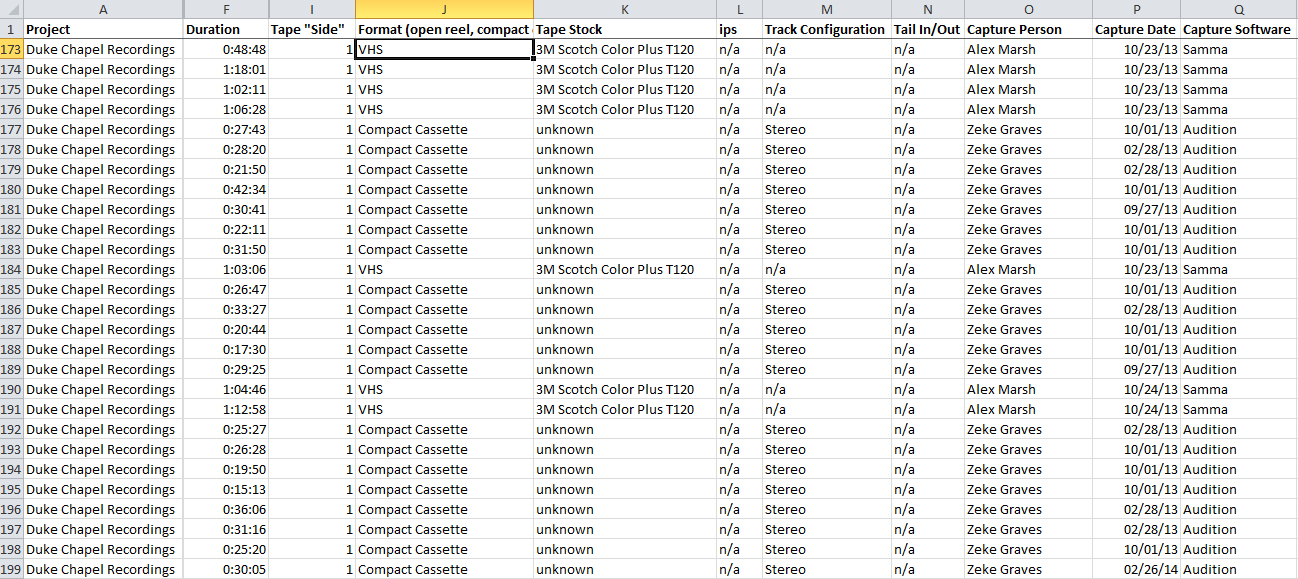
Here at the DPC, we convert this preliminary metadata into a digitization guide, which is a fancy term for yet another Excel spreadsheet.  Each digital project receives its own digitization guide (we like to call them digguides) which keeps all the valuable information for each item in one place.  It acts as a central location for data entry, but also as a reference guide for the digitization process.  Depending on the format of the material being digitized (image, audio, video, etc.), the digitization guide will need different categories.  We then add these new categories as columns in the original inventory spreadsheet and it becomes a working document where we plug in our own metadata generated in the digitization process.   For the Chapel Recordings audio and video, the metadata created looks like this:
digitizationmetadata_blog
Chapel Recordings digitization metadata

Once we have digitized the items, we then run the recordings through several rounds of quality control.  This generates even more metadata which is, again, added to the digitization guide.  As the Chapel Recordings have not gone through quality control yet, here is a look at the quality control data for the 1980s Duke Chronicle:

qcmetadata_blog
1980s Duke Chronicle quality control metadata

Once the digitization and quality control is completed, the DPC then sends the digitization guide filled with metadata to the metadata archivist, Noah Huffman.  Noah then makes further adds, edits, and deletes to match the spreadsheet metadata fields to fields accepted by the management software, CONTENTdm.  During the process of ingesting all the content into the software, CONTENTdm links the digitized items to their corresponding metadata from the Excel spreadsheet.  This is in preparation for placing the material online. For even more metadata adventures, see Noah’s most recent Bitstreams post.

In the final stage of the process, the compiled metadata and digitized items are published online at our Digital Collections website.  You, the researcher, history fanatic, or Sunday browser, see the results of all this work on the page of each digital item online.  This metadata is what makes your search results productive, and if we’ve done our job right, the digitized items will be easily discovered.  The Chapel Recordings metadata looks like this once published online:

onlinemetadata_blog
Chapel Recordings metadata as viewed online

Further down the road, the Duke Divinity School wishes to enhance the current metadata to provide keyword searches within the Chapel Recordings audio and video.  This will allow researchers to jump to specific sections of the recordings and find the exact content they are looking for.  The additional metadata will greatly improve the user experience by making it easier to search within the content of the recordings, and will add value to the digital collection.

On this journey through the metadata life cycle, I hope you have been convinced that metadata is a key element in the digitization process.  From preliminary inventories, to digitization and quality control, to uploading the material online, metadata has a big job to do.  At each step, it forms the link between a digitized item and how we know what that item is.  The life cycle of metadata in our digital projects at the DPC is sometimes long and tiring.  But, each stage of the process  creates and utilizes the metadata in varied and important ways.  Ultimately, all this arduous work pays off when a researcher in our digital collections hits gold.

Getting to the Finish Line: Wrapping Up Digital Collections Projects

Part of my job as Digital Collections Program Manager is to manage our various projects from idea to proposal to implementation and finally to publication. It can be a long and complicated process with many different people taking part along the way.  When we (we being the Digital Collections Implementation Team or DCIT) launch a project online, there are special blog posts, announcements and media attention.  Everyone feels great about a successful project implementation, however as the excitement of the launch subsides the project team is not quite done. The last step in a digital collections project at Duke is the post project review.

Project post-mortems keeps the team from feeling like the men in this image!

Post project reviews are part of project management best practices for effectively closing and assessing the outcomes of projects.  There are a lot of resources for project management available online, but as usual Wikipedia provides a good summary of project post-mortems as well as the different types and phases of project management in general.   Also if you Google “project post-mortem,” you will get more links then you know what to do with.

Process

 As we finish up projects we conduct what we call a “post-mortem,” and it is essentially a post project review.   The name evokes autopsies, and what we do is not dissimilar but thankfully there are no bodies involved (except when we closed up the recent Anatomical Fugitive Sheets digital collection – eh? see what I did there? wink wink).  The goals of our post mortem process are for the project team to do the following:

  • Reflect on the project’s outcomes both positive and negative
  • Document any unique decisions or methods employed during the project
  • Document resources put into the project.

In practice, this means that I ask the project team to send me comments about what they thought went well and what was challenging about the project in question.   Sometimes we meet in person to do this, but often we send comments through email or our project management tool.  I also meet in person with each project champion as a project wraps up.  Project champions are the people that propose and conceive a project.  I ask everyone the same general questions: what worked about the project and what was challenging. With champions, this conversation is also an opportunity to discuss any future plans for promotion as well as think of any related projects that may come up in the future.

DCIT's Post-Mortem Template
DCIT’s Post-Mortem Template

Once I have all the comments from the team and champion I put these into my post-mortem template (see right – click to expand).  I also pull together project stats such as the number of items published, and the hours spent on the project.  Everyone in the core project team is asked to track and submit the hours they spend on projects, which makes pulling stats an easy process.  I designed the template I use as a word document.  Its structured enough to be organized but unstructured enough for me to add new categories on the fly as needed (for example, we worked with a design contractor on a recent project so I added a “working with contractor” section).

 Seems like a simple enough process right?  It is, assuming you can have two ingredients.  First, you need to have a high degree of trust in your core team and good relationships with project stakeholders.  The ability to speak honestly (really really honestly) about a project is a necessity for the information you gather to be useful.  Secondly, you do actually have to conduct the review.  My team gets pulled so quickly from project to project, its really easy to NOT make time for this process.  What helps my team, is that post mortems are a formal part of our project checklists.  Also, I worked with my team to set up our information gathering process, so we all own it and its relevant and easy for them.

DCIT is never to busy for project reviews!

Impacts

The impacts these documents have on our work are very positive. First there is short term benefit just by having the core team communicate what they thought worked and didn’t work. Since we instituted this in the last year, we have used these lessons learns to make small but important changes to our process.

This process also gives the project team direct feedback from our project champions.  This is something I get a lot through my informal interactions with various stakeholders in my role as project manager, however the core team doesn’t always get exposed to direct feedback both positive and negative.

The long term benefit is using the data in these reports to make predictions about resources needed for future projects, track project outcomes at a program level, and for other uses we haven’t considered yet.

Further Resources

 All in all, I cannot recommend a post project review process to anyone and everyone who is managing projects enough.  If you are not convinced by my template (which is very simple), there are lots of examples out there.  Google “project post-mortem templates” (or similar terminology) to see a huge variety.

There are also a few library and digital collections project related resources you may find useful as well:

Here is a blog post from California Digital Library on project post-mortems that was published in 2010, but remains relevant. 

UCLA’s Library recently published a “Library Special Collections Digital Project Toolkit” that includes an “Assessment and Evaluation” section and a “Closeout Questionnaire”


A Look Under the Hood—and the Flaps—of the Anatomical Fugitive Sheets Collection

We have digitized some fairly complex objects over the years that have challenged our Digital Collections team to push the boundaries of typical digital library solutions for digitization and publication. It happens often: objects we want to digitize are sort of like something we’ve done for a previous project, but not quite, so we can’t simply mimic whatever we did before to get the new project done. We’re frequently flexing our creative muscles.  In many cases, our most successful projects ended up that way because we didn’t concede to the temptation of representing items digitally in an oversimplified manner, or, worse still, as something they are not.

Working with so many rare and unique items from the Rubenstein Library through the years, we’ve become unfazed by these representation challenges and time and again have simply pulled together our team’s brainpower (and willpower) to make something work. Dare I say it, we’ve been unflappable. But this year, we met our match and surely needed some help.

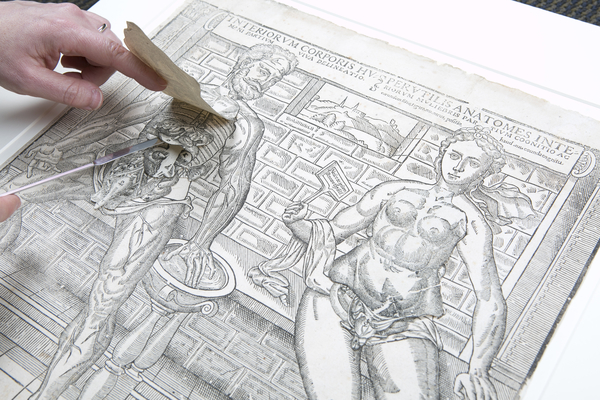
In March, we published ten anatomical fugitive sheets from the 1500s to 1600s. They’re printed illustrations from the Rubenstein Library’s History of Medicine Collections, depicting the human body using layers of paper flaps that can be lifted to reveal internal organs. They’re amazing. They’re distinctive. And they’re really complicated.

Fugitive Sheet
Fugitive Sheet example, accessible online at http://library.duke.edu/digitalcollections/rubenstein_fgsms01003/ (Photo Credit: Les Todd)

The complexity of this project necessitated enlisting help from beyond the library’s walls. Early on, Prof. Mark Olson in Duke’s Art, Art History & Visual Studies department was instrumental in helping us identify modern technical approaches for capturing and modeling such objects. We contracted out development work through local web firm Cuberis, who programmed the bulk of the UI. In-house, we handled digitization, metadata, and integration with our discovery & access application with a lot of collaborative creativity between the digital collections team, the collection curator, conservators, and rare materials cataloger.

In a moment, I’ll discuss what modern technologies make the Fugitive Sheets interface hum. But first, here’s a look at what others have done with flap-based items.

Flaps in the Wind, Er… Wild

There are a few examples of anatomical flap objects represented on the Web, both at Duke and beyond. Common approaches include:

  1. A Sequence of Images. Capture one image of the full item for every state of the flaps possible, then let a user navigate them as if viewing a paginated document or photo sequence.
  2. Video. Either film someone lifting the flaps, or make an auto-playing video of the image sequence above.
  3. Flash. Develop a Flash application and put a SWF file on the web.

The third approach is actually what powers Duke’s Four Seasons project, which remains one of the best interactive historical anatomy interfaces available today. Developed way back in 2000 by Educational Media Services, Four Seasons began as a Java program distributed on CD-ROM (gasp!) and in subsequent years found a home as a Flash application embedded on the library website.

Flash-based flap interface for The Four Seasons, available at http://library.duke.edu/rubenstein/history-of-medicine/four-seasons

Flash has fallen out of favor over the last decade for many reasons, most notably: 1) it won’t work on iOS devices, 2) it’s bad for accessibility, 3) it’s invisible to search engines, and most importantly, 4) most of what Flash used to do exclusively can now be done just as well using HTML5.

Anatomy of a Modern Flap Interface

The Web has made giant leaps forward in the past five years due to advances in HTML, CSS, and Javascript and the evolution of web browsers. Key specs for HTML5 and CSS3 have been supported by all major browsers for several years now.  Below are the vital bits (so to speak) in use by the Anatomical Fugitive Sheets. Many of these things would not have worked (or worked well) on the Web five years ago.

HTML5 Parts

1. SVG (scalable vector graphics). An <svg> element in HTML contains shape data for each flap using a coordinates system. The <path> holds a string with line instructions using shorthand (M, L, c, etc.) for tracing the contour: MoveTo, Lineto, Curveto, Arcto. We duplicate the <path> with a transform attribute to render the shape of the back of the flap.

SVG for flap
SVG coordinates in a <path> element representing the back of a flap.

2. Cross-window messaging API. Each fugitive sheet is rendered within an <iframe> on a page and the clickable layer navigation lives in its parent page, so they’re essentially two separate web pages presented as if one. Having a click in one page do something in another is possible through the Javascript method postMessage, part of the HTML5 spec.

  • From parent page to iframe: frame.contentWindow.postMessage(message, '*');
  • From iframe to parent page: window.top.postMessage(message, '*');

CSS3 Parts

  1. transition Property. Here’s where the flap animation action happens.  The flap elements all have the style declaration transition:1s ease-in-out. That ensures that when a flap property like height changes, it animates over the course of one second, slower at the start and end and quicker in the middle.  Clicking to open a flap calls a Javascript function that simultaneously switches the height of the flap front to zero and the back to its full size.
  2. transform Property. This scales down the figure and all its interactive components for display in the iframe, e.g., body.framed .flip-up-wrapper { transform:scale(.5) }; This scaling doesn’t apply in the full-size and zoomed-in views and thus enables the flaps to work identically at full- or half-resolution.

Capture & Encoding

Capture

Because the fugitive sheets are large and extremely fragile, our Digital Production Center staff and conservators worked carefully together to untangle and prop open each flap to be photographed separately. It often required two or more people to steady and flatten the flaps while being careful not to cast shadows on the layer being shot. I wasn’t there, but in my mind I imagine a game of library Twister.

Staff captured images using an overhead reproduction camera using white paper below each flap to make it easier to later determine and crop the contours. Unlike most images we digitize, the flaps’ derivative images are stored and delivered in PNG format to preserve transparency.

Encoding

As we do for all digital collections, we encode in an XML document the structural, administrative, and descriptive data about the digital objects using accepted library standards so that 1) the data can be preserved and ported between applications, and 2) we can use it to power our discovery & access interface. We use METS, a flexible Library of Congress standard for describing all kinds of digital objects.

METS worked pretty well for representing the flap data (see example), and we tapped into a few parts of the standard that we’ve never or rarely used for other items. Specifically, we:

  • added the LC MIX namespace for technical image metadata
  • used an amdSec to store flap heights & widths
  • used file/@GROUPID to divide flap images between figure 1, figure 2, etc.
  • used fptr/area/@COORDS to hold the SVG path coordinates for each flap

The descriptive metadata for the fugitive sheets posed its own challenges outside the box for our usual projects. All the information about the sheets existed as MARC catalog records, and crosswalking from MARC to anything else is more of an art than a science.

Looking Ahead

We’ll try to build on the accomplishments from the Fugitive Sheets Collection as we tackle new complex digitization projects. The History of Medicine Collections in particular are brimming with items that will be far more challenging than these sheets to model, like paginated flap books with fold-out pages and flaps that open in different directions. Undaunted, we’ll keep flapping our wings to stay aloft.

You’re going to lose: The inherent complexity, and near impossibility, of developing for digital collections


“Nobody likes you. Everybody hates you. You’re going to lose. Smile, you f*#~.”

Joe Hallenbeck, The Last Boy Scout

Screen Shot 2015-04-01 at 12.17.56 PMWhile I’m glad not to be living in a Tony Scott movie, on occasion I feel like Bruce Willis’ character near the beginning of “The Last Boy Scout.” Just look at some of the things they say about us.

Current online interfaces to primary source materials do not fully meet the needs of even experienced researchers. (DeRidder and Matheny)

The criticism, it cuts deep. But at least they were trying to be gentle, unlike this author:

[I]n use, more often than not, digital library users and digital libraries are in an adversarial position. (Saracevic, p. 9)

That’s gonna leave a mark. Still, it’s the little shots they take, the sidelong jabs, that hurt the most:

The anxiety over “missing something” was quite common across interviews, and historians often attributed this to the lack of comprehensive search tools for primary sources. (Rumer and Schonfeld, p. 16)

Screen Shot 2015-04-03 at 10.57.02 AM
Item types in Tripod2.

I’m fond of saying that the youtube developers have it easy. They support one content type – and until recently, it was Flash, for pete’s sake – minimal metadata, and then what? Comments? Links to some other videos? Wow, that’s complicated.

By contrast, we’ve developed for no less than fifteen different item types during the life of Tripod2, the platform that we’ve used to provide discovery and access for Duke Digital Collections since March 2011. You want a challenge? Try building an interface for flippable anatomical fugitive sheets.  It’s one thing to create a feature allowing users to embed videos from a flat web-site structure; it’s quite another to allow it from a site loaded with heterogeneous content types, then extend it to include items nested within multiple levels of description in finding aids (for an example, see the “Southwest Georgia Voters Project” item here).

I think the problem set of developing tools for digitized primary sources is one of the most interesting areas in the field of librarianship, and for the digital collections team, it’s one of our favorite areas of work. However, the quotes that open this post (the ones not delivered by Bruce Willis, anyway) are part of a literature that finds significant disparity between the needs of the researchers who form our primary audience and the tools that we – collectively speaking, in the field of digital libraries – have built.

Our team has just begun work on our next-generation platform for digital collections, which we call Tripod3. It will be built on the Fedora/Hydra framework that our Digital Repository Services team is using to develop the Duke Digital Repository. As the project manager, I’m trying to catch up on the recent literature of assessment for digital collections, and consider how we can improve on what we’ve done in the past. It’s one of the main ways  we can engage with researchers, as I wrote about in a previous post.

One of the issues we need to address is the problem of archival context. It’s something that the users of digitized primary sources cite again and again in the studies I’ve read. It manifests itself in a few ways, and could be the subject of a lengthier piece, but I think Chassanoff gives a good sense of it in her study (pp. 470-1):

Overall, findings suggest that historians seem to feel most comfortable using digitized sources when an online environment replicates essential attributes found in archives. Materials should be obtained from a reputable repository, and the online finding aid should provide detailed description. Historians want to be able to access the entire collection online and obtain any needed information about an item’s provenance. Indeed, the possibility that certain materials are omitted from an online collection appears to be more of a concern than it is in person at an archives.

The idea of archival context poses what I think is the central design problem of digital collections. It’s a particular challenge because, while it’s clear that researchers want and require the ability to see an object in its archival context, they also don’t want it. By which I mean, they also want to be able to find everything in the same flat context that everything assumes with a retrieval service like Google.

Archival context implies hierarchy, using the arrangement of the physical materials to order the digital. We were supposed to have broken away from the tyranny of physical arrangement years ago. David Weinberger’s Everything is Miscellaneous trumpeted this change in 2007, and while we had already internalized what he called the “third order of order” by then, it is the unambiguous way of the world now.

With our Tripod2 platform, we built both a shallow “digital collections miscellany” interface at http://library.duke.edu/digitalcollections/, but later started embedding items directly in finding aids.  Examples of the latter include the Jazz Loft Project Records and the Alexander Stephens Papers. What we never did was integrate these two modes of publication for digitized primary sources. Items from finding aids do not appear in search results for the main digital collections site, and items on the main site do not generally link back to the finding aid for their parent collection, and not to the series in which they’re arranged.

While I might give us a passing grade for the subject of “Providing archival context,” it wouldn’t be high enough to get us into, say, Duke. I expect this problem to be at the center of our work on the next-generation platform.


Sources


Alexandra Chassanoff, “Historians and the Use of Primary Materials in the Digital Age,” The American Archivist 76, no. 2, 458-480.

Jody L. DeRidder and Kathryn G. Matheny, “What Do Researchers Need? Feedback On Use of Online Primary Source Materials,” D-Lib Magazine 20, no. 7/8, available at http://www.dlib.org/dlib/july14/deridder/07deridder.html

Jennifer Rumer and Roger C. Schonfeld, “Supporting the Changing Research Practices of Historians: Final Report from ITHAKA S+R,” (2012), http://www.sr.ithaka.org/sites/default/files /reports/supporting-the-changing-research-practices-of-historians.pdf.

Tefko Saracevic, “How Were Digital Libraries Evaluated?”, paper first presented at the DELOS WP7 Workshop on the Evaluation of Digital Libraries (2004), available at http://www.scils.rutgers. edu/~tefko/DL_evaluation_LIDA.pdf

Man to Fight Computers!

1965 Engineers Show Image_DukEngineer
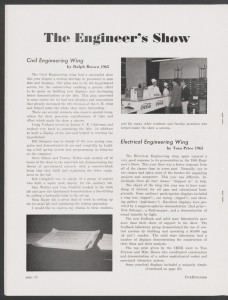
Duke Engineers Show in March 1965, DukEngineers

Fifty years ago this week, Duke students faced off with computers in model car races and tic-tac-toe matches in the annual Engineers’ Show.  In stark contrast to the up-and-coming computers, a Duke Chronicle article dubbed these human competitors as old-fashioned and obsolete.  Five decades later, although we humans haven’t completely lost our foothold to computers, they have become a much bigger part of our daily lives than in 1965.  Yes, there are those of you out there who fear the imminent robot coup is near, but we mostly have found a way to live alongside this technology we have created.  Perhaps we could call it a peaceful coexistence.


Zeutschel Image
Zeutschel Overhead Scanner

At least, that’s how I would describe our relationship to technology here at the Digital Production Center (DPC) where I began my internship six weeks ago.  We may not have the entertaining gadgets of the Engineers’ Show, like a mechanical swimming shark or mechanical monkey climbing a pole, but we do have exciting high-tech scanners like the Zeutschel, which made such instant internet access to articles like “Man To Fight Computers” possible.  The university’s student newspaper has been digitized from fall 1959 to spring 1970, and it is an ongoing project here at the DPC to digitize the rest of the collection spanning from 1905 to 1989.


My first scanning project has been the 1970s Duke Chronicle issues.  While standing at the Zeutschel as it works its digitization magic, it is fascinating to read the news headlines and learn university history through pages written by and for the student population.  The Duke Chronicle has been covering campus activities since 1905 when Duke was still Trinity College.  Over the years it has captured the evolution of student life as well as the world beyond East and West Campus.  The Chronicle is like a time capsule in its own right, each issue freezing and preserving moments in time for future generations to enjoy.  This is a wonderful resource for researchers, history nerds (like me!), and Duke enthusiasts alike, and I invite you to explore the digitized collection to see what interesting articles you may find.  And don’t forget to keep checking back with BitStreams to hear about the latest access to other decades of the Duke Chronicle.


1965 Engineers Show_DukEngineer
DukEngineer, The College of Engineering magazine, covered this particular Engineers’ Show in their April 1965 issue.

The year 1965 doesn’t seem that distant in time, yet in terms of technological advancement it might as well be eons away from where we are now.  Playing tic-tac-toe against a computer seems arcane compared to today’s game consoles and online gaming communities, but it does put things into perspective.  Since that March day in 1965, it is my hope that man and computer both have put down their boxing gloves.

Taken near doorways

We’re continually walking through doorways or passing them by, but how often do we linger to witness the life that unfolds nearby? Let the photographs below be your doorway, connecting you with lives lived in other places and times.

Man holding small boy in the air while a woman looks on from doorway.
Man holding small boy in the air while a woman looks on from doorway, from William Gedney Photographs and Writings

Man in doorway. Woman walking down sidewalk
New York City: Greenwich Village, from Ronald Reis Photographs

Man sitting on chair holding a small child.
Man sitting on chair holding a small child, from William Gedney Photographs and Writings

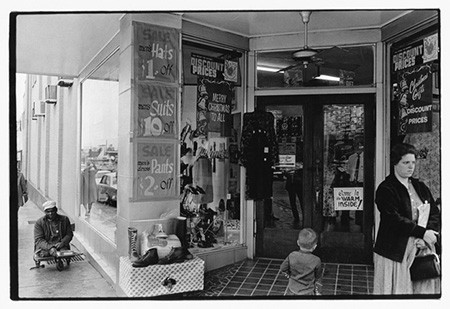
Woman, boy and man near entrance to store.
Outside entrance to Wynn’s Department Store, 1968 Dec., from Paul Kwilecki Photographs

Woman with cat in doorway
Woman with cat in doorway, Pear Orchard, 1961, from Paul Kwilecki Photographs

family portrait taken in front of doorway.
N479, from Hugh Mangum Photographs

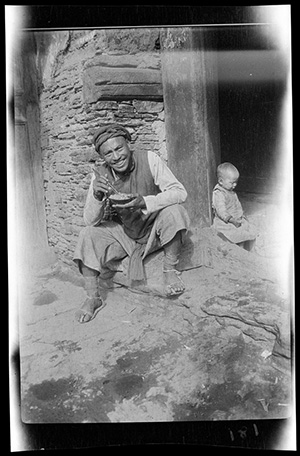
Man eating, with child in background
Man Eating, with Child in Background, from Sidney D. Gamble Photographs

Be adventurous. Explore more images taken by these photographers as displayed within Duke University Libraries’ digitized collections.

Indiana Jones and The Greek Manuscripts

One of my favorite movies as a youngster was Steven Spielberg’s “Raiders of the Lost Ark.” It’s non-stop action as the adventurous Indiana Jones criss-crosses the globe in an exciting yet dangerous race against the Nazis for possession of the Ark of the Covenant. According to the Book of Exodus, the Ark is a golden chest which contains the original stone tablets on which the Ten Commandments are inscribed, the moral foundation for both Judiasm and Christianity. The Ark is so powerful that it single-handedly destroys the Nazis and then turns Steven Spielberg and Harrison Ford into billionaires. Countless sequels, TV shows, theme-park rides and merchandise follow.

emsgk010940010
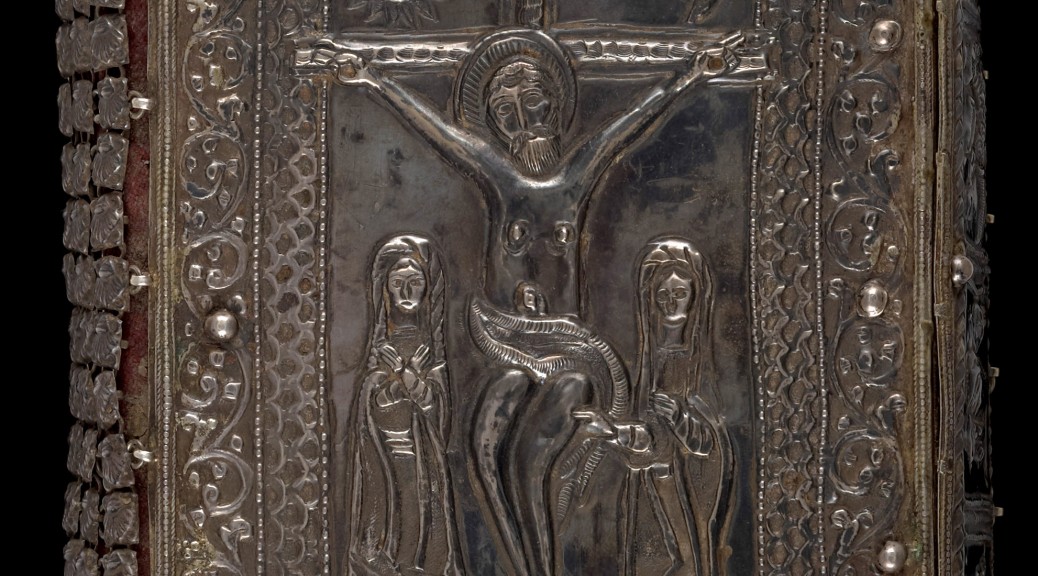
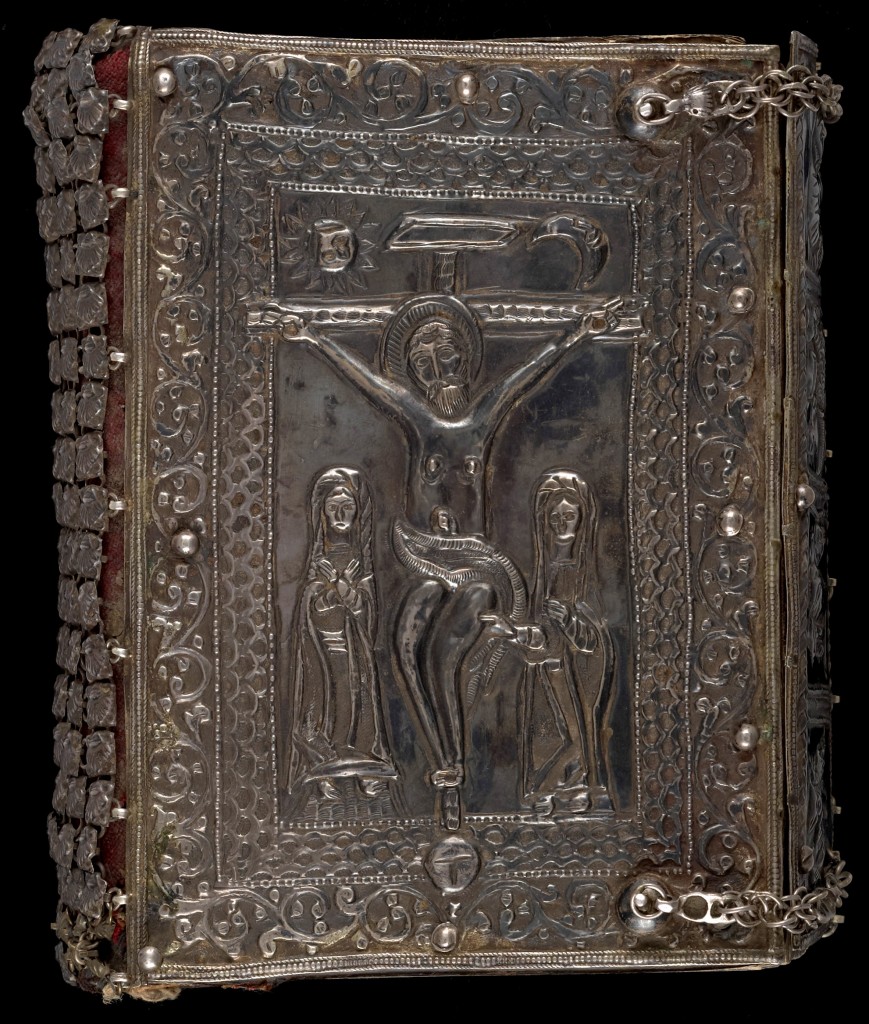
Greek manuscript 94, binding consists of heavily decorated repoussé silver over leather.

Fast-forward several decades, and I am asked to digitize Duke Libraries’ Kenneth Willis Clark Collection of Greek Manuscripts. Although not quite as old as the Ten Commandments, this is an amazing collection of biblical texts dating all the way back to the 9th century. These are weighty volumes, hand-written using ancient inks, often on animal-skin parchment. The bindings are characterized as Byzantine, and often covered in leathers like goatskin, sometimes with additional metal ornamentation. Although I have not had to run from giant boulders, or navigate a pit of snakes, I do feel a bit like Indiana Jones when holding one of these rare, ancient texts in my hands. I’m sure one of these books must house a secret code that can bestow fame and fortune, in addition to the obvious eternal salvation.

Before digitization, Senior Conservator Erin Hammeke evaluates the condition of each Greek manuscript, and rules out any that are deemed too fragile to digitize. Some are considered sturdy enough, but still need repairs, so Erin makes the necessary fixes. Once a manuscript is given the green light for digitization, I carefully place it in our book cradle so that it cannot be opened beyond a 90-degree angle. This helps protect our fragile bound materials from unnecessary stress on the binding. Next, the aperture, exposure, and focus are carefully adjusted on our Phase One P65+ digital camera so that the numerical values of our X-rite color calibration target, placed on top of the manuscript, match the numerical readings shown on our calibrated monitors.

cradle
Greek manuscript 101, with X-Rite color calibration target, secured in book cradle.

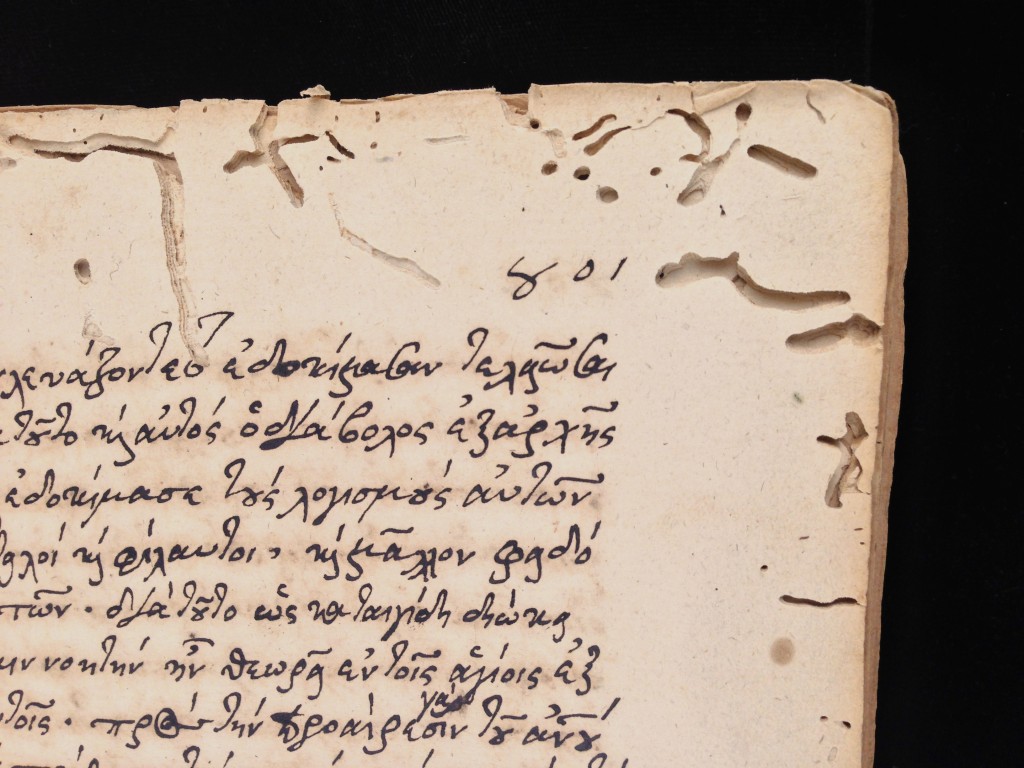
As the photography begins, each page of the manuscript is carefully turned by hand, so that a new image can be made of the following page. This is a tedious process, but requires careful concentration so the pages are consistently captured throughout each volume. Right-hand (recto) pages are captured first, in succession. Then the volume is turned over, so that the left-hand (verso) pages can be captured. I can’t read Greek, but it’s fascinating to see the beauty of the calligraphy, and view the occasional illustrations that appear on some pages. Sometimes, I discover that moths, beetles or termites have bored through the pages over time. It’s interesting to speculate as to which century this invasive destruction may have occurred. Perhaps the Nazis from the Indiana Jones movies traveled back in time, and placed the insects there?

worm2
Greek manuscript 101, showing insect damage.

Once the photography is complete, the recto and verso images are processed and then interleaved to recreate the left-right page order of the original manuscript. Next, the images go through a quality-control process in which any extraneous background area is cropped out, and each page is checked for clarity and consistent color and illumination. After that, another round of quality control insures that no pages are missing, or out of order. Finally, the images are converted to Pyramid TIFF files, which allow our web site users to zoom out and see all the pages at once, or zoom in to see maximum detail of any selected page. 38 Greek manuscripts are ready for online viewing now, and many more are coming soon. Stay tuned for the exciting sequel: “Indiana Jones and Even More Greek Manuscripts.”

On Tour with H. Lee Waters: Visualizing a Logbook with TimeMapper

The H. Lee Waters Film Collection we published earlier this month has generated quite a buzz. In the last few weeks, we’ve seen a tremendous uptick in visits to Duke Digital Collections and received comments, mail, and phone calls from Waters fans, film buffs, and from residents of the small towns he visited and filmed over 70 years ago. It’s clear that Waters’ “Movies of Local People” have wide appeal.

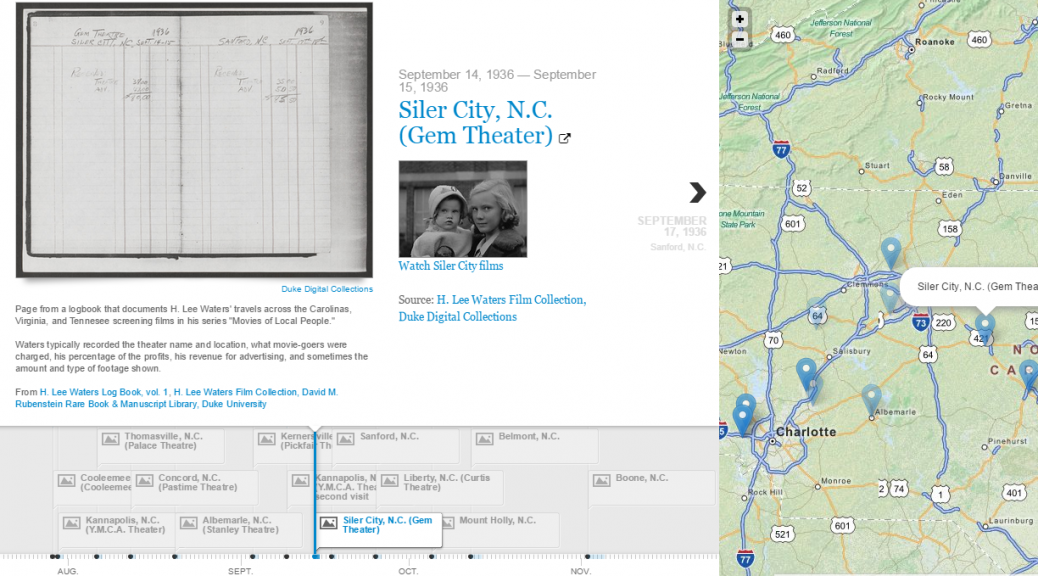
The 92 films in the collection are clearly the highlight, but as an archivist and metadata librarian I’m just as fascinated by the logbooks Waters kept as he toured across the Carolinas, Virginia, and Tennessee screening his films in small town theaters between 1936 and 1942. In the logbooks, Waters typically recorded the theater name and location where he screened each film, what movie-goers were charged, his percentage of the profits, his revenue from advertising, and sometimes the amount and type of footage shown.

As images in the digital collection, the logbooks aren’t that interesting (at least visually), but the data they contain tell a compelling story. To bring the logbooks to life, I decided to give structure to some of the data (yes, a spreadsheet) and used a new visualization tool I recently discovered called TimeMapper to plot Waters’ itinerary on a synchronized timeline and map–call it a timemap! You can interact with the embedded timemap below, or see a full-screen version here. Currently, the Waters timemap only includes data from the first 15 pages of the logbook (more to come!). Already, though, we can start to visualize Waters’ route and the frequency of film screenings.  We can also interact with the digital collection in new ways:

  • Click on a town in the map view to see when Waters’ visited and then view the logbook entry or any available films for that town.
  • Slide the timeline and click through the entries to trace Waters’ route
  • Toggle forward or backwards through the logbook entries to travel along with Waters

For me, the Waters timemap demonstrates the potential for making use of the data in our collections, not just the digitized images or artifacts. With so many simple and freely available tools like TimeMapper and Google Fusion Tables (see my previous post), it has never been so easy to create interactive visualizations quickly and with limited technical skills.

I’d love to see someone explore the financial data in Waters’ logbooks to see what we might learn about his accounting practices or even about the economic conditions in each town. The logbook data has the potential to support any number of research questions. So start your own spreadsheet and have at it!

[Thanks to the folks at Open Knowledge Labs for developing TimeMapper]

When it Rains, It Pours: A Digital Collections News Round Up

2015 has been a banner year for Duke Digital Collections, and its only January! We have already published a new collection, broken records and expanded our audience. Truth be told, we have been on quite a roll for the last several months, and with the holidays we haven’t had a chance to share every new digital collection with you. Today on Bitstreams, we highlight digital collection news that didn’t quite make the headlines in the past few months.

H. Lee Watersmania

waterschart
Compare normal Digital Collections traffic to our Waters spike on Monday January 19th.

Before touching on news you haven’t about, we must continue the H. Lee Waters PR Blitz. Last week, we launched the H. Lee Waters digital collection. We and the Rubenstein Library knew there was a fair amount of pent-up demand for this collection, however we have been amazed by the reaction of the public. Within a few days of launch, site visits hit what we believe (though cannot say with 100% certainty) to be an all time high of 17,000 visits and 37,000 pageviews on Jan 19.  We even suspect that the intensity of the traffic has contributed to some recent server performance issues (apologies if you have had trouble viewing the films – we and campus IT are working on it).

We have also seen more than 20 new user comments left on Water’s films pages, 6 comments left on the launch blog post, and 40+ new likes on the Duke Digital Collections Facebook page since last week. The Rubenstein Library has also received a surge of inquiries about the collection. These may not be “official” stats, but we have never seen this much direct public reaction to one of our new digital collections, and we could not be more excited about it.

Early Greek Manuscripts

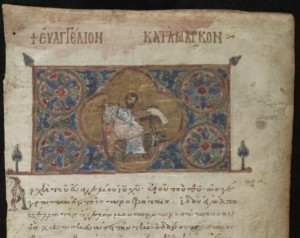
An example from the early Greek Manuscript collection.

In November we quietly made 38 early Greek manuscripts available online, one of which is the digital copy of a manuscript since returned to the Greek government.  These beautiful volumes are part of the Rubenstein Library and date from the 9th – 17th centuries.   We are still digitizing volumes from this collection, and hope to publish more in the late Spring.  At that time we will make some changes to the look and feel of the digital collection.  Our goal will be to further expose the general public to the beauty of these volumes while also increasing discoverability to multiple scholarly communities.


Link Media Wall Exhibit

In early January, the libraries Digital Exhibits Working Group premiered their West Campus Construction Link media wall exhibit, affectionately nicknamed the Game of Stones.   The exhibit features content from the Construction of Duke University digital collection and the Duke University Archives’ Flickr sets.   The creation of this exhibit has been described previously on Bitstreams (here and here).  Head on down to the link and see it for yourself!campus_constr


History of Medicine Artifacts

Medicine bottles and glasses from the HOM artifacts collection.

Curious about bone saws, blood letting or other historic medical instruments? Look no further than the Rubenstein Libraries History of Medicine Artifact’s Collection Guide.   In December we published over 300 images of historic medical artifacts embedded in the collection guide.  Its an incredible and sometimes frightening treasure trove of images.

These are legacy images taken  by the History of Medicine.  While we didn’t shoot these items in the Digital Production Center, the digital collections team still took a hands on approach to normalizing the filenames and overall structure of the image set so we could publish them.  This project was part of our larger efforts to make more media types embeddable in Rubenstein collection guides, a deceptively difficult process that will likely be covered more in depth in a future Bitstreams post.

Digitization to Support the Student Nonviolent Coordinating Committee (SNCC) Legacy Project Partnership

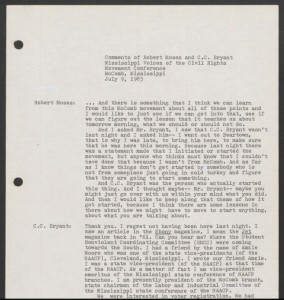
Transcript from an oral history in the Joseph Sinsheimer papers.

In the last year, Duke University Libraries has been partnering with the SNCC Legacy Project and the Center for Documentary Studies on One Person One Vote: The Legacy of SNCC and the Fight for Voting Rights.  As part of the project, the digital collections team has digitized several collections related to SNCC and made content available from each collections’ collection guide.  The collections include audio recordings, moving images and still images.  Selections from the digitized content will soon be made available on the One Person One Vote site to be launched in March 2015.  In the meantime, you can visit the collections directly:  Joseph Sinsheimer PapersFaith Holsaert Papers, and SNCC 40th Anniversary Conference.


Coach 1K

Coach K’s first Duke win against Stetson.

This one is hot off the digital presses.  Digital Collections partnered with University Archives to publish Coach K’s very first win at Duke just this week in anticipation of victory # 1000.

What’s Next for Duke Digital Collections?

The short answer is, a lot!  We have very ambitious plans for 2015.  We will be developing the next version of our digital collections platform, hiring an intern (thank you University Archives), restarting digitization of the Gedney collection, and of course publishing more of your favorite digital collections.   Stay tuned!

Embeds, Math & Beyond

This week, in conjunction with our H. Lee Waters Film Collection unveiling, we rolled out a handy new Embed feature for digital collections items.  The idea is to make it as easy as possible for someone to share their discoveries from our collections, with proper attribution, on other websites or blogs.

How To

It’s simple, really, and mimics the experience you’re likely to encounter getting embed code from other popular sites with videos, images, and the like. We modeled our approach loosely on the Internet Archive‘s video embed service (e.g., visit this video and click the Share icon, but only if you are unafraid of clowns).

Embed Link

Click the “Embed” link under an item from Duke Digital Collections, and copy the snippet of code that pops up. Paste it in your website, and you’re done!

Examples

I’ll paste a few examples below using different kinds of items. The embed code is short and nearly identical for all of these:

A Single Image

Paginated Item

A Video

Single-Track Audio

Multi-Track Audio

Document with Document Viewer

Technical Considerations

Building this feature required a little bit of math, some trial & error, and a few tricks. The steps were to:

  • Set up a service to return customized item pages at the path http://library.duke.edu/digitalcollections/embed/<itemid>/
  • Use CSS & JS to make the media as fluid as possible to fill whatever space it ends up in
  • Use a fixed height and overflow: auto on the attribution box so longer content will scroll
  • Use link rel=”canonical” to ensure the item’s embed page is associated with the real item page (especially to improve links / ranking signals for search engines).
  • Present the user a copyable HTML <iframe> element in the regular item page that has the correct height & width attributes to accommodate the item(s) to be embedded

This last point is where the math comes in. Take a single image item, for example. With a landscape-orientation image we need to give the user a different <iframe> height to copy than we would for a portrait. It gets even more complicated when we have to account for multiple tracks of audio or video, or combinations of the two.

Coming Soon

We’ll refine this feature a bit in the coming weeks, and work out any embed-bugs we discover. We’ll also be developing a similar feature for embedding digitized content found in our archival collection guides.