
The H. Lee Waters Film Collection we published earlier this month has generated quite a buzz. In the last few weeks, we’ve seen a tremendous uptick in visits to Duke Digital Collections and received comments, mail, and phone calls from Waters fans, film buffs, and from residents of the small towns he visited and filmed over 70 years ago. It’s clear that Waters’ “Movies of Local People” have wide appeal.
The 92 films in the collection are clearly the highlight, but as an archivist and metadata librarian I’m just as fascinated by the logbooks Waters kept as he toured across the Carolinas, Virginia, and Tennessee screening his films in small town theaters between 1936 and 1942. In the logbooks, Waters typically recorded the theater name and location where he screened each film, what movie-goers were charged, his percentage of the profits, his revenue from advertising, and sometimes the amount and type of footage shown.
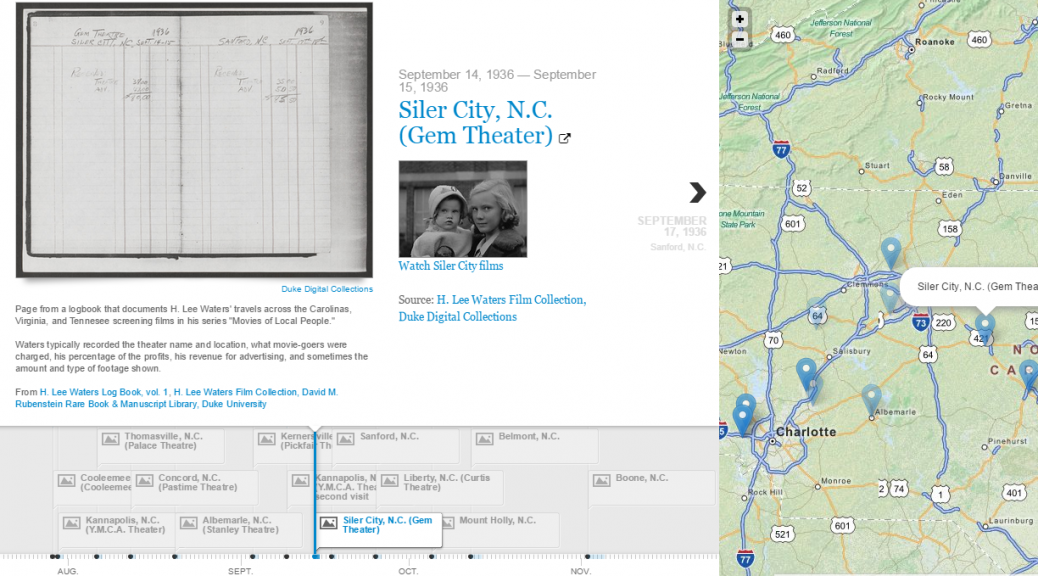
As images in the digital collection, the logbooks aren’t that interesting (at least visually), but the data they contain tell a compelling story. To bring the logbooks to life, I decided to give structure to some of the data (yes, a spreadsheet) and used a new visualization tool I recently discovered called TimeMapper to plot Waters’ itinerary on a synchronized timeline and map–call it a timemap! You can interact with the embedded timemap below, or see a full-screen version here. Currently, the Waters timemap only includes data from the first 15 pages of the logbook (more to come!). Already, though, we can start to visualize Waters’ route and the frequency of film screenings. We can also interact with the digital collection in new ways:
- Click on a town in the map view to see when Waters’ visited and then view the logbook entry or any available films for that town.
- Slide the timeline and click through the entries to trace Waters’ route
- Toggle forward or backwards through the logbook entries to travel along with Waters
For me, the Waters timemap demonstrates the potential for making use of the data in our collections, not just the digitized images or artifacts. With so many simple and freely available tools like TimeMapper and Google Fusion Tables (see my previous post), it has never been so easy to create interactive visualizations quickly and with limited technical skills.
I’d love to see someone explore the financial data in Waters’ logbooks to see what we might learn about his accounting practices or even about the economic conditions in each town. The logbook data has the potential to support any number of research questions. So start your own spreadsheet and have at it!
[Thanks to the folks at Open Knowledge Labs for developing TimeMapper]