Category Archives: finance

2020 RStudio Conference Livestream Coming to Duke Libraries

RStudio 2020 Conference LogoInterested in attending the 2020 RStudio Conference, but unable to travel to San Francisco? With the generous support of RStudio and the Department of Statistical Science, Duke Libraries will host a livestream of the annual RStudio conference starting on Wednesday, January 29th at 11AM. See the latest in machine learning, data science, data visualization, and R. Registration links and information about sessions follow. Registration is required for the first session and keynote presentations.  Please see the links in the agenda that follows.

Wednesday, January 29th

Location: Rubenstein Library 249 – Carpenter Conference Room

11:00 – 12:00 RStudio Welcome – Special Live Opening Interactive Event for Watch Party Groups
12:00 – 1:00 Welcome for Hadley Wickham and Opening Keynote – Open Source Software for Data Science (JJ Allaire)
1:00 – 2:00 Data, visualization, and designing with AI (Fernanda Viegas and Martin Wattenberg, Google)
2:30 – 4:00 Education Track (registration is not required)
Meet you where you R – Lauren Chadwick, R Studio.
Data Science Education in 2022 (Karl Howe and Greg Wilson, R Studio)
Data science education as an economic and public health intervention in East Baltimore (Jeff Leek, Johns Hopkins)
Of Teacups, Giraffes, & R Markdown (Desiree Deleon, Emory)

Location: Edge Workshop Room – Bostock 127

5:15 – 6:45 All About Shiny  (registration is not required)
Production-grade Shiny Apps with golem (Colin Fay, ThinkR)
Making the Shiny Contest (Duke’s own Mine Cetinkaya-Rundel)
Styling Shiny Apps with Sass and Bootstrap 4(Joe Cheng, RStudio)
Reproducible Shiny Apps with shinymeta (Carson Stewart, RStudio)
7:00 – 8:30 Learning and Using R (registration is not required)
Learning and using R: Flipbooks (Evangeline Reynolds, U Denver)
Learning R with Humorous Side Projects (Ryan Timpe, Lego Group)
Toward a grammar of psychological Experiments (Danielle, Navaro, University of New South Wales)
R for Graphical Clinical Trial Reporting(Frank Harrell, Vanderbilt)

Thursday, January 30th

Location: Edge Workshop Room – Bostock 127

12:00 – 1:00 Keynote: Object of type closure is not subsettable (Jenny Bryan, RStudio)
1:23 – 3:00 Data Visualization Track (registration is not required)
The Glamour of Graphics (William Chase, University of Pennsylvania)
3D ggplots with rayshader (Dr. Tyler Morgan-Wall, Institute for Defense Analyses)
Designing Effective Visualizations (Miriah Meyer, University of Utah)
Tidyverse 2019-2020 (Hadley Wickham, RStudio)
3:00 – 4:00 Livestream of Rstudio Conference Sessions (registration is not required)
4:00 – 5:30 Data Visualization Track 2 (registration is not required)
Spruce up your ggplot2 visualizations with formatted text (Claus Wilke, UT Austin)
The little package that could: taking visualizations to the next level with the scales package (Dana Seidel, Plenty Unlimited)
Extending your ability to extend ggplot2 (Thomas Lin Pedersen, RStudio)
5:45 – 6:30 Career Advice for Data Scientists Panel Discussion (registration is not required)
7:00 – 8:00 Keynote: NSSD Episode 100 (Hillary Parker, Stitchfix and Roger Peng, JHU)

Minding Your Business: Locating Company and Industry Data

The Data and Visualization Services (DVS) Department can help you locate and extract many types of data, including data about companies and industries.  These may include data on firm location, aggregated data on the general business climate and conditions, or specific company financials.  In addition to some freely available resources, Duke subscribes to a host of databases providing business data.

Directories of Business Locations

You may need to identify local outlets and single-location companies that sell a particular product or provide a particular service.  You may also need information on small businesses (e.g., sole proprietorships) and private companies, not just publicly traded corporations or contact information for a company’s headquarters.  A couple of good sources for such local data are the ReferenceUSA Businesses Database and SimplyAnalytics.

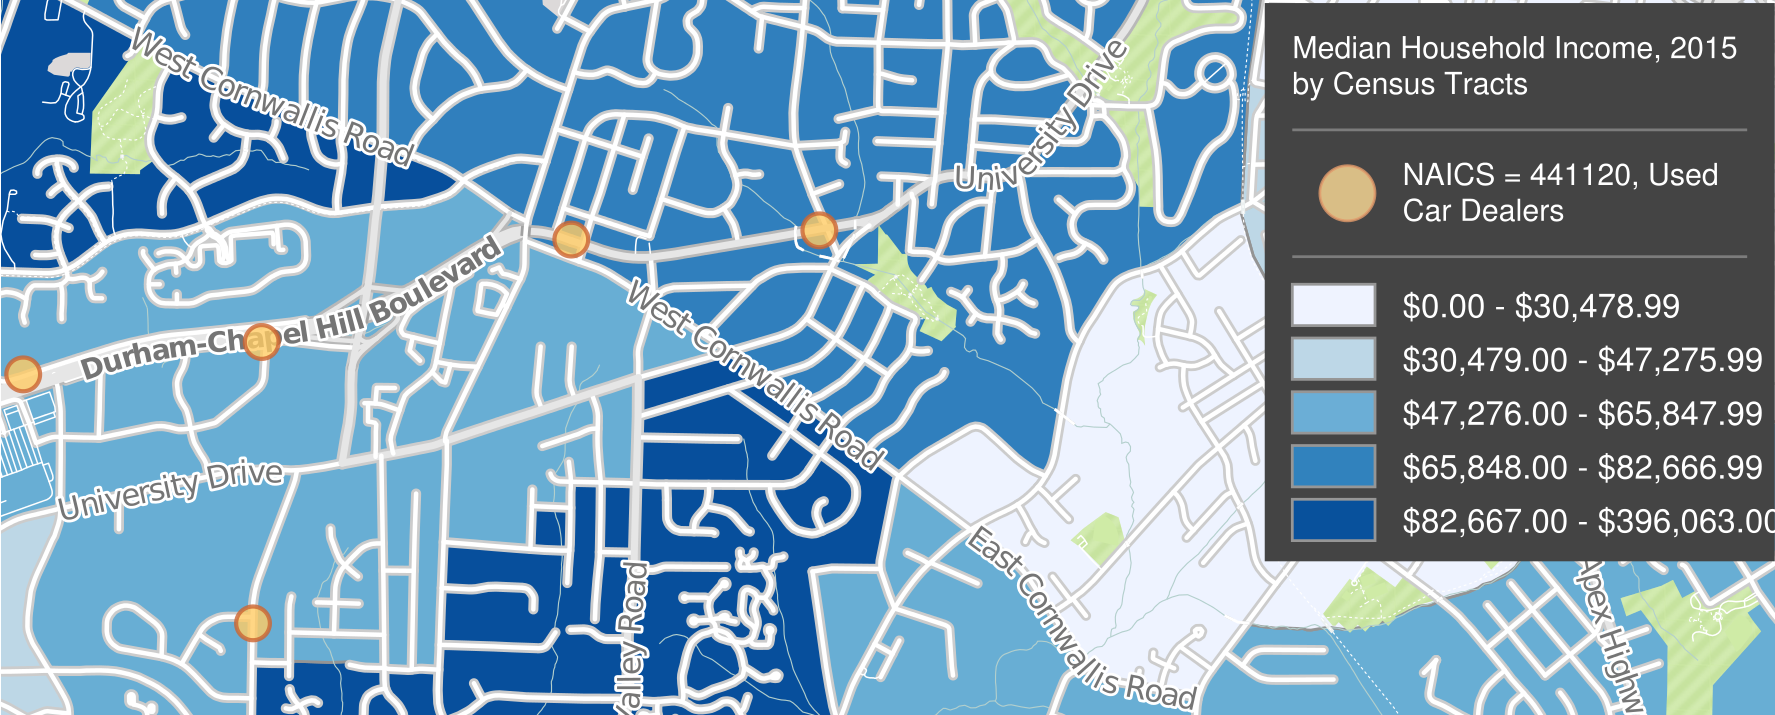
From these databases, you can extract lists of locations with geographic coordinates for plotting in GIS software, and SimplyAnalytics also lets you download data already formatted as GIS layers. Researchers often use this data when needing to associate business locations with the demographics and socio-economic characteristics of neighborhoods (e.g., is there a lack of full-service grocery stores in poor neighborhoods?).

SimplyAnalytics
SimplyAnalytics

When searching these resources (or any business data source), it often helps to use an industry classification code to focus your search. Examples are the North American Industry Classification System (NAICS) and the Standard Industrial Classification (SIC) (no longer revised, but still commonly used). You can determine a code using a keyword search or drilling down through a hierarchy.

Aggregated Business and Marketing Data

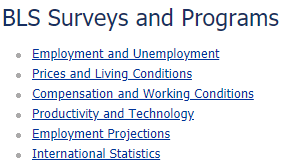
Government surveys ask questions of businesses or samples of businesses. The data is aggregated by industry, location, size of company, and other criteria and typically include information on the characteristics of each industry, such as employment, wages, and productivity.

Sample Government Resources

Macroeconomic indicators relate to the overall business climate, and a good source for macro data is Global Financial Data. Its data series includes many stock exchange and bond indexes from around the world.

Private firms also collect market research data through sample surveys. These are often from a consumer perspective, for instance to help gauge demand for specific products and services. Be aware that the numbers for small geographies (e.g., Census Tracts or Block Groups) are typically imputed from small nationwide samples, based on correlations with demographic and socioeconomic indicators. Examples of resources with such data are SimplyAnalytics (with data from EASI and Simmons) and Statista (mostly national-level data).

Firm-Level Data

You may be interested in comparing numbers between companies, ranking them based on certain indicators, or gathering time-series data on a company to follow changes over time.  Always be aware of whether the company is a publicly traded corporation or is privately held, as the data sources and availability of information may vary.

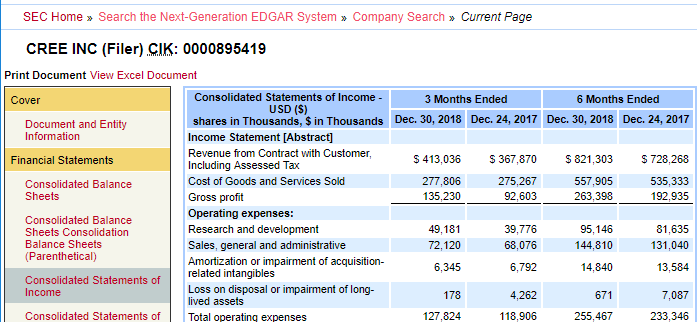
For firm-level financial detail, public corporations traded in the US are required to submit data to the U.S. Securities and Exchange Commission (SEC).

EDGAR
SEC’s EDGAR Service

Their EDGAR service is the source of the corporate financials repackaged by commercial data providers, and you might find additional context and narrative analysis with products such as Mergent Online, Thomson One, or S&P Global NetAdvantage.  The Bloomberg Professional Service in the DVS computer lab contains a vast amount of data, news, and analysis on firms and economic conditions worldwide. You can find many more sources for firm- and industry-specific data from the library’s guide on Company and Industry Research, and of course at the Ford Library at the Fuqua School of Business.

All of these sources provide tabular download options.

For help finding any sort of business or industry data, don’t hesitate to contact us at askdata@duke.edu.

Upcoming MATLAB Training at Duke

MATLAB is an integrated technical computing environment that combines numeric computation, advanced graphics and visualization, and a high-level programming language.  Duke’s license agreement offers MATLAB licenses to faculty and staff for work or personal computers, as well as students through on-campus use.  The Duke Office of Information Technology (OIT) maintains instructions on installing MATLAB at Duke.  MATLAB is used by many communities at Duke, including Engineering, Econometrics, Medical Sciences, Computational Biology, and Business.

On Tuesday, June 18, OIT in partnership with Duke University Libraries will host a one-day course on MATLAB that focuses on using this software for Data Processing and Visualization.  The course will cover importing data, organizing data, and visualizing data in a hands-on format (detailed outline).  Seats are limited to 20; please register soon to reserve your spot.

MATLAB for Data Processing and Visualization
(outline)
Laura Proctor, Academic Training Engineer at MathWorks
Tuesday, June 18
8:30 a.m. to 4:30 p.m. (lunch break from 12:00 p.m. to 1:00 p.m., lunch not provided)
Library Computer Classroom, Bostock 023
Registration (seats limited to 20)

The course assumes some existing familiarity with MATLAB.  New potential MATLAB users may want to attend an overview seminar on the software that will be held on Thursday, May 30.  This overview will not be hands on, but it will include live demonstrations and examples of both MATLAB and Simulink, an environment for multi-domain simulation and model-based design.

Introduction to Data Analysis and Visualization with MATLAB & Simulink
(details and registration)
Mehernaz Savai, Applications Engineer at MathWorks
Thursday, May 30
1:00 p.m. to 4:00 p.m.
FCIEMAS Building, Schiciano Auditorium – side A

If you would like to begin learning to use MATLAB, MathWorks offers a self-directed MATLAB Fundamentals course, and the Duke library collection also includes several introductory MATLAB texts, such as MATLAB Primer and MATLAB: A Practical Approach.

Bloomberg Has Arrived

No, it’s not Michael Bloomberg, New York City’s mayor, but the financial data service that he founded back in 1981.

The Data & GIS Services Department of Perkins Library is pleased to announce the installation of three Bloomberg Terminals in the Data/GIS Computer Cluster (Perkins Room 226). The terminals are made possible with the generous assistance of the Duke Financial Economics Center in the Duke Department of Economics.

In the past, West Campus users would need to travel to the Ford Library at the Fuqua School of Business.  This new arrangement allows them to access the Bloomberg service whenever Perkins Library is open.  The service is available only to Duke students, faculty, and staff.

Data and NewsBloomberg Monitors

Bloomberg Professional is an online service providing current and historical financial data on individual equities, stock market indices, fixed-income securities, currencies, commodities, futures, and foreign exchange for both international and domestic markets.

It also provides news on worldwide financial markets and industries as well as economic data for the countries of the world.  Additionally, it provides company profiles, company financial statements and filings, analysts’ forecasts, and audio and video interviews and presentations by key players in business and finance (the Bloomberg Forum).

The Bloomberg Excel Add-in is a tool that delivers Bloomberg data directly into an Excel spreadsheet for custom analysis and calculations.

Bloomberg keyboard

Hardware

The dual monitors at each workstation provide plenty of real estate, enabling multiple windows for your research.

The Bloomberg keyboard is customized and color-coded to allow users to access quickly and easily the information contained in the Bloomberg system and to perform specific functions.

  • The red keys are used to login or logout of the system.
  • The yellow keys represent market sectors.
  • Green keys are action keys, to request the system to do something.

Often when using Bloomberg, your command might look something like this:
[TICKER] < MARKET > [FUNCTION CODE] < GO >

The system also allows standard mouse-clicking on the screens to activate many functions.

Bloomberg Certification

You may wish to become Bloomberg Certified, which requires the successful completion of several online Bloomberg Essential courses: 4 core courses plus 1 market sector found under the BESS command.  Complete these at your own pace, but you only have two chances to pass the test.  Certification will provide documentation that you’ve gained comprehensive knowledge of the Bloomberg Professional service.

Limitations

Bloomberg for Education doesn’t have the full functionality of the commercial version of Bloomberg Professional.  For instance, there is a lag in stock quotes and data that makes it incompatible for real-time analysis or trading, it has more limited downloading capabilities, and of course there’s no online trading.

Login

You need to create your own personal login when you first access the system and will need to be near a cell phone to complete registration.  You will get either a phone call or a text message with a validation code.

Once your personal login is validated and you open the Bloomberg Service, you can open Excel and then install the Excel Add-in (move mouse to lower edge of screen to activate Windows Start button, choose All Programs … Bloomberg … Install Excel Add-in).  Then close and reopen Excel to display the Bloomberg tab for added functionality.

Cheat Sheet to log in to Bloomberg at the Library

Assistance

For help, please contact staff in the Library’s Data & GIS Services Dept.  To tide us over while we gather further documentation, besides the green Help key on the Bloomberg keyboard, the EASY command, and the CHEAT command, please take a look at some of the following help guides that have been compiled at other libraries. (Be aware that some of the instructions regarding access and logging in are specific to these other institutions.)