All posts by Jena Happ

Shapefiles vs. Geodatabases

Ever wonder what the difference between a shapefile and a geodatabase is in GIS and why each storage format is used for different purposes?  It is important to decide which format to use before beginning your project so you do not have to convert many files midway through your project.

Basics About Shapefiles:

Shapefiles are simple storage formats that have been used in ArcMap since the 1990s when Esri created ArcView (the early version of ArcMap 10.3).  Therefore, shapefiles have many limitations such as:

  • Takes up more storage space on your computer than a geodatabase
  • Do not support names in fields longer than 10 characters
  • Cannot store date and time in the same field
  • Do not support raster files
  • Do not store NULL values in a field; when a value is NULL, a shapefile will use 0 instead

Users are allowed to create points, lines, and polygons with a shapefile.  One shapefile must have at least 3 files but most shapefiles have around 6 files.  A shapefile must have:

  • .shp – this file stores the geometry of the feature
  • .shx – this file stores the index of the geometry
  • .dbf – this file stores the attribute information for the feature

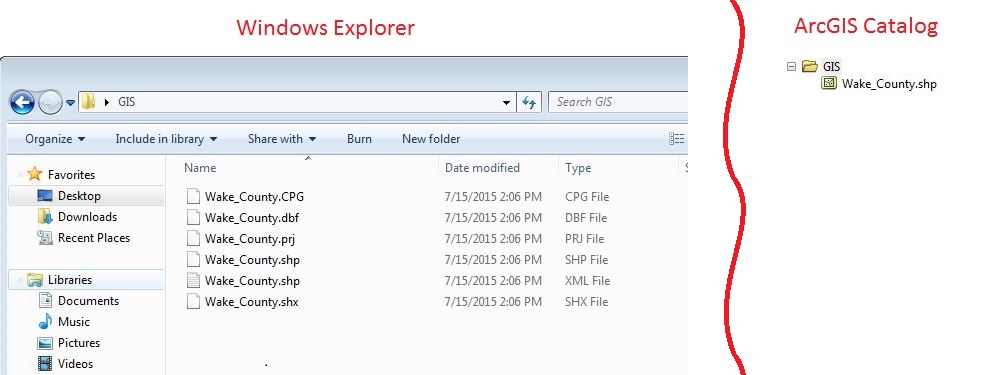
All files for the shapefile must be stored in the same location with the same name or else the shapefile will not load.  When a shapefile is opened in Windows Explorer it will look different than when opened in ArcCatalog.

Shapefile_Windows


Basics About Geodatabases:

Geodatabases allow users to thematically organize their data and store spatial databases, tables, and raster datasets.  There are two types of single user geodatabases: File Geodatabase and Personal Geodatabase.  File geodatabases have many benefits including:

  • 1 TB of storage limits of each dataset
  • Better performance capabilities than Personal Geodatabase
  • Many users can view data inside the File Geodatabase while the geodatabase is being edited by another user
  • The geodatabase can be compressed which helps reduce the geodatabases’ size on the disk

On the other hand, Personal Geodatabases were originally designed to be used in conjunction with Microsoft Access and the Geodatabase is stored as an Access file (.mdb).  Therefore Personal Geodatabases can be opened directly in Microsoft Access, but the entire geodatabase can only have 2 GB of storage.

To organize your data into themes you can create Feature Datasets within a geodatabase.  Feature datasets store Feature Classes (which are the equivalent to shapefiles) with the same coordinate system.  Like shapefiles, users can create points, lines, and polygons with feature classes; feature classes also have the ability to create annotation, and dimension features.

Geodatabase

In order to create advanced datasets (such as add a network dataset, a geometric network, a terrain dataset, a parcel fabric, or run topology on an existing layer) in ArcGIS, you will need to create a Feature Dataset.

You will not be able to access any files of a File geodatabase in Windows Explorer.  When you do, the Durham_County geodatabase shown above will look like this:

Windows2


Tips:

  • When you copy shapefiles anytime, use ArcCatalog. If you use Windows Explorer and do not select all the files for a shapefile, the shapefile will be corrupt and will not load.
  • When using a geodatabase, use a File Geodatabase. There is more storage capacity, multiple users can view/read the database at the same time, and the file geodatabase runs tools and queries faster than a Personal Geodatabase.
  • Use a shapefile when you want to read the attribute table or when you have a one or two tools/processes you need to do. Long-term projects should be organized into a File Geodatabase and Feature Datasets.
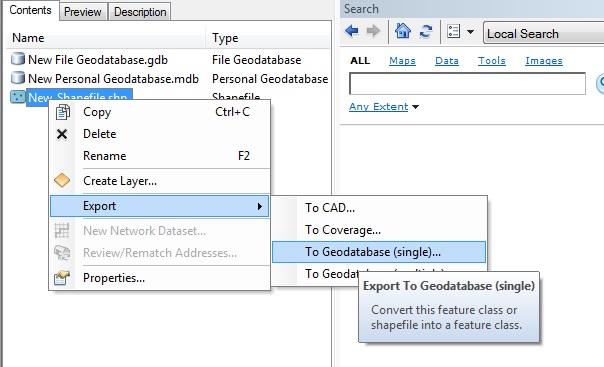
  • Many files downloaded from the internet are shapefiles. To convert them into your geodatabase, right click the shapefile, click “Export,” and select “To Geodatabase (single).”

Export_Shp

ModelBuilder

Ever have trouble conceptualizing your project workflow?  ModelBuilder  allows you to plan your project before you run any tools.  When using ModelBuilder in ESRI’s ArcMap, you create a workflow of your project by adding the data and tools you need.  To open ModelBuilder, click the ModelBuilder icon     (MB_Icon) in the Standard Toolbar.

MBIcon

Key Points Before You Build Your Model

ModelBuilder can only be created and saved in a toolbox.  In order to create your model, you first need to create a new toolbox in the Toolboxes, MyToolboxes folders in ArcCatalog.  Once you have a new toolbox, you will need to create a new Model; to do this, right click your newly created toolbox and select New, then Model.  When you wish to open an existing ModelBuilder, find your toolbox, right click your Model and select Edit.

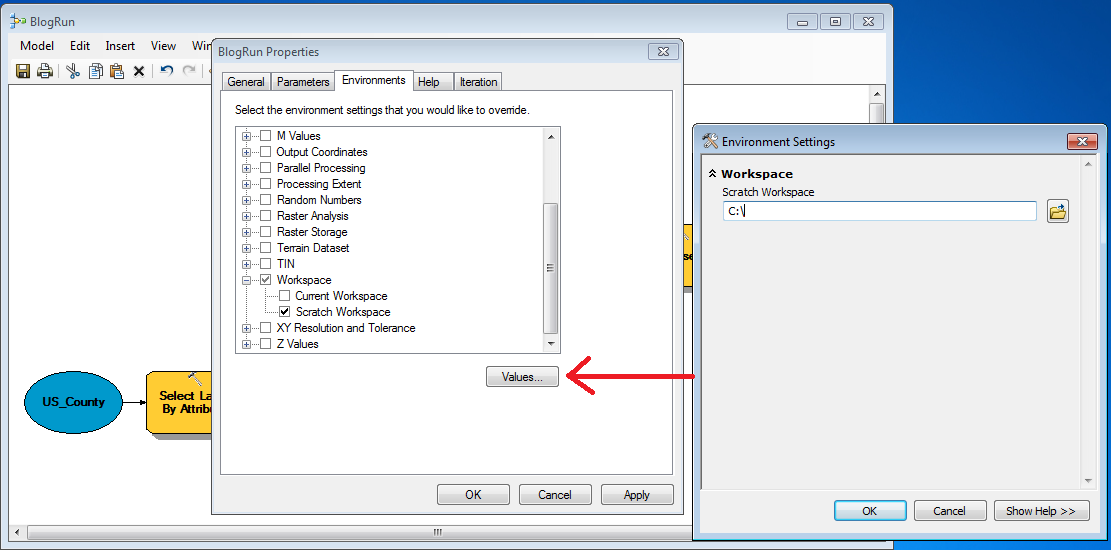
In order to find the results of your model and the data created in the middle of your project workflow (also known as intermediate data), you will need to direct the data to any workspace or a Scratch Geodatabase.  To set your data results to a Scratch Geodatabase in ModelBuilder, click Model, then Model Properties.  A dialog box will open and you will want to select the Environments tab, Workspace category, and check Scratch Workspace.  Before closing the dialog box, select “Values” and navigate to your workspace or your geodatabase.

Set_Workspace

Building and Running a Model

To create a model, click the Add Data or Tool button (AddData).  Navigate to the SystemToolboxes, find the tool you wish to run, and add it to your model.  Double click the tool within the Model and its parameters will open.  Fill out the appropriate fields for the tool and select OK.

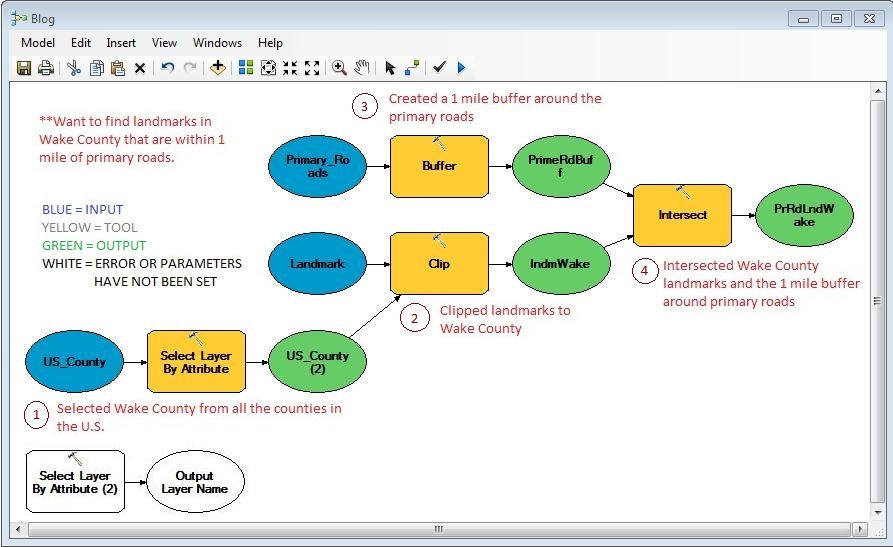
When the tools or variables are ready for processing, they will be colored blue, green, or yellow.  Blue variables are inputs, yellow variables are tools, and green variables are outputs.  When there is an error or the parameters have not been chosen, the variables will have no color.

ModelBlog_Good

Once you have your model built, click the Run icon (MBRun) to run the model.  Depending on the data and the amount of tools you run, the Model can take seconds or minutes to run.  You can also run one tool at a time; to do this, right click the tool and select “Run.”  When the Model is done running, the tools and outputs will have a gray background.  To find the results of your model, navigate to the Scratch Workspace you have set and add the shapefile or table to ArcMap or right-click the output variable before running the model and select “Add to Display.”

Applying ModelBuilder

The model above demonstrates how to take nationwide county data, North Carolina landmark data and North Carolina major roads data and find landmarks in Wake County that are within 1 mile of major roads.  The first tool in the model (Select Layer by Attribute tool) extracts Wake County from the nationwide counties polygon layer. 1

Once Wake County is extracted to a new layer, the North Carolina landmarks layer is clipped to the Wake County layer using the Clip tool2 The result of this tool creates a landmarks point layer in Wake County.  The third tool uses the Buffer tool on the primary roads layer in North Carolina.  Within the Buffer tool parameters, a distance of 1 mile is chosen and a new polygon layer is created.


Finally, the Wake County landmarks layer is intersected with the buffered major roads layer to create a final output using the Interect tool.4  Using ModelBuilder has many benefits: you document the steps you used to create your project and you can easily rerun the tool with different inputs after the model is built.  ModelBuilder allows users to easily determine if and where problems in the workflow are.  When there is an error in the workflow, a “Failed to Execute” message will appear and tell users which tool was unable to execute.  ModelBuilder also lets users easily change parameters.  In the model used above, you could change the Expression in the Select Layer by Attribute tool from ‘Wake’ to ‘Durham’ and find landmarks within 1 mile of major roads in Durham County.

ArcGIS Open Data

What is Open Data?

Finding data can be challenging.  Organizations and government agencies can share their data with the public using ESRI’s ArcGIS Open Data, a centralized spatial data clearinghouse.  Since its inception last year, over 1,600 organizations have provided more than 22,000 open datasets to the public.  Open Data allows users to find and download data in different formats, including shapefiles, spreadsheets, and KML documents, as well as APIs (GeoJSON or Esri GeoServices) to call the data into your own application.  It also lets you create various types of charts.

Search_Open_Data

How to Find and Use Data

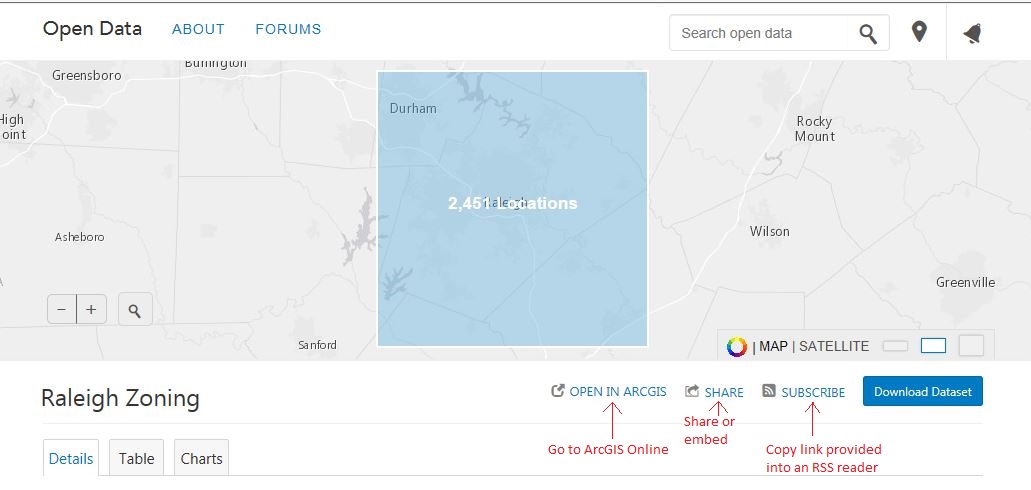
Open Data allows consumers to type in a geographic area or a topic of interest in a single search box.  Once you’ve found data that appears to be what you were looking for, you can use the data for GIS purposes or use a table to create charts and graphs.  If you are looking for GIS data, you can preview the spatial data before downloading by clicking the “Open in ArcGIS” icon.  This takes users to ArcGIS Online where they can create choropleth maps and interact with the attribute table.   Users interested in tabular data can filter it and create various types of charts.  If more analysis of the data is necessary, you can download it by clicking the “Download Dataset” icon; you are able to download the entire dataset or the filtered dataset you’ve been working with.

OpenData_Page

Tips

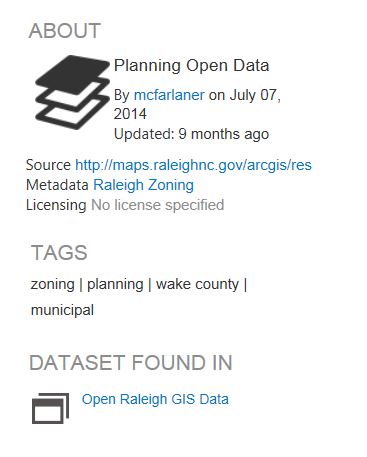
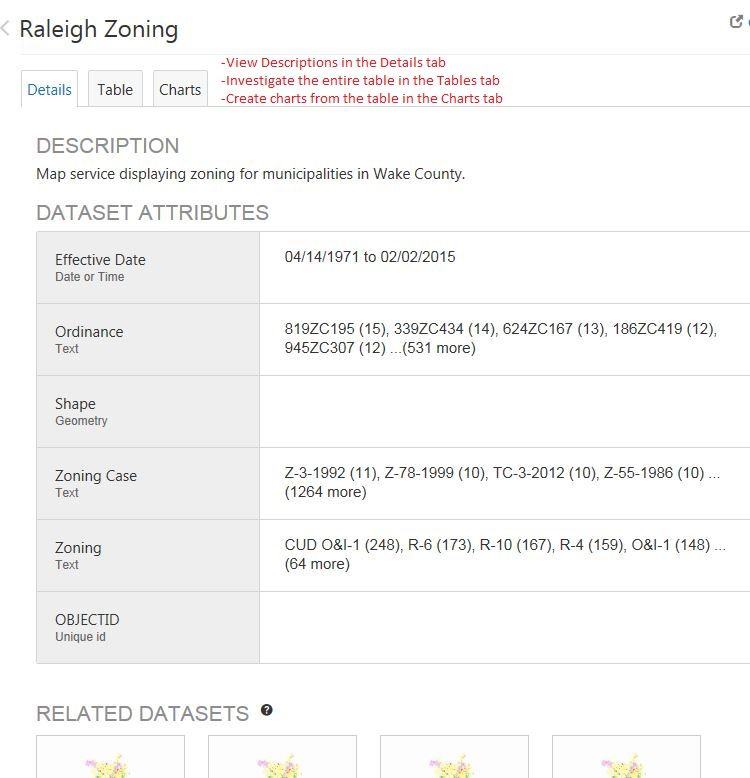
The Source and Metadata links below the “About” heading provide information about the data.  In-depth information such as descriptions, attributes, OpenDataAboutand how the data was collected are provided in these links.  Below the name of the dataset there are three tabs:  “Details,” “Table,” and “Charts.”  Under the “Details” tab there are three sections, the Description, Dataset Attributes, and Related Datasets sections.  The Dataset Attributes section outlines the fields found within the dataset and provides field type information, while the Related Datasets section provides links to other datasets that have similar geographies or topics to the dataset you’ve chosen.  In the “Table” tab, you can view and filter the entire table in the dataset and the “Charts” tab allows you to create different charts.

OpenDataDetailTo obtain the most updated dataset or other updated articles related to the dataset, users should subscribe to the dataset they are interested in.  To subscribe, copy the link provided into an RSS Reader.  For specific data source questions, feel free to ask the Data and Visualization Department at askdata@duke.edu.