Visualizing spatial data can be challenging. Specialized software tools like ArcGIS produce excellent results, but often seem complex for relatively simple tasks. Several online tools have emerged recently that provide relatively easy alternatives for the display of spatial data. In this post, we examine GeoCommons, a web based tool for presenting spatial data in detail. (Go to this guide to see a comparison chart of packages and features, and see this Duke University Libguide for a more detailed review of GeoCommons.)
GeoCommons (geocommons.com)
GeoCommons is an online mapping application that easily imports a variety of data formats, including geospatial data, and quickly produces sharable maps. In contrast to other mapping tools, GeoCommons contains several categorization algorithms, such as quantile classification and classification based on the standard deviation of the sample that assist with the construction of informative maps. CSV files and ArcGIS shapefiles are two of the most widely used file formats compatible with GeoCommons.
GeoCommons is very easy to use and contains some of the display features contained in high-end GIS suites. Creation of new variables tied to geographies can be tricky, so it’s advised to either upload data and map in final form or to first identify the layer to which you will upload and join a complete data set.
Geocoding

To begin geocoding, upload a file. Gecommons has the capability to recognize spatially encoded data. Some formats may require user assistance.
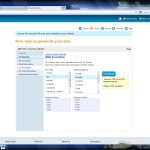
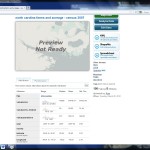
If you’ve uploaded data that contains latitude and longitude coordinates, choose this option. In my case, I had county FIPS codes that uniquely identified each county. Selecting US Boundaries to the left, then USA Counties, I was able to successfully preview how well my FIPS codes matched the layer (Figures 1 and 2). A variety of other boundary types are available. The key is to have in your data a unique identifier that identifies each record in the same manner as an available geocoding layer.

Review the geocoding results and select Continue to proceed.
Mapping
Geocommons offers some nice built in features that assist with categorizing measures. The application will produce summary statistics for numeric fields (Figure 3), which gives you a quick picture of your sample and can assist with how to categorize the data. Click the “Make a Map” button to proceed to the interactive interface.

Also note the filter tab, which allows you to screen out groups of cases. For example, I may request a minimum number of farms to screen out urban counties.
Figure 4 shows a standard choropleth map portraying median number of acres per farm by county for North Carolina in 2007. In this example, I have classified counties into five groups using standard deviations to group counties.
Sharing

GeoCommons contains a wide variety of ways to share data (accessed through the About section). Posting to Twitter, Facebook, and an array of other social media sites is possible with a few short clicks. You can directly email a link to the map along with a short personal message right out of the application.For those who wish to post to a web page, GeoCommons provides two ways to insert a map, through a <div> tag and through an iframe. All code is generated for copy and paste into your page.
To access a version of this map, simply follow this link.
Finally, GeoCommons will produce a PNG image and a KML document for download. The image export feature appears to be relatively new and does take trial-and-error to align correctly. In addition, it does not appear to include any base layers or legends in the output, only the data layer.
Other Notes
When using standard deviation and maximum breaks methods for grouping observations, double check the category definitions by changing the number of categories and the resulting changes to the definitions for the new groups. This will help to confirm whether data are grouped appropriately and exactly what the definitions for each category are.

