A team of Duke undergraduates participating in the Global Health Capstone course was awarded the “Outstanding Capstone Research Project” for their examination of state and congressional district characteristics that might influence the outcome of legislative efforts to raise cigarette excise taxes in North Carolina, South Carolina, and Mississippi. Sarah Chapin and Gregory Morrison used GIS mapping tools in the Library’s Data & GIS Services Department to illuminate the relationships between county demographics and state legislators’ votes for or against cigarette tax hikes. Brian Clement, Alexa Monroy, and Katherine Roemer were other members of the research group. Congratulations!
Regional Focus
The recent cigarette excise tax increases Mississippi (2009), North Carolina (2009), and South Carolina (2010) served as case studies from which to draw components of successful strategies to develop a regional legislative toolkit for those wishing to increase cigarette excise taxes in the Southeast. In all of these states, the tax increase was controversial. The Southeast in general is tax averse, which presents a systemic challenge to those who advocate raising taxes on cigarettes.
 The researchers examined state characteristics which might influence the outcome of efforts to raise excise taxes, such as coalitions for and against proposed increases, the facts each side brought to bear and the nature of the discourse mobilized by different groups, the economic impact in each state of both smoking and the proposed excise taxes, and local political realities. The students restricted the area of interest to the Southeast because this region has a shared history and, consequently, similar challenges when it comes to race, poverty, and rural populations. They are also, broadly speaking, politically similar and have had a similar experience with both tobacco use and government regulation.
This multi-disciplinary analysis provides a reference point for state legislators or interest groups wishing to pass cigarette tax increases. The deliverable provided a model of past voting trends, suggestions for framing political dimensions of the issue, and strategies to overcome opposition in state legislatures.
Comparing Legislative Districts and County Data
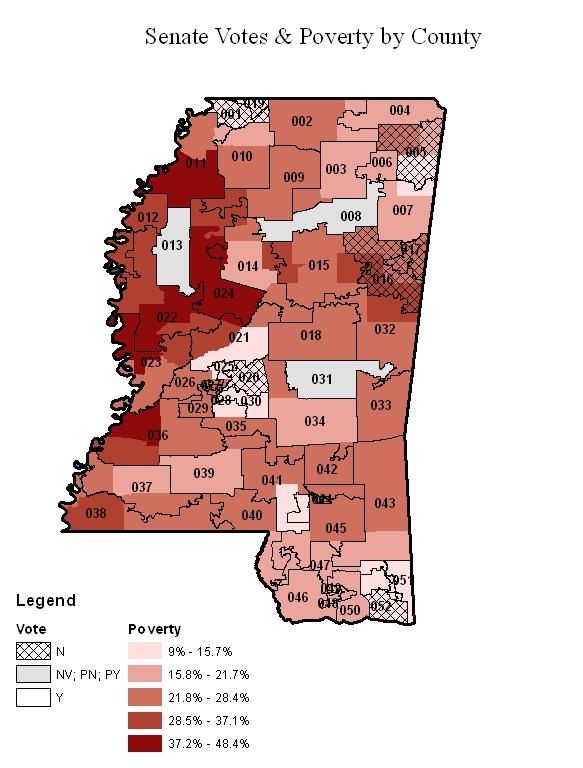
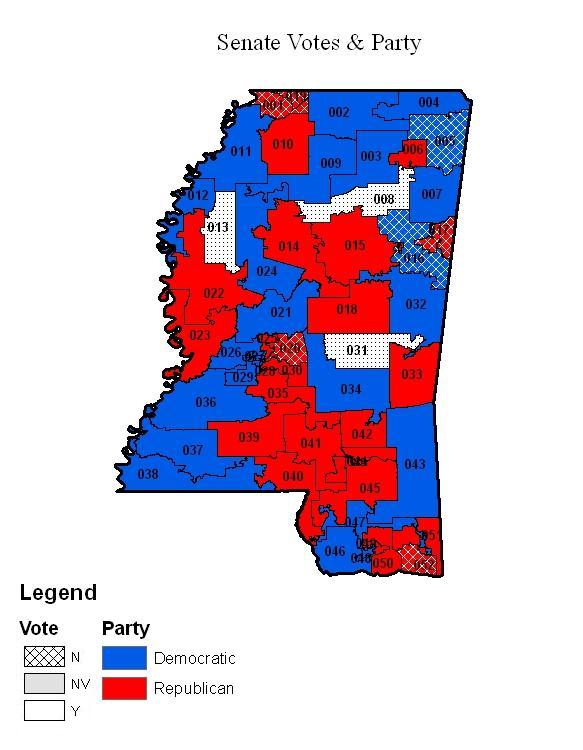 The bulk of the research involved mapping the political landscape surrounding cigarette tax legislation. In doing so, researchers looked at voting records, interest group politics, campaigns, and state ideology. Broadly, the research entailed charting the electoral geography by overlaying state house and senate districts with county-level data. Districts were coded based on voting history, party affiliation, smoking rates, and constituent demographics. State legislature websites were used to find representatives’ voting histories, allowing the researchers to match legislators by county when constructing a GIS dataset. County party affiliations are available through the state board of elections. Finally, county demographics came from the 2010 Census data.

Overcoming Ideology
Besides using GIS mapping to illustrate these relationships, the researchers analyzed the involvement of major interest groups, specifically, lobbying expenditures and campaign contributions to map the involvement of both pro- and anti-tobacco interest groups. Additionally, they examined the impact of state ideology on the framing of political dimensions, looking at editorials, opinion pieces, newspapers, and committee markups, as well as interviews (both previous interviews and ones they conducted) with state legislators and interest groups. Overcoming state ideology, both political and social, is a major factor in passing cigarette excise tax legislation, especially in a region with such dominant tobacco influence.
Again, the purpose of the research is not merely to understand the political landscapes surrounding the passage of cigarette tax bills, but to apply these findings to the creation of a legislative toolbox for representatives or interests groups concerned with pushing similar legislation.