Do residential restrictions placed on convicted sex offenders serve to protect the public? Duke Economics Ph.D. candidate Songman Kang, has been using the analytical capabilities of geographic information software to help determine the extent to which the restrictions affect residential locations of sex offenders: computing the area covered by a restriction and determining which offenders had to relocate due to a restriction.
According to Kang, the residential restrictions are designed to reduce recidivism among sex offenders and prevent their presence near places where children regularly congregate. Neither of these claims has been found consistent with empirical evidence though, and it is unclear whether the restrictions have been successful in reducing the rates of repeat sex offenses. On the other hand, the restrictions severely limit residential location choices, and may force offenders to relocate away from employment opportunities and supportive networks of family and friends. As a result of the deteriorated economic conditions, the offenders who had to relocate may become more likely to commit non-sex offenses.
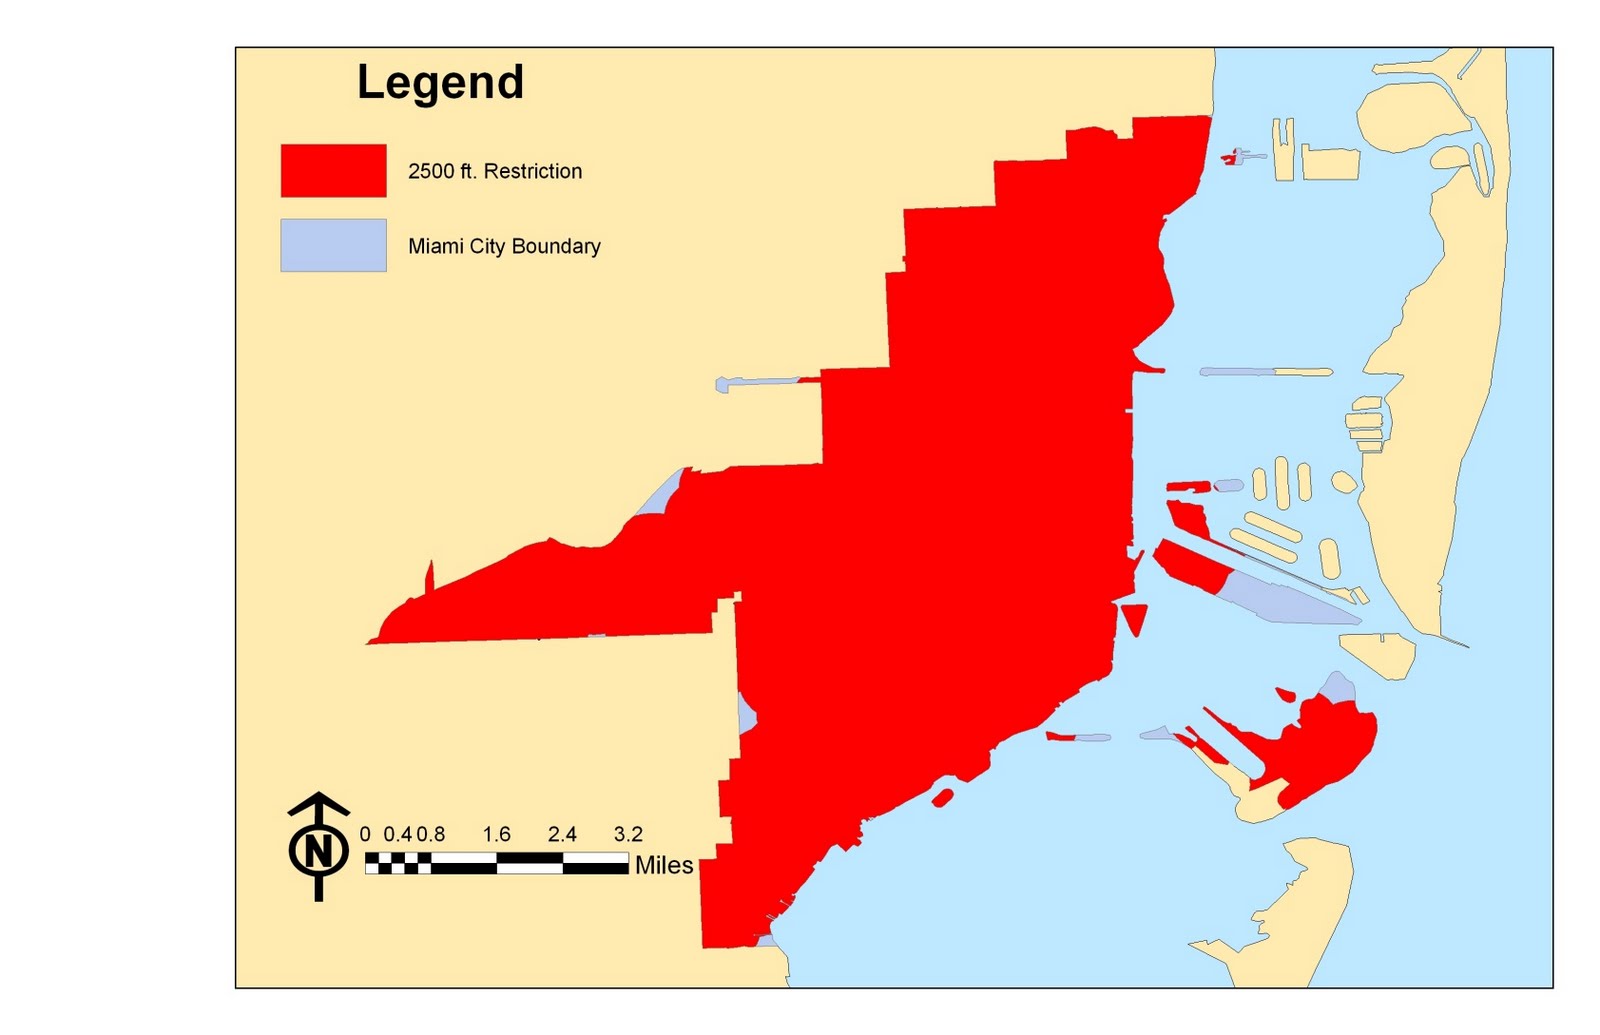
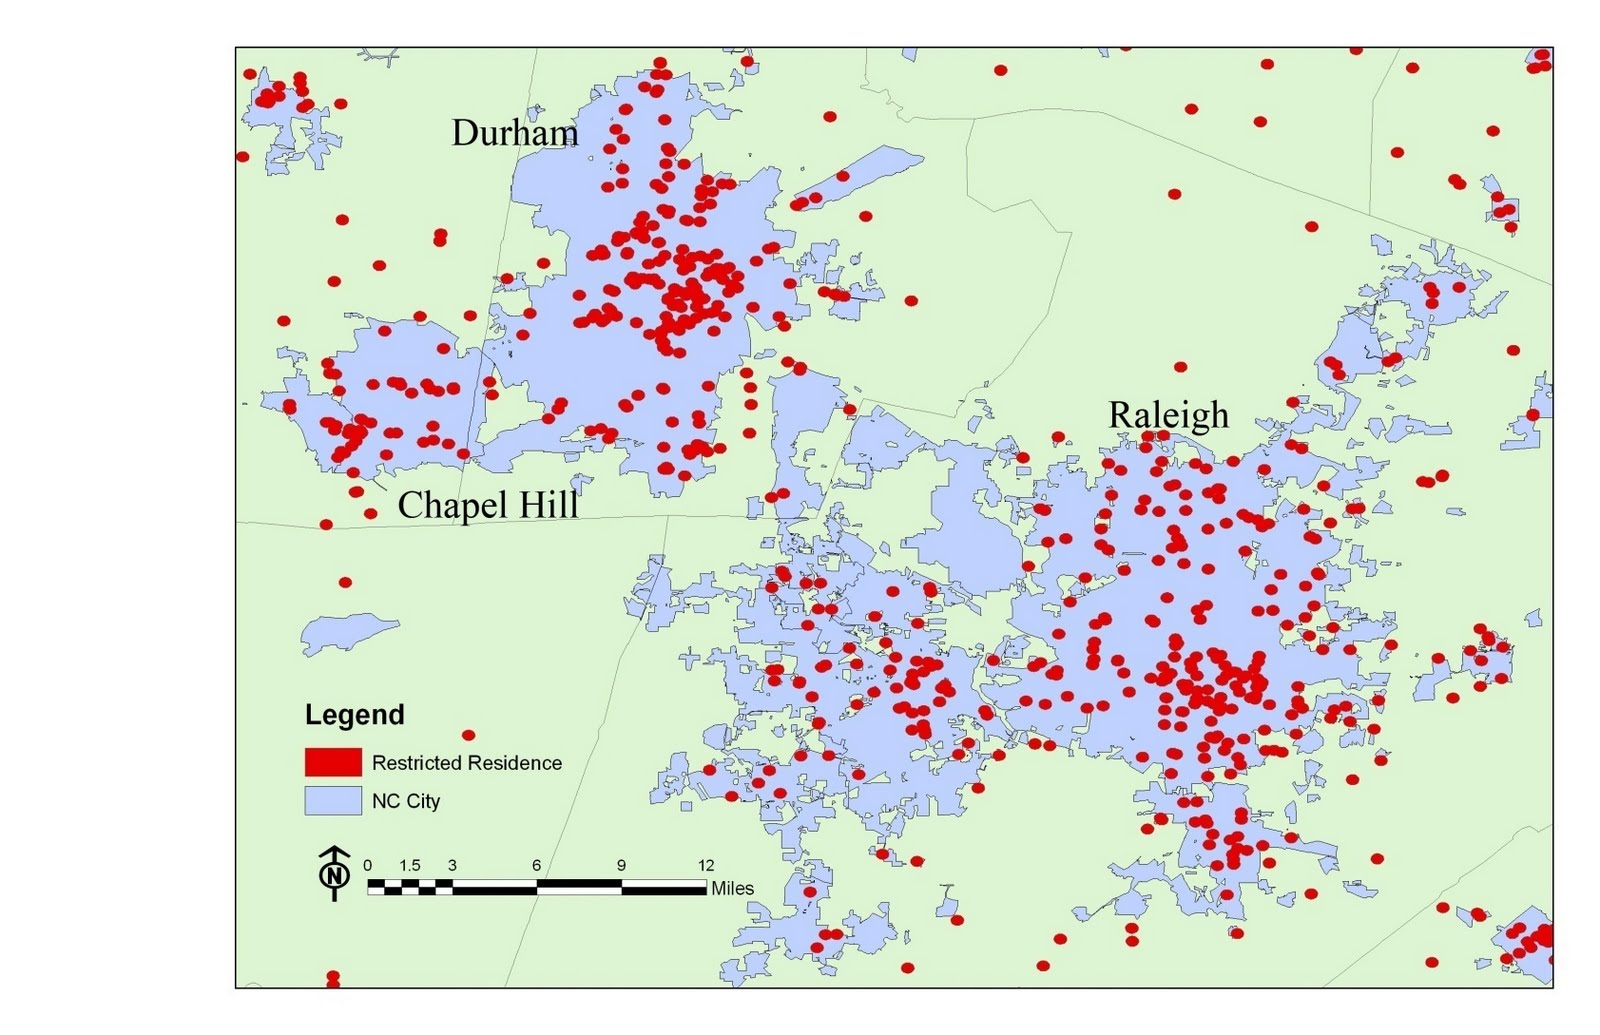
The following maps illustrate some of the restricted zones in Miami and in the Triangle area of North Carolina studied by Mr. Kang.