
Visualizing spatial data can be challenging. Specialized software tools like ArcGIS produce excellent results, but often seem complex for relatively simple tasks. Several online tools have emerged recently that provide relatively easy alternatives for the display of spatial data. In this post, we examine Google Fusion Tables, which combines visualizations, including spatial visualizations, with a database back end. The key advantages to Fusion Tables are easy display of latitude/longitude data or data that is included with address information. In addition, Fusion Tables provides a one-stop location for producing visualizations other than maps, such as line charts or tables.
Uploading Data


Uploaded to Fusion Tables is easy through Google Docs. Simply log in if you have an account, create a new Table, and on the next screen, point to the file you wish to upload. Excel and CSV files are the two most commonly used, and KML files allow for upload of maps that contain spatial information, such as locations or polygon definitions.
One thing to note about Google products is that they are often in a state of flux. Limits and restrictions noted below may change in the future. For further information regarding Google Fusion Tables, please consult this Libguide authored by Mark Thomas.
Geocoding Addresses
A complete list of geographic data types can be found at the Google support site. In this post, two of the more common geocoding types will be addressed, address data and data that applies to states, counties, and similar objects.
Address data is pretty easy to work with. Addresses should contain as much information as possible with items separated by spaces only, no commas. For example, 134 Chapel Drive Durham NC 27708 should produce a pretty good geocoding result. In the following example, Durham gun crimes for 2011 were downloaded from the Durham Police Department. The data only came with address information, so city and state data were subsequently added and combined in Excel (location field). In Figure 1, highlighted fields indicate spatial information.
To geocode the addresses, select “Map” under the “Visualize” tab. The program will automatically begin geocoding based on the left-most field containing spatial information, which is city in this case. Changing the field to “location,” which contains the full address information, will correctly geocode these addresses (Figure 2).
Once complete, the geocoded points are plotted on a map (Figure 3). As with other mapping applications, you may apply a symbology to the points in order to visualize your data.
This particular dataset contains a numeric field that identifies 5 general types of crime (crime_cat_num). Under the “Configure styles” link at the top, navigate to “Buckets” and divided the data into five buckets (Figure 4).
Once saved, each color will represent a different type of crime and shown in Figure 5 (red indicates robbery, yellow, assault and so on).
Note that only numeric fields can be used to categorize data, so you may wish to create these fields prior to upload.
Geocoding Polygons
Working with polygon data can be a bit trickier because the polygons must be spatially defined. Fusion Tables does this by using kml, which is basically a large piece of text containing all of the coordinates, in order, that define a boundary. For example, in this table, each boundary is defined in the geometry field. Google provides a variety of boundary types, which are available here. If your data match one of these existing boundary types, you may upload data and merge it with the correct table, which will basically import the boundary definitions into your dataset. Otherwise, you will have to locate suitable boundaries in a kml file and import those boundaries before merging.
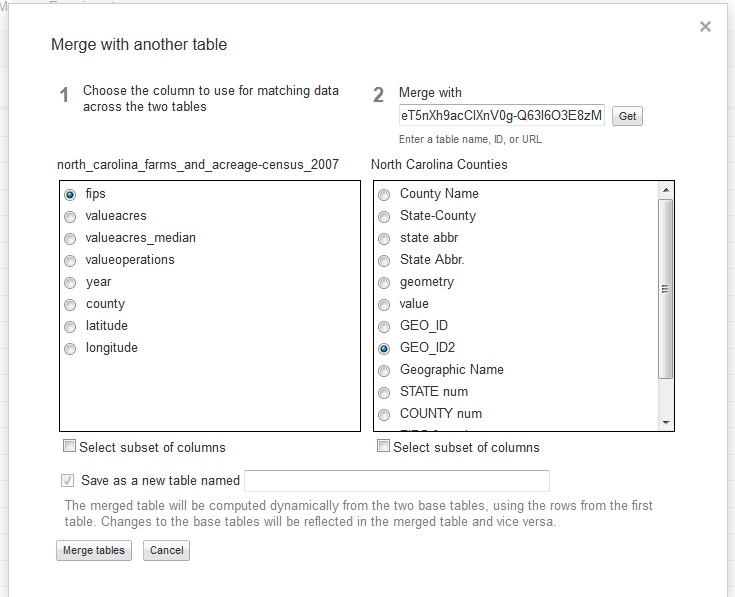
This dataset displays acreage and farms for each county in North Carolina and originally came from the Census of Agriculture. Note that there must be a field in common between your data and the data containing boundary definitions in order to merge. In addition, merge fields can only be text fields. FIPS codes uniquely identify counties and are contained in both tables. Unfortunately, Google didn’t set up their FIPS fields correctly, so a cleaned up North Carolina county file is located here.
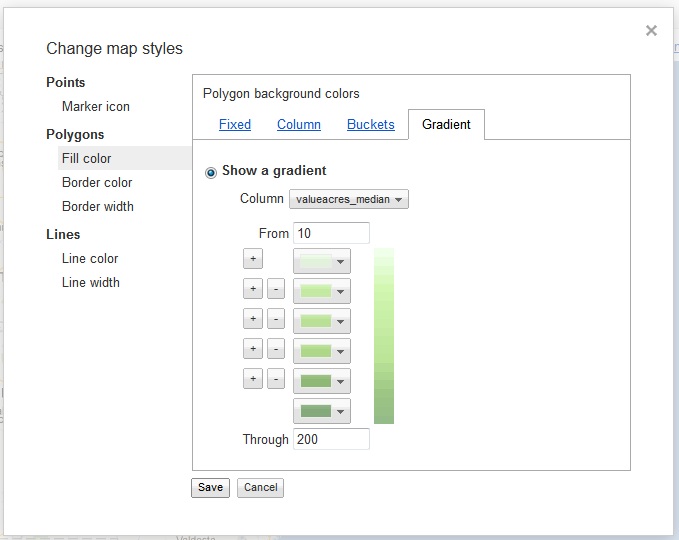
Next, click the merge tab. Copy and paste the URL for the boundaries table and click the “Get” button. In Figure 6, I merged my data to the boundary file using the fips field, which is called “fips” in table 1 and “GEO_ID2” in table 2. A merge will produce a new table, so be sure to name that new table at the bottom.Once complete, styling the map is comparable to point data. First, select “Map” under the “Visualize” tab, and be sure to point the location field at the top left to “geometry” where the boundary definitions are stored. Next, click the configure styles link. Then, select Fill color under the Polygons section.
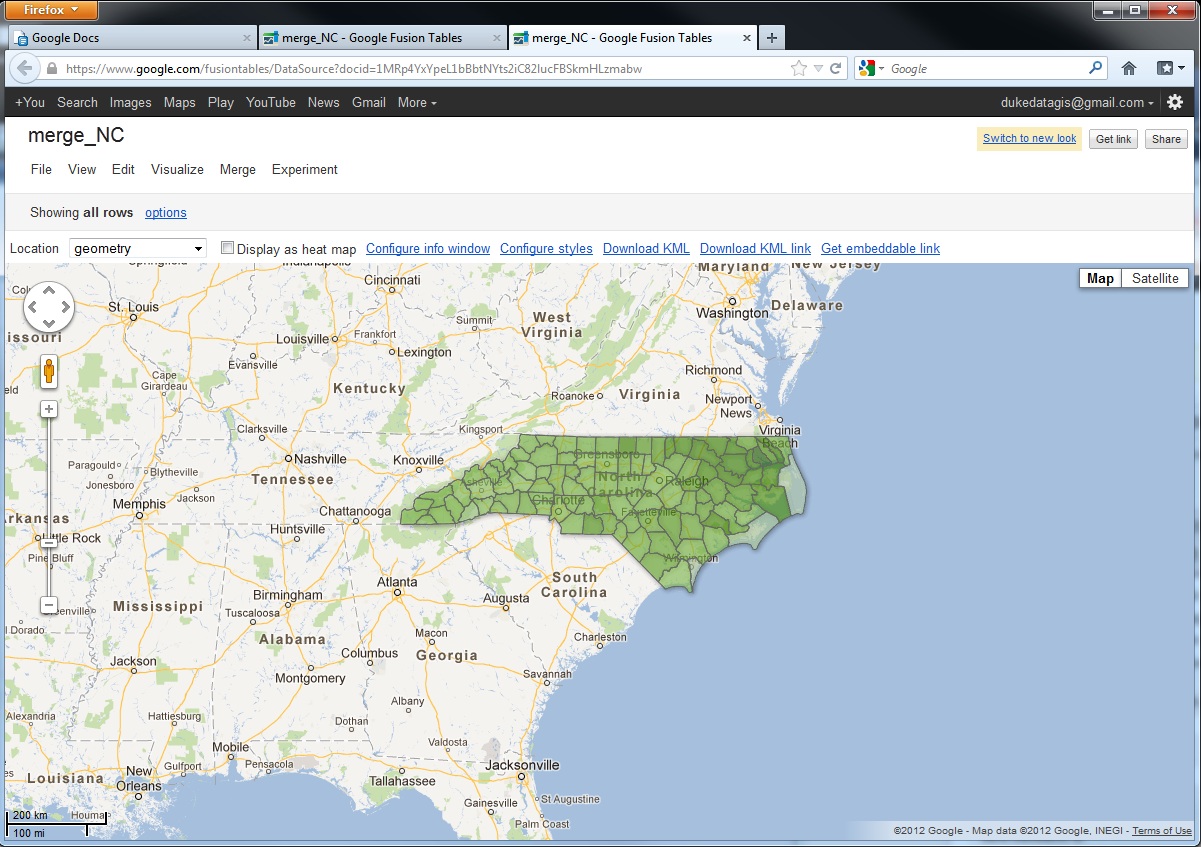
In Figure 7, I am showing median farm size (in acres) along a gradient. It’s important to note the lower and upper limits to your data in advance as the program will not automatically sense this. In this case, median farm size ranges from 10 to 191. Figure 8 shows the output.
Sharing Maps
As withsimilar online programs, Fusion Tables allows sharing of data and maps through a variety of avenues, from links to embeddable script to email. The links below point to the two maps produced in this posting.
North Carolina median farm acreage, 2007
Other Notes
This overview provides only a brief introduction to the mapping capabilities of Fusion Tables. A broad gallery of applications is located at this site, and it contains a variety of geography types. Some of these use the Fusion Tables API, which is a nice feature that allows for application development with some programming experience. As with the other tools reviewed by this blog, non-standard boundaries are generally absent and can be difficult to locate. For example, a researcher with country-level data from the 1700s may have difficulty finding a country border map from that time. However, maps are available on Fusion Tables for counties, states, countries, and congressional districts, and additional maps can be found on the Internet.