Students and researchers often ask CDVS for data on risk assessments of countries and risk comparisons between them. Some of the data sources relating to risk provide index numbers in downloadable tabular format measuring different aspects of risk, such as economic or political. They may include a few index numbers, or even thousands of nuanced indicators and changes over many years. Some of the sources provide graphic representations to compare different risk components, different countries, or changes over time. Other sources provide a more narrative discussion of risk, typically including tables and visuals, rather than downloadable datasets. The resources highlighted below present examples of each of these presentation methods and should provide researchers needing risk information with meaningful data.
ICRG Researchers Dataset (from the PRS Group)
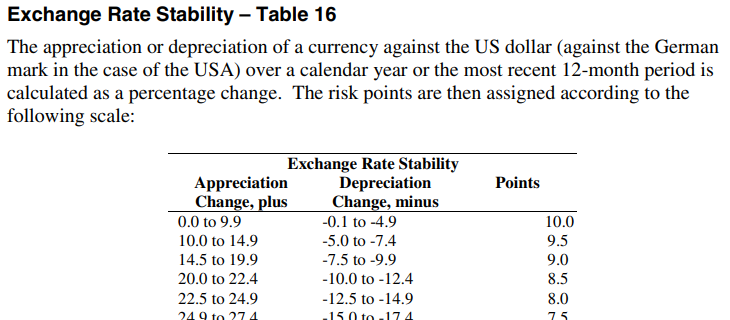
Covering 141 developed, emerging, and frontier countries, and offshore financial centers, ICRG presents monthly political, economic, financial and composite risk ratings and forecasts, provided in Excel format. The focus is on risks related to doing business in a country, although the index numbers have broader applicability. Index numbers fall within a 0-4 to a 0-12 range depending on the indicator, with the lower numbers for a given indicator representing more risk, and a codebook describes how the points are assigned.
For each country, the data includes monthly index numbers back to 1984. Duke has holdings of the Historical Political (Table 3B), Financial (4B), and Economic (5B) datasets, through 2016, which we occasionally update. The ICRG Researchers Dataset – Table 3B provides annual averages of the components of ICRG’s Political Risk Ratings (government stability, socioeconomic conditions, the investment profile, internal conflict, external conflict, corruption, military in politics, religions tensions, and law and order).
QoG (Quality of Government Institute at the University of Gothenburg, Sweden)

Compiled from open-source data, this free, extensive, and well-documented data collection includes their flagship Standard Dataset, with around 2100 variables. These are grouped into the following categories: Bureaucratic Structure, Civil Society/Population/Culture, Conflict, Education, Energy and Infrastructure, Environment, Gender Equality, Health, History, Judicial, Labour Market, Media, Migration, Political Parties and Elections, Political System, Private Economy, Public Economy, Quality of Government, Religion, and Welfare.
The Standard Dataset comes in a cross-section version, with recent data, and a time-series dataset covering 1946 to 2023. Formats include Stata (.dta), CSV, Excel (.xlsx), and SPSS (.sav). The codebook for the Standard Dataset is nearly 1700 pages. The QoG Basic Dataset contains the most frequently used variables from the Standard Dataset, and QOG also has datasets relating to the OECD, the EU, and for environmental indicators.
Political Risk Yearbooks (from the PRS Group)

From the same company that creates the ICRG data (see above), the Political Risk Yearbooks provide a more narrative assessment of country-by-country risk factors, with probability forecasts for political, social, and economic trends for 100 countries.
The Political Rick Yearbooks are included in the Business Source Complete database from EBSCO since 2003. In the Advanced Search interface, choose the “SO Publication Name” field in the dropdown and search <Political Risk Yearbook [name of country]> to find issues from a particular country.
Passport (Euromonitor)
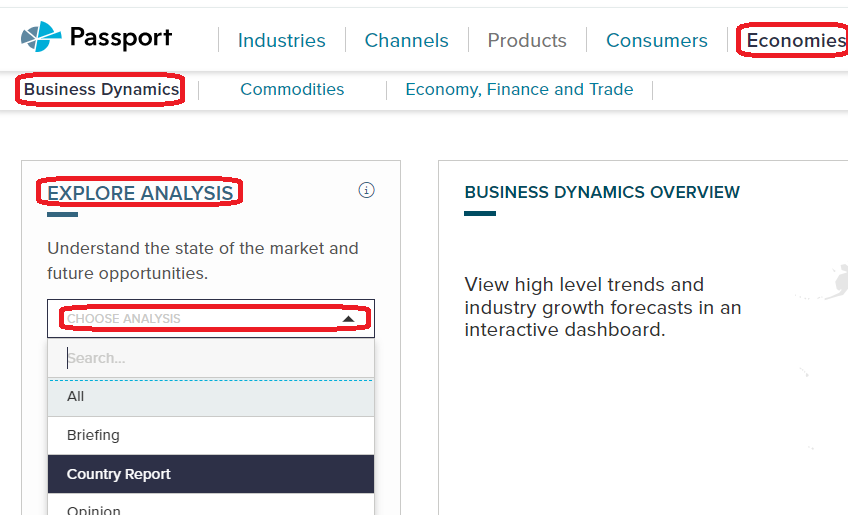
In Passport, Country Report is an option under several of the menus. One good assessment of risk can be found in the Country Reports under Economies … Business Dynamics. Under Explore Analysis, choose Country Reports in the Choose Analysis drop-down.
Also under the Economies tab, if you choose Economy, Finance and Trade, then choose Country Report under Explore Analysis as above, a useful report for risk outlook is the PEST analysis report (political, economic, social, and technological). These reports describe a framework of macro-environmental factors to use as a tools for environment scanning, understanding risks and opportunities, market growth or decline, business position, and potential and direction for operations, focusing on ways to help companies to become more competitive. The PEST reports discuss opportunities and challenges for each of the four facets.
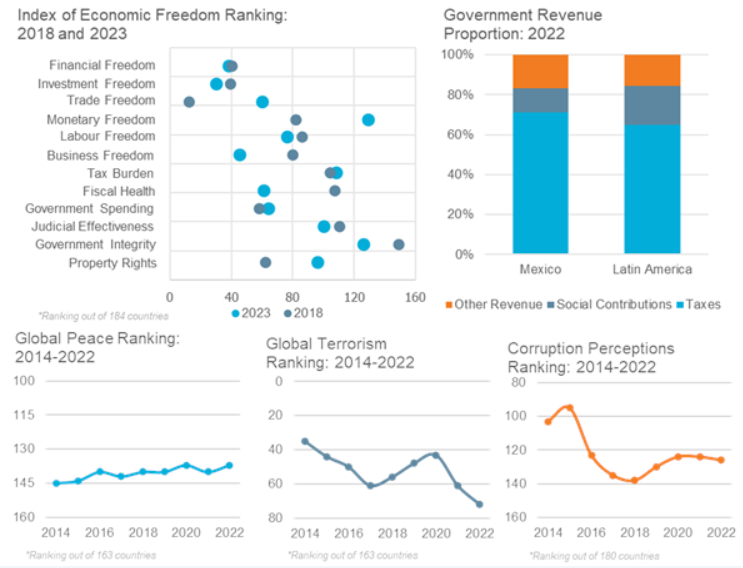
You might find other useful assessments of risk in other reports in Passport, so feel free to explore. Charts and analysis in the reports draw data from IGOs like the IMF and the ILO, as well as from think tanks with an interest in economic and political freedom, like the Heritage Foundation. Be sure to check the sources they use in their reports.
Global Risks Report (World Economic Forum)
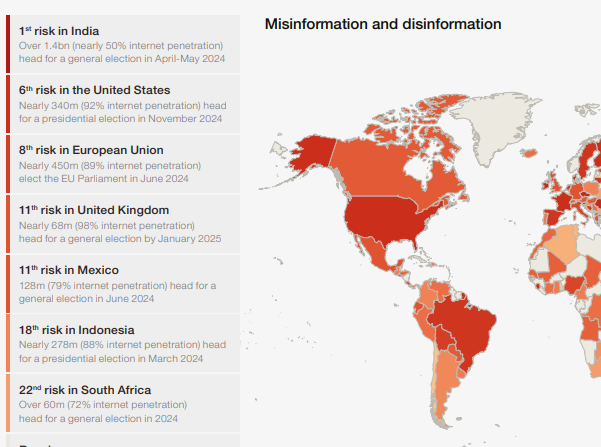
The annual Global Risks Report explores some of the most severe risks we may face in the coming years. Underpinned by the Forum’s Global Risks Perception Survey, the report brings together leading insights from over 1,200 experts across the world. The focus is on a narrative discussion of risks (economic, climate, political, etc.) facing the world as a whole, but there are some visuals or maps comparing countries or regions.
Each annual report has a summary with key findings. Data from the Perception Survey is presented as charts and graphs in the areas of Current Risks, Severity, the Global Risk Landscape, the Outlook for the World, Political Cooperation, Risk Governance, and Risk Profile. The WEF does not provide the actual raw data from the survey. “Shareables” include visuals on topics such as the “Top 10 Risks” and in “Interconnections” graphic of the global risks landscape.
OECD Economic Surveys
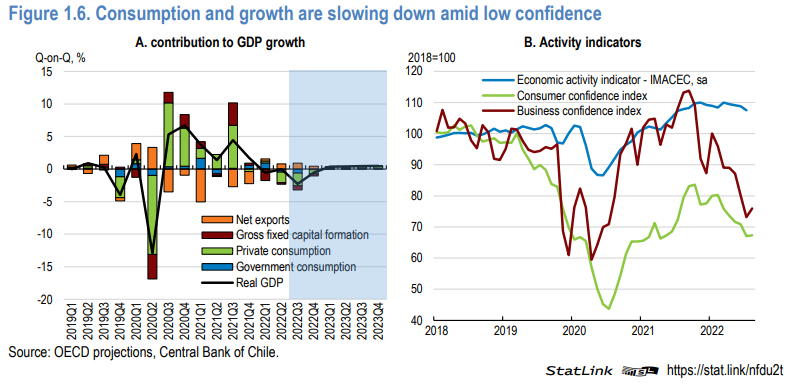
These country-level reports are thorough assessments of a country’s economy and its economic prospects. They are in PDF format, but the data used in the graphs and charts can be downloaded in Excel format from within the PDFs. The 100+ page reports cover OECD member countries and some leading trade partners (such as China) and are published frequently, although not necessarily every year. For some countries, the series goes back as far as 1962.

