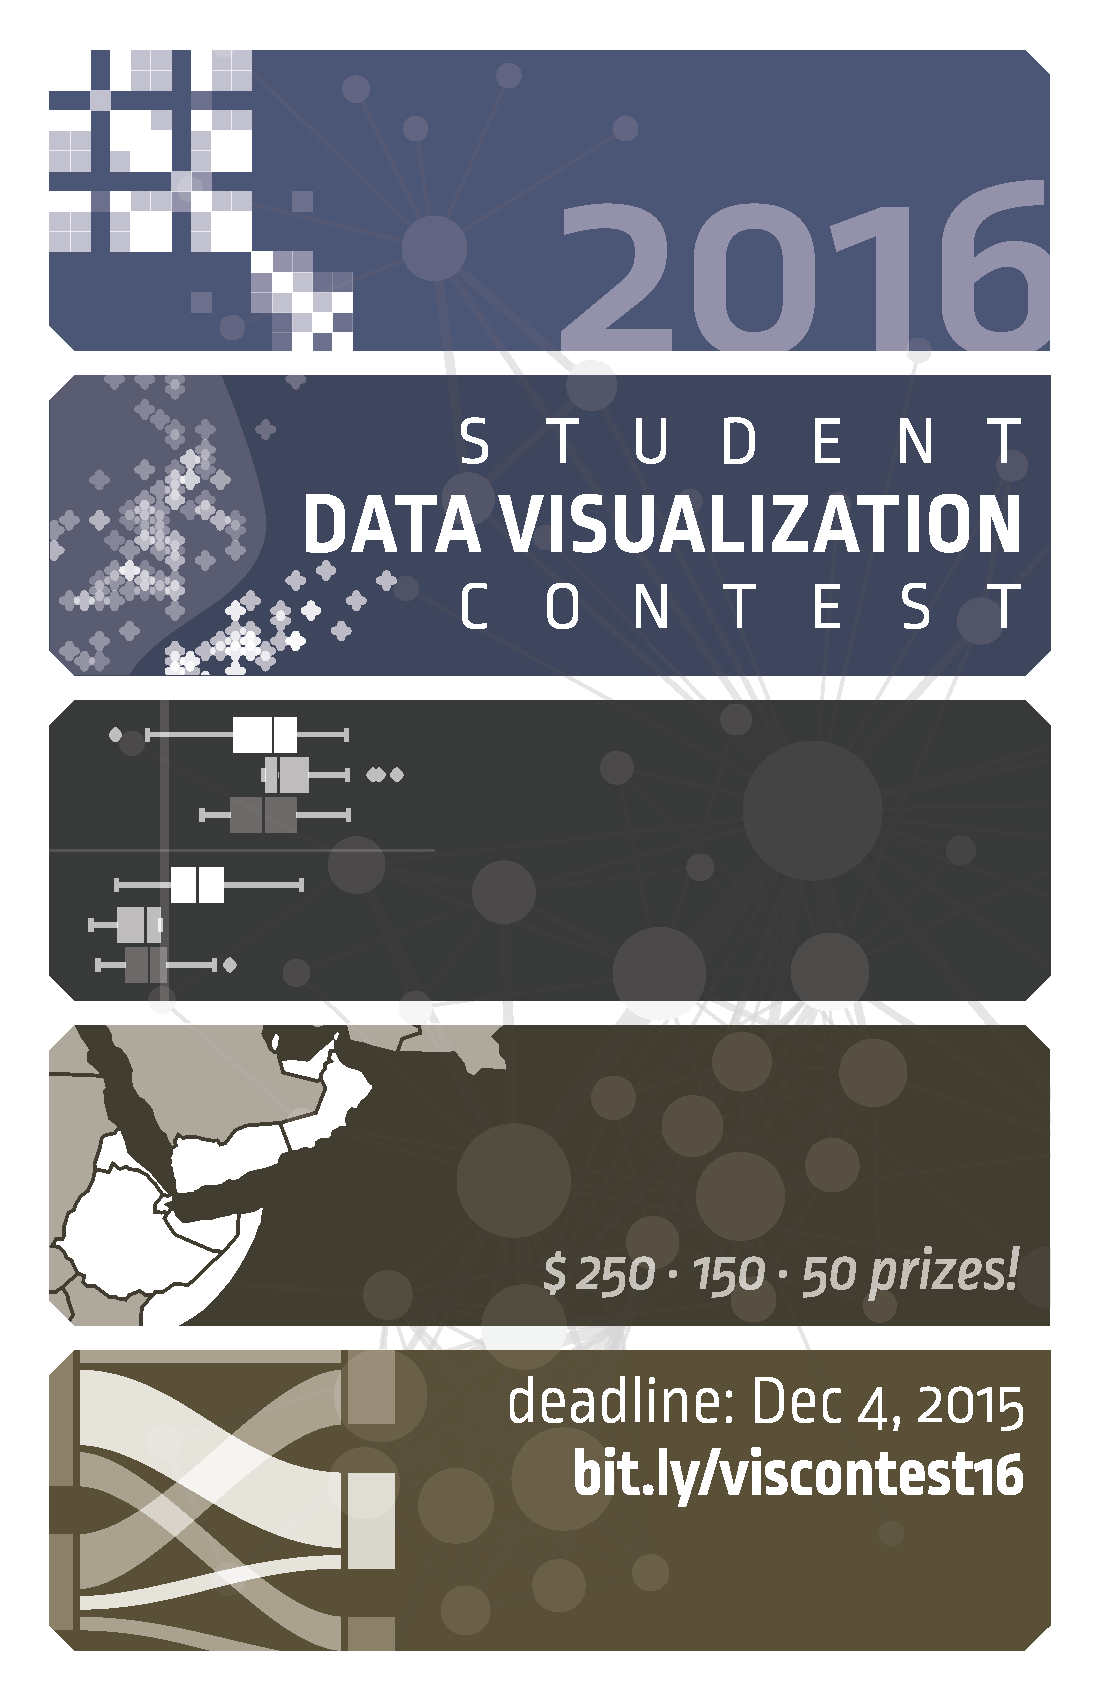
 Calling all Duke undergrad and grad students! Have you worked on a course or research project that included some kind of visualization? Maybe you made a map for a history class paper. Maybe you invented a new type of chart to summarize the results of your experiment. Maybe you played around with an infographic builder just for fun.
Now is the time to start thinking about submitting those visualizations to the Duke Student Data Visualization Contest. It’s easy — just grab a screenshot or export an image of your visualization, write up a short description explaining how you made it, and submit it using our Sakai project site (search for “2016 DataVis Contest”). The deadline is right after finals this fall, so just block in a little extra time at the end of the semester once you’re done with your final assignments and projects.
Not sure what would work as a good submission? Check out our Flickr gallery with examples from the past two years.
Not sure if you’re eligible? If were a Duke student (that is, enrolled in a degree-granting program, so no post-docs) any time during 2015, and you did the work while you were a student, you’re golden!
Want to know more about the technical details and submission instructions? Check out the full contest instructions.

