
Online mapping and data access has become even easier with the launch of SimplyMap 2.0. A long time favorite of Economics and Public Policy courses (and faculty) at Duke, this program provides a straight forward interface for web-based mapping and data extraction application that lets users create thematic maps and reports using US census, business, and marketing data.
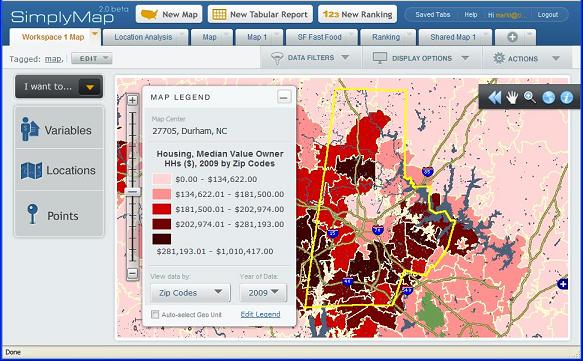
Version 2.0 includes improvements designed to make it easier to find and analyze data and create professional looking GIS-style thematic maps.
Significant changes include:
- A new multi-tab interface to allow you to easily switch between your projects
- Interactive wizards to guide you through making maps and reports
- Can choose to automatically select the geographic unit displayed on a map based on the zoom level
- Easier searching and browsing to choose data variables
- Assign keyword tags to organize your maps and reports
- Share your work with other users of SimplyMap (send a URL that lets them open a copy of your map or report)
- Data filters (greater than, less than, etc.) can now be applied to both maps and reports
- More export options: Data: Excel, DBF, CSV; Maps: GIF, PDF, Shapefiles (boundaries only, no attributes)
- Faster performance
Give SimplyMap 2.0 a try and let us know what you think. Support is always available in Perkins Data and GIS.