All posts by Michael Daul

Hydra Connect #2: Cleveland Rocks

I recently traveled to Cleveland to attend the second-ever Hydra Connect meeting. For some quick background, Hydra is a repository solution that many libraries and other institutions are using to manage large and interesting collections of digital things. At DUL, our amazing Repository Services team has been working on our Hydra-based repository for around two years. Mike Adamo of DPPS and others have been getting lots of content into the system and from what I understand it’s working great so far. David and Jim have also worked on a Digital Asset Management tool that will be used by the Duke CIT to archive video assets from MOOCs.

The Kelvin Smith Library at Case Western Reserve University

DPPS has grand plans to migrate our current digital collections platform to a Hydra-based system, so we’ll be working closely with David and the Jims to utilize their expertise. I attended Hydra Connect as a way to get some exposure to the community and to try and soak up as much knowledge as possible. I’d say the grand takeaway (and I heard this sentiment repeated time and time again) is that Hydra is an amazing open source community. Every single person I met at the meeting was friendly, knowledgeable, and happy to answer questions. It was a fantastic experience. The host institution, Case Western Reserve University, was great and in general Cleveland was excellent – the area we stayed in was very walkable, there were several interesting museums nearby, and by and large the weather was perfect.

Interactive wall at the Cleveland Museum of Art

Hydra Connect #2 nearly doubled the attendance number from Hydra Connect #1 so clearly there is momentum behind the project. But what seems really apparent is that the community is very welcoming. Beginners like me are treated warmly – you are not scoffed at for asking basic questions.

I started off the meeting by attending a half day Dive into Hydra workshop and followed that with an intro to blacklight. The organizers cleverly passed out USB drives with a pre-packaged development environment all ready to go, so everyone in the room was up and running right away. We made it all the way through the program and even completed a few of the bonus tasks. The organizers did a great job of explaining how our simplified examples could be applied to more complex projects and also stressed best practices for making UI tweaks (protip – use the internationalizations). All in all a very empowering experience.

Cleveland street art

Wednesday was filled with lots of knowledge sharing. Between the lightning talks and the poster sessions it was amazing to see how many really interesting Hydra projects are out there! In particular, I was struck by these:

Thursday had  more sessions, more lightning talks, and an ‘unconference.’ I really enjoyed the sessions on UX and Project Management.

Overall I had a great experience at Hydra Connect. I learned a ton, met some great people, and most importantly I’m psyched to get to work on a Hydra project here at DUL.

Anatomy of an Exhibit Kiosk

I’ve had the pleasure of working on several exhibit kiosks during my time at the library. Most of them have been simple in their functionality, but we’re hoping to push some boundaries and get more creative in the future. Most recently, I’ve been working on building a kiosk for the Queering Duke History: Understanding the LGBTQ Experience at Duke and Beyond exhibit. It highlights oral history interviews with six former Duke students. This particular kiosk example isn’t very complicated, but I thought it would be fun to outline how it’s put together.

Screen shot of the 'attract' loop
Screen shot of the ‘attract’ loop

Hardware

Most of our exhibits run on one of two late 2009 27″ iMacs that we have at our disposal. The displays are high-res (1920×1080) and vivid, the built-in speakers sound fine, and the processors are strong enough to display multimedia content without any trouble. Sometimes we use the kiosk machines to loop video content, so there’s no user interaction required. With this latest iteration, as users will be able to select audio files for playback, we’ll need to provide a mouse. We do our best to secure them to our kiosk stand, and in my tenure we’ve not had any problems. But I understand in the past that sometimes input devices have been damaged or gone missing. As we migrate to touch-screen machines in the future these sorts of issues won’t be a problem.

Software

We tend to leave our kiosk machines out in the open in public spaces. If the machine isn’t sufficiently locked down, it can lead to it being used for purposes other than what we have in mind. Our approach is to setup a user account that has very narrow privileges and set it as the default login (so when the machine starts up it boots into our ‘kiosk’ account). In OS X you can setup user permissions, startup programs, and other settings via ‘Users and Groups’ in the System Preferences. We also setup power saving settings so that the computer will sleep between midnight and 6:00am using the Energy Saving Scheduler.

My general approach for interactive content is to build web pages, host them externally, and load them on to the kiosk in a web browser. I think the biggest benefits of this approach are that we can make updates without having to take down the kiosk and also track user interactions using Google analytics. However, there are drawbacks as well. We need to ensure that we have reliable network connectivity, which can be a challenge sometimes. By placing the machine online, we also add to the risk that it can be used for purposes other than what we intend. So in order to lock things down even more, we utilize xStand to display our interactive content. It allows for full screen browsing without any GUI chrome, black-listing and/or white-listing sites, and most importantly, it restarts automatically after a crash. In my experience it’s worked very well.

User Interface

This particular exhibit kiosk has only one real mission – to enable users to listen to a series of audio clips. As such, the UI is very simple. The first component is a looping ‘attract’ screen. The attract screen serves the dual purpose of drawing attention to the kiosk and keeping pixels from getting burned in on the display. For this kiosk I’m looping a short mp4 video file. The video container is wrapped in a link and when it’s clicked a javscript hides the video and displays the content div.


The content area of the page is very simple – there are a group of images that can be clicked on. When they are, a lightbox window (I like Fancy Box) pops up that holds the relevant audio clips. I’m using simple html5 audio playback controls to stream the mp3 files.

Screen shot of the 'home' screen UI
Screen shot of the ‘home’ screen UI
Screen shot of the audio playback UI

Finally, there’s another javascript running in the background that detects and user input. After 10 minutes of inactivity, the page reloads which brings back the attract screen.

The Exhibit

Queering Duke History runs through December 14, 2014 in the Perkins Library Gallery on West Campus. Stop by and check it out!

Bento is Coming!

A unified search results page, commonly referred to as the “Bento Box” approach, has been an increasingly popular method to display search results on library websites. This method helps users gain quick access to a limited result set across a variety of information scopes while providing links to the various silos for the full results. NCSU’s QuickSearch implementation has been in place since 2005 and has been extremely influential on the approach taken by other institutions.

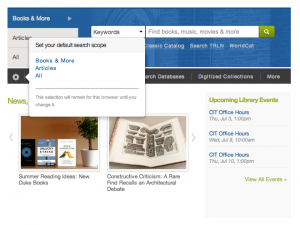
Way back in December of 2012, the DUL began investigating and planning for implementing a Bento search results layout on our website. Extensive testing revealed that users favor searching from a single box — as is their typical experience conducting web searches via Google and the like. Like many libraries, we’ve been using Summon as a unified discovery layer for articles, books, and other resources for a few years, providing an ‘All’ tab on our homepage as the entry point. Summon aggregates these various sources into a common index, presented in a single stream on search results pages. Our users often find this presentation overwhelming or confusing and prefer other search tools. As such, we’ve demoted the our ‘All’ search on our homepage — although users can set it as the default thanks to the very slick Default Scope search tool built by Sean Aery (with inspiration from the University of Notre Dame’s Hesburgh Libraries website):

Default Search Tool

The library’s Web Experience Team (WebX) proposed the Bento project in September of 2013. Some justifications for the proposal were as follows:

Bento boxing helps solve these problems:

  • We won’t have to choose which silo should be our default search scope (in our homepage or masthead)
  • Synthesizing relevance ranking across very different resources is extremely challenging, e.g., articles get in the way of books if you’re just looking for books (and vice-versa).
  • We need to move from “full collection discovery to full library discovery” – in the same search, users discover expertise, guides/experts, other library provisions alongside items from the collections. 1
  • “A single search box communicates confidence to users that our search tools can meet their information needs from a single point of entry.” 2

Citations:

  1. Thirteen Ways of Looking at Libraries, Discovery, and the Catalog by Lorcan Dempsey.
  2. How Users Search the Library from a Single Search Box by Cory Lown, Tito Sierra, and Josh Boyer

Sean also developed this mockup of what Bento results could look like on our website and we’ve been using it as the model for our project going forward:

Bento Mockup

For the past month our Bento project team has been actively developing our own implementation. We have had the great luxury of building upon work that was already done by brilliant developers at our sister institutions (NCSU and UNC) — and particular thanks goes out to Tim Shearer at UNC Libraries who provided us with the code that they are using on their Bento results page, which in turn was heavily influenced by the work done at NCSU Libraries.

Our approach includes using results from Summon, Endeca, Springshare, and Google. We’re building this as a Drupal module which will make it easy to integrate into our site. We’re also hosting the code on GitHub so others can gain from what we’ve learned — and to help make our future enhancements to the module even easier to implement.

Our plan is to roll out Bento search in August, so stay tuned for the official launch announcement!


PS — as the 4th of July holiday is right around the corner, here are some interesting items from our digital collections related to independence day:


Using Google Spreadsheets with Timelines

Doris Duke timeline
Doris Duke timeline

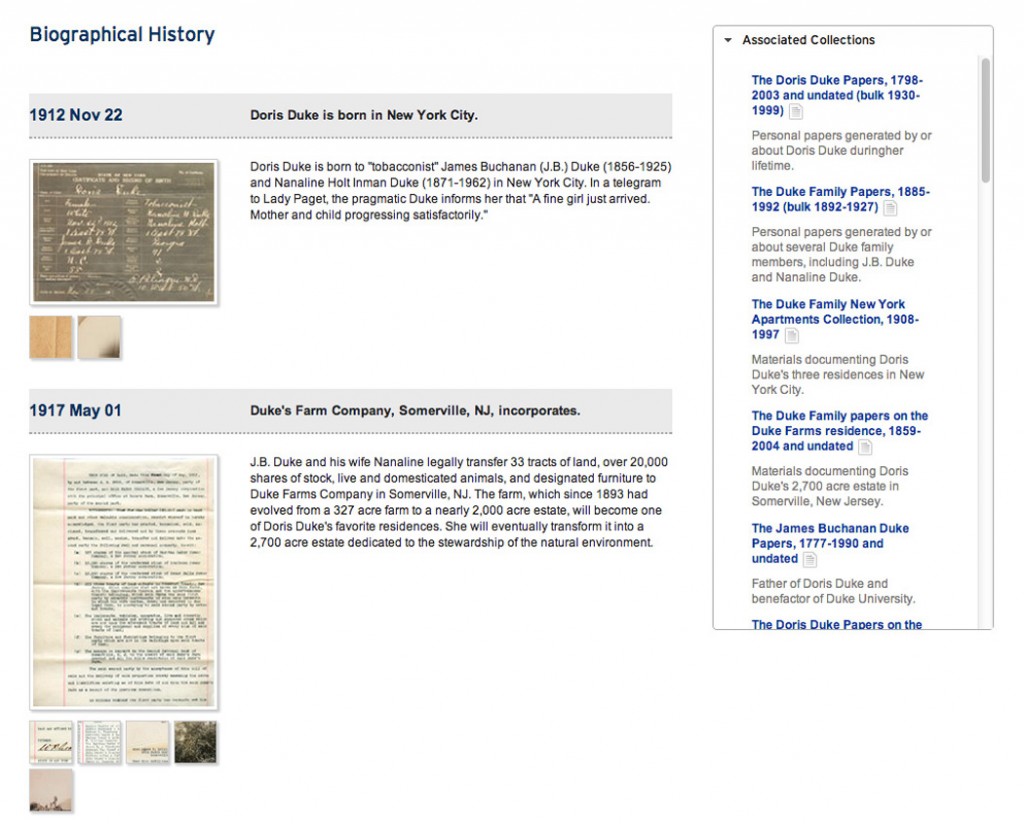
We’ve been making use of the fabulous Timeline.js library for a while now. The first timeline we published, compiled by Mary Samouelian about the life of Doris Duke, uses Timeline.js to display text and images in an elegant interactive format. Back then the library was called Verite Timeline and our implementation involved parsing XML files using Python to render out the content on the page. And in general, this approach worked great. However, managing and updating the XML files isn’t all that easy. Things also get complicated when more than one person wants to work on them — especially at the same time.

Enter Google Spreadsheets! Timeline.js is now designed to easily grab data from a publicly-published Google spreadsheet and create great looking output out of the box. Managing the timeline data in the spreadsheet is a huge step up from XML files in terms of ease of use for our researchers and for maintainability. And it helps that librarians love spreadsheets. If someone errantly enters some bad data, it’s simple to undo that particular edit as all changes are tracked by default. If a researcher wants to add a new timeline event, they can easily go into the spreadsheet and enter a new row. Changes are reflected on the live page almost immediately.

Spreadsheet data

Timeline.js provides a very helpful template for getting started with entering your data. They require that you include certain key columns and that the columns be named following their data schema. You are free to add additional columns, however, and we’ve played around with doing so in order to include categorical descriptions and the like.

Here is a sample of some data from our Doris Duke timeline.

Data for Doris Duke Timeline

For entries with more than one image, we don’t include a ‘Start Date’ which means Timeline.js will skip over them. We then render these out as smaller thumbnails on our timeline page.

Images on Doris Duke timeline page

Going all-in with spreadsheets

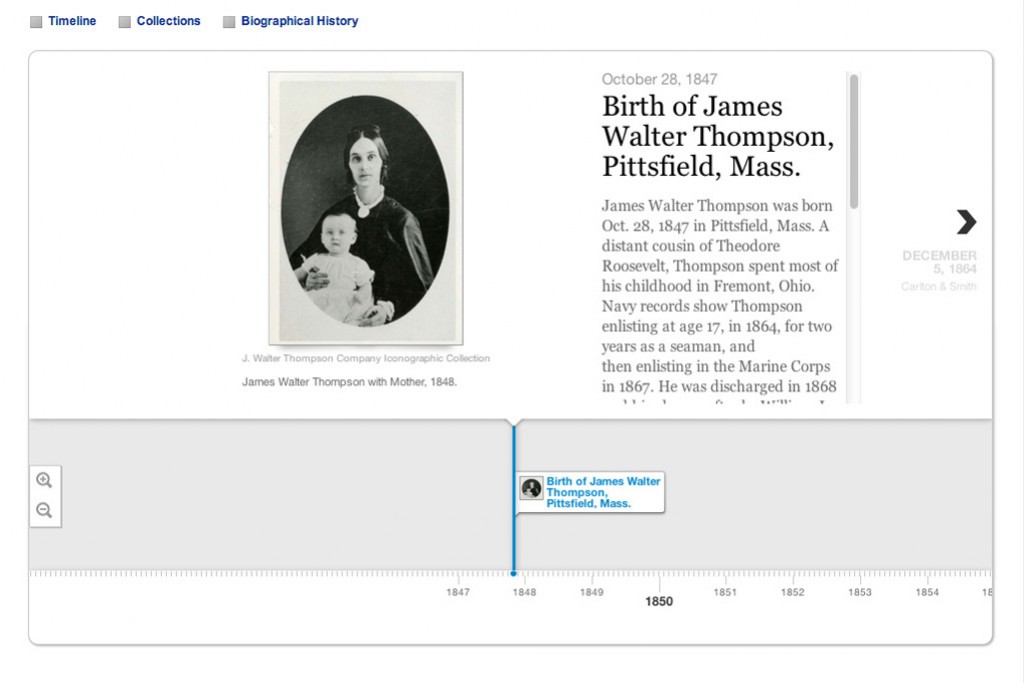
We’ve published our subsequent timelines using a combination of the Google spreadsheet data to generate the Timeline.js output while also using the XML files to load in and display relational data (using the EAC-CPF standard) while using Python to generate the pages. However, for our latest timeline on the J. Walter Thompson Company (preview the dev version), we’ve decided to house all of the data (including the CPF relations) in a Google Spreadsheet and use PHP to parse everything. This approach will mean that we no longer need to rely on the XML files, so our researchers can quickly make updates to the timeline pages. We can easily convert the spreadsheet data back into an XML file if the need arises.

J. Walter Thompson Company Timeline

Code snippets

Note: there’s an updated syntax for newly created spreadsheets.

We’re taking advantage of the Google spreadsheet data API that allows for the data to easily be parsed as JSON. Querying the spreadsheet in PHP looks something like this:

$theURL = "http://spreadsheets.google.com/feeds/list/[your-spreadsheet-key]/
od6/public/values?alt=json&callback=displayContent";

$theJSON = file_get_contents($theURL, 0, $ctx); //the $ctx variable sets a timeout limit

$theData = json_decode($theJSON, TRUE);

And then we can loop through and parse out the data using something like this:

foreach ($theData['feed']['entry'] as $item) {

	echo $item['gsx$startdate']['$t'];
	// Note that the column names in the spreadsheet are targeted by adding 'gsx$' 
	   and 'the column name in lc with no spaces'
	   You may also want to use 'strtotime' on the dates so that you can 
	   transform them using 'date'

	echo $item['gsx$enddate']['$t'];

	echo $item['gsx$headline']['$t'];

	echo $item['gsx$text']['$t'];

	... // and so on
}

One important thing to note is that by default, the above query structure only gets data from the primary worksheet in the spreadsheet (which is targeted using the od6 variable). Should you want to target other worksheets, you’ll need to know which ‘od’ variable to use in your query. You can view the full structure of your spreadsheet by using a url like this:

https://spreadsheets.google.com/feeds/worksheets/[your-spreadsheet-key]/public/basic

Then match up the ‘od’ instance to the correct content and query it.

Timelines and Drupal

We’ve also decided to integrate the publishing of timelines into our Drupal CMS, which drives the Duke University Libraries website, by developing a custom module. Implementing the backend code as a module will make it easy to apply custom templates in the future so that we can change the look and feel of a timeline for a given context. The module isn’t quite finished yet, but it should be ready in the next week or two. All in all, this new process will allow timelines to be created, published, and updated quickly and easily.


UPDATE

I recently learned that sometime in early 2014, google changed the syntax for published spreadsheet URLs and they are no longer using spreadsheet key as an identifier. As such, the syntax for retrieving a JSON feed has changed.

The new syntax looks like this:

https://spreadsheets.google.com/feeds/cells/[spreadsheet-ID]/[spreadsheet-index]/public/basic?alt=json&callback=displayContent

‘spreadsheet-ID’ is the string of text that shows up when you publish your spreadsheet:

https://docs.google.com/spreadsheets/d/[spreadsheet-ID]/pubhtml

‘spreadsheet-index’ you can see when editing your spreadsheet – it’s the value that is assigned to ‘gid’ or in the case below, it’s ‘0’:

https://docs.google.com/spreadsheets/d/[spreadsheet-ID]/edit#gid=0

I hope this helps save some frustration of finding documentation on the new syntax.

Post contributed by Michael Daul