It’s annual statistics time! As you can imagine Covid-19 influenced our stats for this year. I don’t think any of us anticipated we would spend the first few months of the fiscal year working exclusively from home, and when we did return it was on a staggered schedule to avoid too many people in the lab at the same time. That said, we did get a lot done. While treatment numbers are down as expected, we did get a lot of training, conference attendance, and administrative work done from home.
FY2021 Statistics
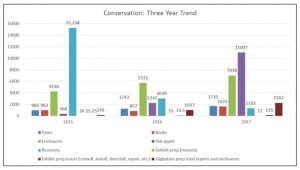
409 Book repairs
503 Pamphlet bindings
0 Treatments: Other (objects, textiles, etc.)
410 Flat Paper repairs
1,293 Protective enclosures
300 Disaster recovery
2 Exhibit mounts
48 Hours in support of Exhibits (meetings, treatment, installation, etc.)
443 Digital preparation repairs
23.25 Hours in support of Digital Projects (meetings, consultations, handling, etc.)
41 % of production was for Special Collections
59 % of production was for Circulating Collections
62.2% of work was Level 1 [less than 15 minutes to complete; 1813 items]
34.2% of work was Level 2 [15 minutes – 2 hours to complete; 998 items]
3.2% of work was Level 3 [2 – 5 hours to complete; 94 items]
0.3% of work was Level 4 [more than 5 hours; 10 items]
This is the first year that we added a Level 4 treatment (5+ hours). This differs from the old ARL/ALA Preservation Statistics where Level 3 (3+ hours) was the longest hourly bucket you could put treatments into. We felt this didn’t give us enough of an idea of how very lengthy treatments fit in to our overall output.

Creating custom enclosures has always been a large percentage of our yearly output. This year the total percentage of work that were enclosures was 44%, very close to the historical percent average. With the Lilly Renovation Project ramping up again, we expect to see larger numbers in this category for the next couple of years.

Other Things We Did Last Year
- We hosted 0 tours of the lab totaling 0 people
- We presented 7 Care and Handling Training sessions to DUL staff totaling 5 people
- We hosted our third HBCU Library Alliance/University of Delaware-Winterthur conservation intern.
- We worked on some cool things like moving some paintings in preparation of the Lilly Library renovation, expanding our environmental monitoring program, creating some awesome sewing models, finding the time to finish repairs, disaster recovery, and we found some new uses for tools.
- We spent our Work From Home hours teaching ourselves new bindings, reviewing our documentation, and taking advantage of all the resources that were opened up in 2020. We really value the sharing that happened in 2020/2021 and hope we have learned that we don’t need to hide our all our professional resources behind paywalls forever.
- Unfortunately we didn’t hire student assistants this year. Fingers crossed for spring of 2022.
- We also said goodbye to Mary Yordy, who retired after many years of service to the Library.