
Duke Libraries is not paid to advertise Onset products, we just really like them.
We all know how important a stable environment is for the long-term preservation of our collections. An environmental monitoring program is essential for collecting both short-term and long-trend data in critical areas of the library.
For many years now we have used Onset HOBO MX1101 dataloggers to monitor temperature and humidity conditions over long periods of time. These are bluetooth enabled, very accurate, and cost effective. We currently have about 30 of these monitors in a variety of locations around our library including our Exhibit Suite.
Last year we installed an Onset MX Gateway in the Exhibit Suite. This device allows us to look at data remotely from our desktop. It reads any HOBO within 100 feet of the Gateway, and uploads the data into the cloud. In fact, we get even more than 100 feet from our Gateway. It currently not only reads all the dataloggers in our exhibit suite, but three dataloggers outside the suite in the foyer, and three that are one level down in the Conservation and DPC labs.

Setting Up the Gateway and HOBO Dataloggers
The Gateway interface is fairly easy to use. If you set up your HOBOs correctly, assign them to groups, and are mindful of naming conventions, you can easily group related dataloggers together. This is helpful when you ask the Gateway to download reports.

Among the categories are Exhibit Cases (dataloggers inside the cases), Biddle Exhibit Suite (dataloggers in the various rooms in the suite), and the Labs (Conservation, Digital Production Center, and the Exhibits office). The Gateway allows you to set up dashboards to group similar dataloggers together.
Expanding the Monitoring Program
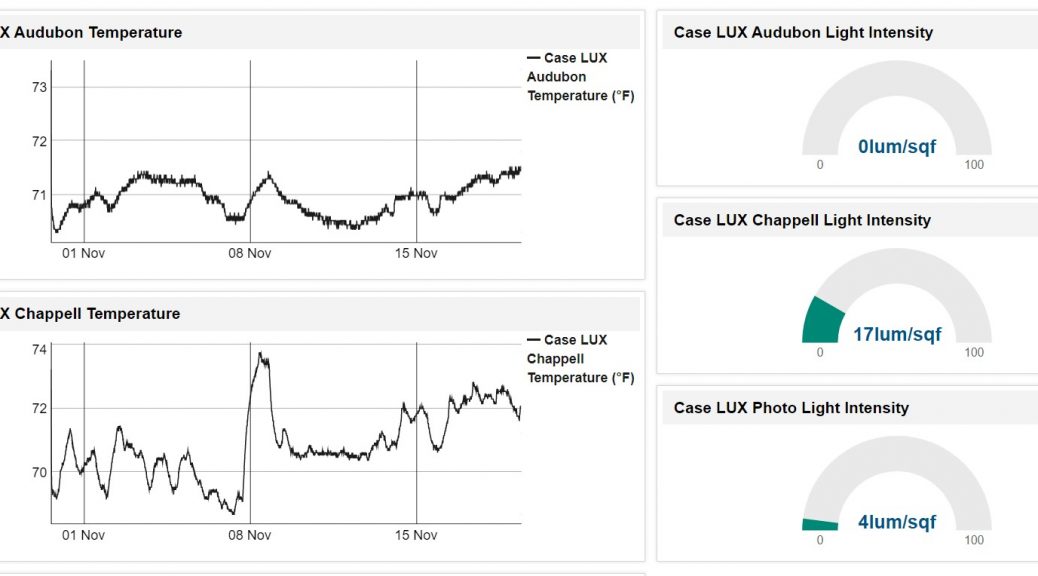
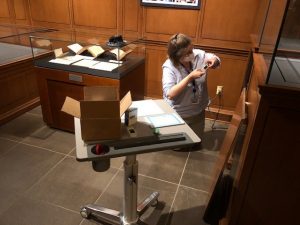
This summer we are expanding our exhibit monitoring to include the Onset MX2202 LUX/Temp meters. These are going inside a few exhibit cases to monitor light levels (LUX) and temperature (F). We have a couple cases near internal windows, and several outside in the library foyer. Before we got the MX2202 monitors we could only do spot readings with our Elsec light meter. We can now understand what sort of cumulative light exposure these cases get throughout the year.

Since the Gateway allows you to download the data into Excel, you can set up templates to do your data analysis. I’ve set up a template that includes the min/max/median/mode for both the LUX and temperature readings. The graph gives you a quick visual for the time period you requested in the Gateway report.

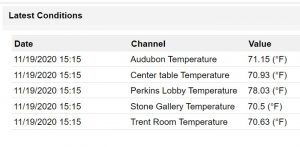
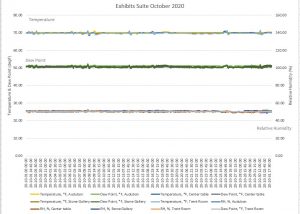
We have similar spreadsheets for the HOBOs in the Exhibit Suite that record temperature and relative humidity. We download the environmental data by month, and look to see if any trends or concerns arise. The Gateway also allows you to look at the data in real time so we can view it weekly to catch any problems.
Until we installed the Gateway we had to go upstairs and download each HOBO individually with our phone or iPad. This is so much easier and more efficient.