Tag Archives: annual report

FY2022: By The Numbers

It’s annual statistics time! We love a good stat.

One Stat That Stands Out

42% of overall productivity in FY2022 was disaster recovery, mostly attributed to mold removal.

FY 2022 Statistics

371 Book repairs
964 Pamphlet bindings
16 Treatments: Other (objects, textiles, etc.)
694 Flat Paper repairs (includes paper, parchment, and photos)
3,094 Protective enclosures
3,784 Disaster recovery
3 Exhibit mounts [these are primarily done in the Exhibits Department now]
44 Hours in support of Exhibits (meetings, treatment, installation, etc.)
123 Digital preparation repairs
8 Hours in support of Digital Projects (meetings, consultations, handling, etc.)

73% of production was for Special Collections
27% of production was for Circulating Collections

42.7% of work was Level 1 [less than 15 minutes to complete;  3,810 items]
54.5% of work was Level 2 [15 minutes – 2 hours to complete;  4,864 items]
2.7% of work was Level 3 [2 – 5 hours to complete;  240 items]
0.1% of work was Level 4 [more than 5 hours; 12 items]

Staffing: 5 full time conservation staff, 1 student assistant

We are still seeing the effects of the pandemic on our total production. But we are also seeing a bounce back from the last two years. We remain hopeful that FY2023 will be closer to “normal,” whatever that is these days.

Totals FY19 FY20 FY21 FY22
Level 1 9556 5422 1841 3810
Level 2 15725 1522 972 4864
Level 3 246 146 94 240
Level 4 19 31 10 12
total 25546 7121 2917 8926
Total Productivity 2003 to 2022

This year we surpassed the 280,800 mark for total production since the department began in 2002. Overall, enclosures are still the largest single type of work we do, holding steady at 44% of output.  Followed by disaster recovery at 20%, and pamphlet binding at 18%.

Other Things We Did This Year
  • We received a LYRASIS Catalyst Fund grant to digitize our legacy conservation treatment documentation. We are calling it the Conservation Documentation Archive (CDA). This includes both written and photographic documentation, reaching back to the earliest treatment records we have. You will be hearing much more about that in the coming year as we get these materials into our digital repository.
  • We had several internal conversations about the lack of diversity in our treatment terminology. We aim to be more cognizant of this going forward. We want to fill in the gaps in our knowledge of book history so that we can be more inclusive in describing the materials we work on.
  • We took a deeper dive into issues of diversity, equity, and inclusion within the conservation profession and our department this year through readings and discussions. These will be  ongoing conversations. We are focusing on ideas that can be put into action now, while also identifying stretch goals that may take more time and resources than what we have at the moment.
  • The Lilly Library renovation is back on track. We are in the middle of preparing the collections, and the art and artifacts for the move. Much more to come on this project.
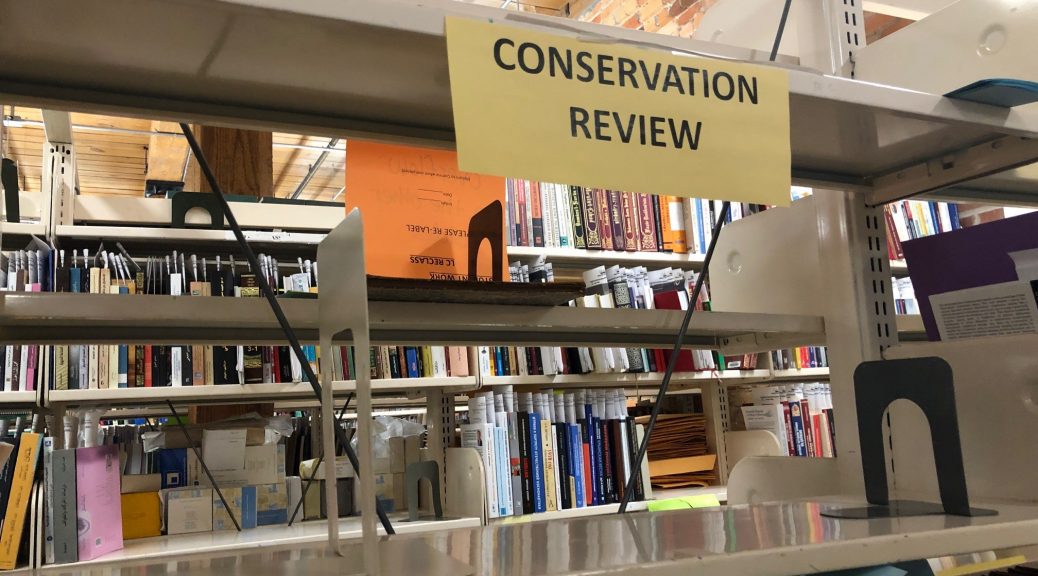
Picture of empty bookshelf with sign that says conservation review
Here’s to FY2023!

FY2021: By The Numbers

It’s annual statistics time! As you can imagine Covid-19 influenced our stats for this year.  I don’t think any of us anticipated we would spend the first few months of the fiscal year working exclusively from home, and when we did return it was on a staggered schedule to avoid too many people in the lab at the same time.  That said, we did get a lot done. While treatment numbers are down as expected, we did get a lot of training, conference attendance, and administrative work done from home.

FY2021 Statistics

409 Book repairs
503 Pamphlet bindings
0 Treatments: Other (objects, textiles, etc.)
410  Flat Paper repairs
1,293 Protective enclosures
300  Disaster recovery
2 Exhibit mounts
48 Hours in support of Exhibits (meetings, treatment, installation, etc.)
443 Digital preparation repairs
23.25 Hours in support of Digital Projects (meetings, consultations, handling, etc.)

41 % of production was for Special Collections
59 % of production was for Circulating Collections

62.2% of work was Level 1 [less than 15 minutes to complete;  1813 items]
34.2% of work was Level 2 [15 minutes – 2 hours to complete;  998 items]
3.2% of work was Level 3 [2 – 5 hours to complete;  94 items]
0.3% of work was Level 4 [more than 5 hours; 10 items]

This is the first year that we added a Level 4 treatment (5+ hours). This differs from the old ARL/ALA Preservation Statistics where Level 3 (3+ hours) was the longest hourly bucket you could put treatments into. We felt this didn’t give us enough of an idea of how very lengthy treatments fit in to our overall output.

Creating custom enclosures has always been a large percentage of our yearly output. This year the total percentage of work that were enclosures was 44%, very close to the historical percent average. With the Lilly Renovation Project ramping up again, we expect to see larger numbers in this category for the next couple of years.

Other Things We Did Last Year

FY 2018 By The Numbers

It’s that time of year again when we report our annual statistics to our administration. We thought we would share these with you, too.

1,093 Book Repairs (down 38% from last year)
1,066 Pamphlets (down 38%)
1,392 Flat Paper (down 87%)
5,975 Protective Enclosures (down 15%)
66 Disaster recovery
8 Exhibit mounts (down 64%)
746 hours of time in support of exhibits (includes meetings, treatment, installation, etc.) (up 452%)
1,002 items repaired for digital projects (down 90%)

38% of total work was for Special Collections
62% of total work was for Circulating Collections

74% of work was Level 1 [less than 15 minutes to complete]
23% of work was Level 2 [15 minutes – 2 hours to complete]
3% of work was Level 3 [more than 2 hours to complete]

Looking at the three year trend you can see the impact of two things. First, we had a steep decline in paper repairs because last fiscal year we were working on a mass digitization preparation project (dark red line). Those numbers skewed our stats for FY2017. In February, Tedd Anderson resigned as our conservation technician, and Mary Yordy reduced her hours. You can see their impact on the stats. Tedd did the majority of custom enclosures (green line) for Rubenstein Library. And both Tedd and Mary repair general collections materials (light red line). We  had a huge exhibit project this fiscal year that included a lot of complicated and time consuming repairs. You see a marked decrease in the percentage overall of items repaired for Rubenstein Library, but there was a marked increase in length of time we spent on those repairs. So the percentage is down, but the number of Level 3 repairs are up.

Not Everything Is A Statistic

We hope you enjoy looking back at the year that was FY2018 as much as we did. We can’t wait to see what FY2019 brings.