
 This month on the 1091 Project we are talking statistics. We collect conservation statistics based on the ARL Preservation Statistics.* These are divided into three levels: Level 1 conservation projects take less than 15 minutes to complete; Level 2 projects take 15 minutes to 2 hours; and Level 3 projects take more than 2 hours to finish.
*ARL Preservation Statistics are no longer collected, but there is a new effort to revise and collect preservation statistics through ALA-PARS. This new system may change what kind of data we collect in the future.
Fiscal Year 2012-2013 Statistics
Last year 20,547 library items came through Conservation. The numbers break down in this way:
2,010 books repaired
2,186 pamphlets bound
638 flat paper repairs
13,383 protective enclosures (includes 2,971 CoLibri book jackets)
2,287 items recovered from mold/water
114 exhibit mounts (70 hours of installation support)
61% of the work came from special collections
39% of the work came from the circulating collections
51.9% were Level 1 projects
48% were Level 2 projects
A small number were Level 3 projects
Total production was about the same as last year, but we did additional work for the renovation project that is not reflected in the above numbers.
Renovation Statistics
Regular readers know we did a lot of work last year to help move our special collections to swing space in preparation for the renovation of the 1928 stacks where the Rubenstein Library is located. Most of this work centered around making enclosures for fragile materials.
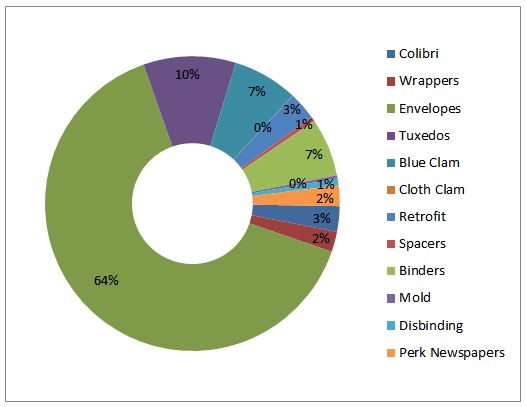
64% of the enclosures were envelopes, 10% were four-flap boxes, and the remaining were a variety of enclosures with some mold removal thrown in for good measure.
We also provided training for Rubenstein Library staff and students who did a lot of enveloping; we conducted several collection condition surveys to determine enclosure needs and estimate supply budgets; we hired and trained several conservation student assistants to help make enclosures and envelope fragile materials; and we helped with the security shifts during the actual move of the collections.
Recognizing Trends
The most interesting thing to me about collecting statistics is tracking trends over time. You can easily see how big projects, changes in staffing and shifting priorities can effect your department.
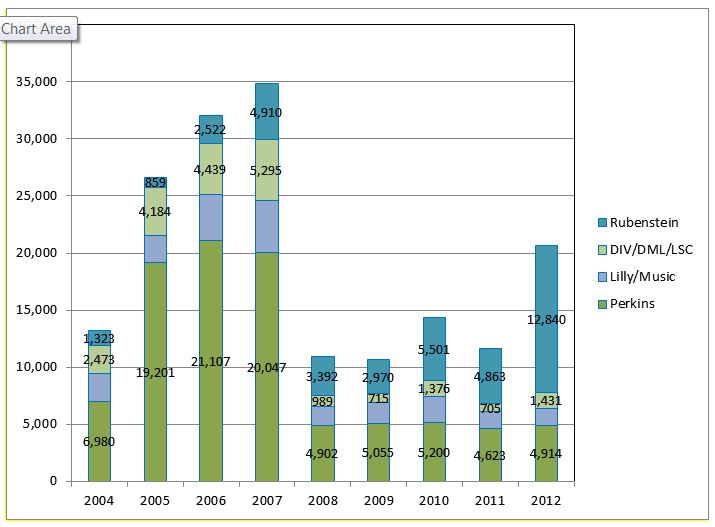
I use these statistics to plan short and long term goals, develop new initiatives, and to make sure we have the right staff and skill sets to meet changing demands.
Let’s see what data Parks Library Preservation collects and how they use their data to inform departmental priorities.