
In April 2013, the Rubenstein Library acquired materials from the Southern Poverty Law Center’s (SPLC) Intelligence Project. In its efforts to monitor hate and other extremist groups, the SPLC collected publications produced by these groups and individuals from about the 1940s to 2000s. Many of these groups can be described as aligning not just on the fringes, but outside of the political spectrum, including advocating white supremacy. However, some publications expressed views that just fell outside mainstream American politics.
When the collection arrived in 2013, Technical Services Archivist Meghan Lyon assessed the contents and concluded that various serial publications were housed across 90 record cartons of materials. Within these record cartons were also ephemeral and archival materials such as pamphlets, clippings, fliers, and correspondence. In considering the various formats present in the collection and the best possible descriptive outcomes, we decided to create two distinct workflows for processing the collection. The ephemeral material was processed as an archival collection. The serial publications were removed and cataloged separately by Serials Cataloger Mandy Hurt, allowing each title to be discoverable in the online catalog.
In planning for the cataloging of the serials publications, we had the opportunity to ensure the consistency of the metadata. Mandy included relevant political terms from the Rare Book and Manuscripts Section controlled vocabularies for genre terms and also applied standard geographical names from the Library of Congress geographical headings.
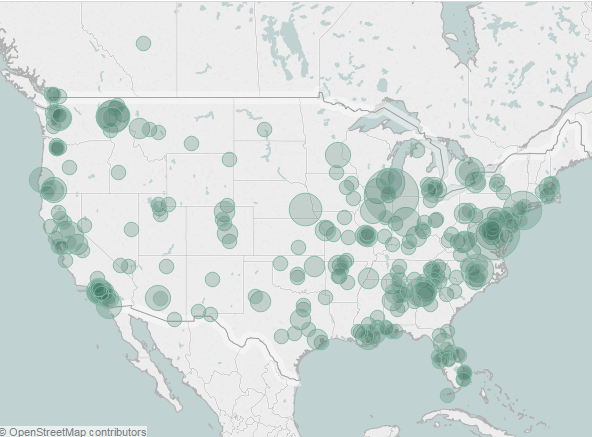
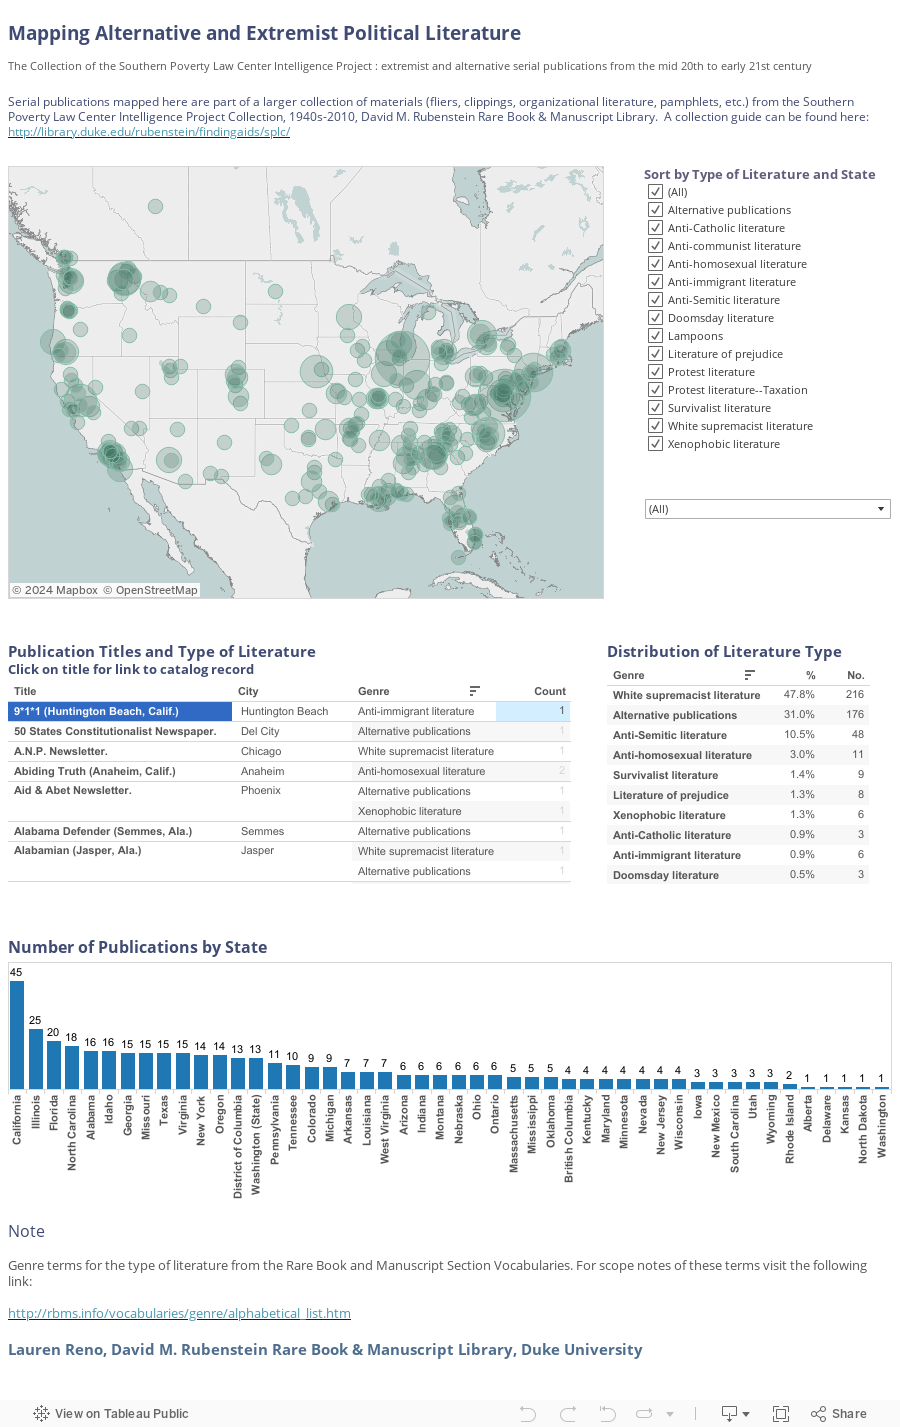
From the beginning we were interested in creating a visualization of the publications represented in the collection – mapping the type of literature and where it was published. After meeting with Angela Zoss from Data and Visualization Services at Duke University Libraries, we settled on using Tableau Public to map the collection. The resulting visualization can be viewed here.
Post contributed by Lauren Reno, Rare Materials Cataloger.