
Blog Post Contributed by Liz Adams, Rare Materials Cataloger
The Rubenstein Library has 2,142 individually cataloged printed maps, collectively covering nearly the entire world. There are aerial views of Alexandria, Egypt and Venice, Italy; fire insurance maps of our own North Carolina and ones of nearby Tennessee and Virginia; and pre-1800 (or what we call “early”) maps of what is now the United States. We have maps charting rivers in Southeast Asia and thematic ones related to public health and nuclear proliferation. Our maps perform dual functions: they orient users to particular places and ideas in particular times and reveal the beliefs of the map creators about those places and the wider world.
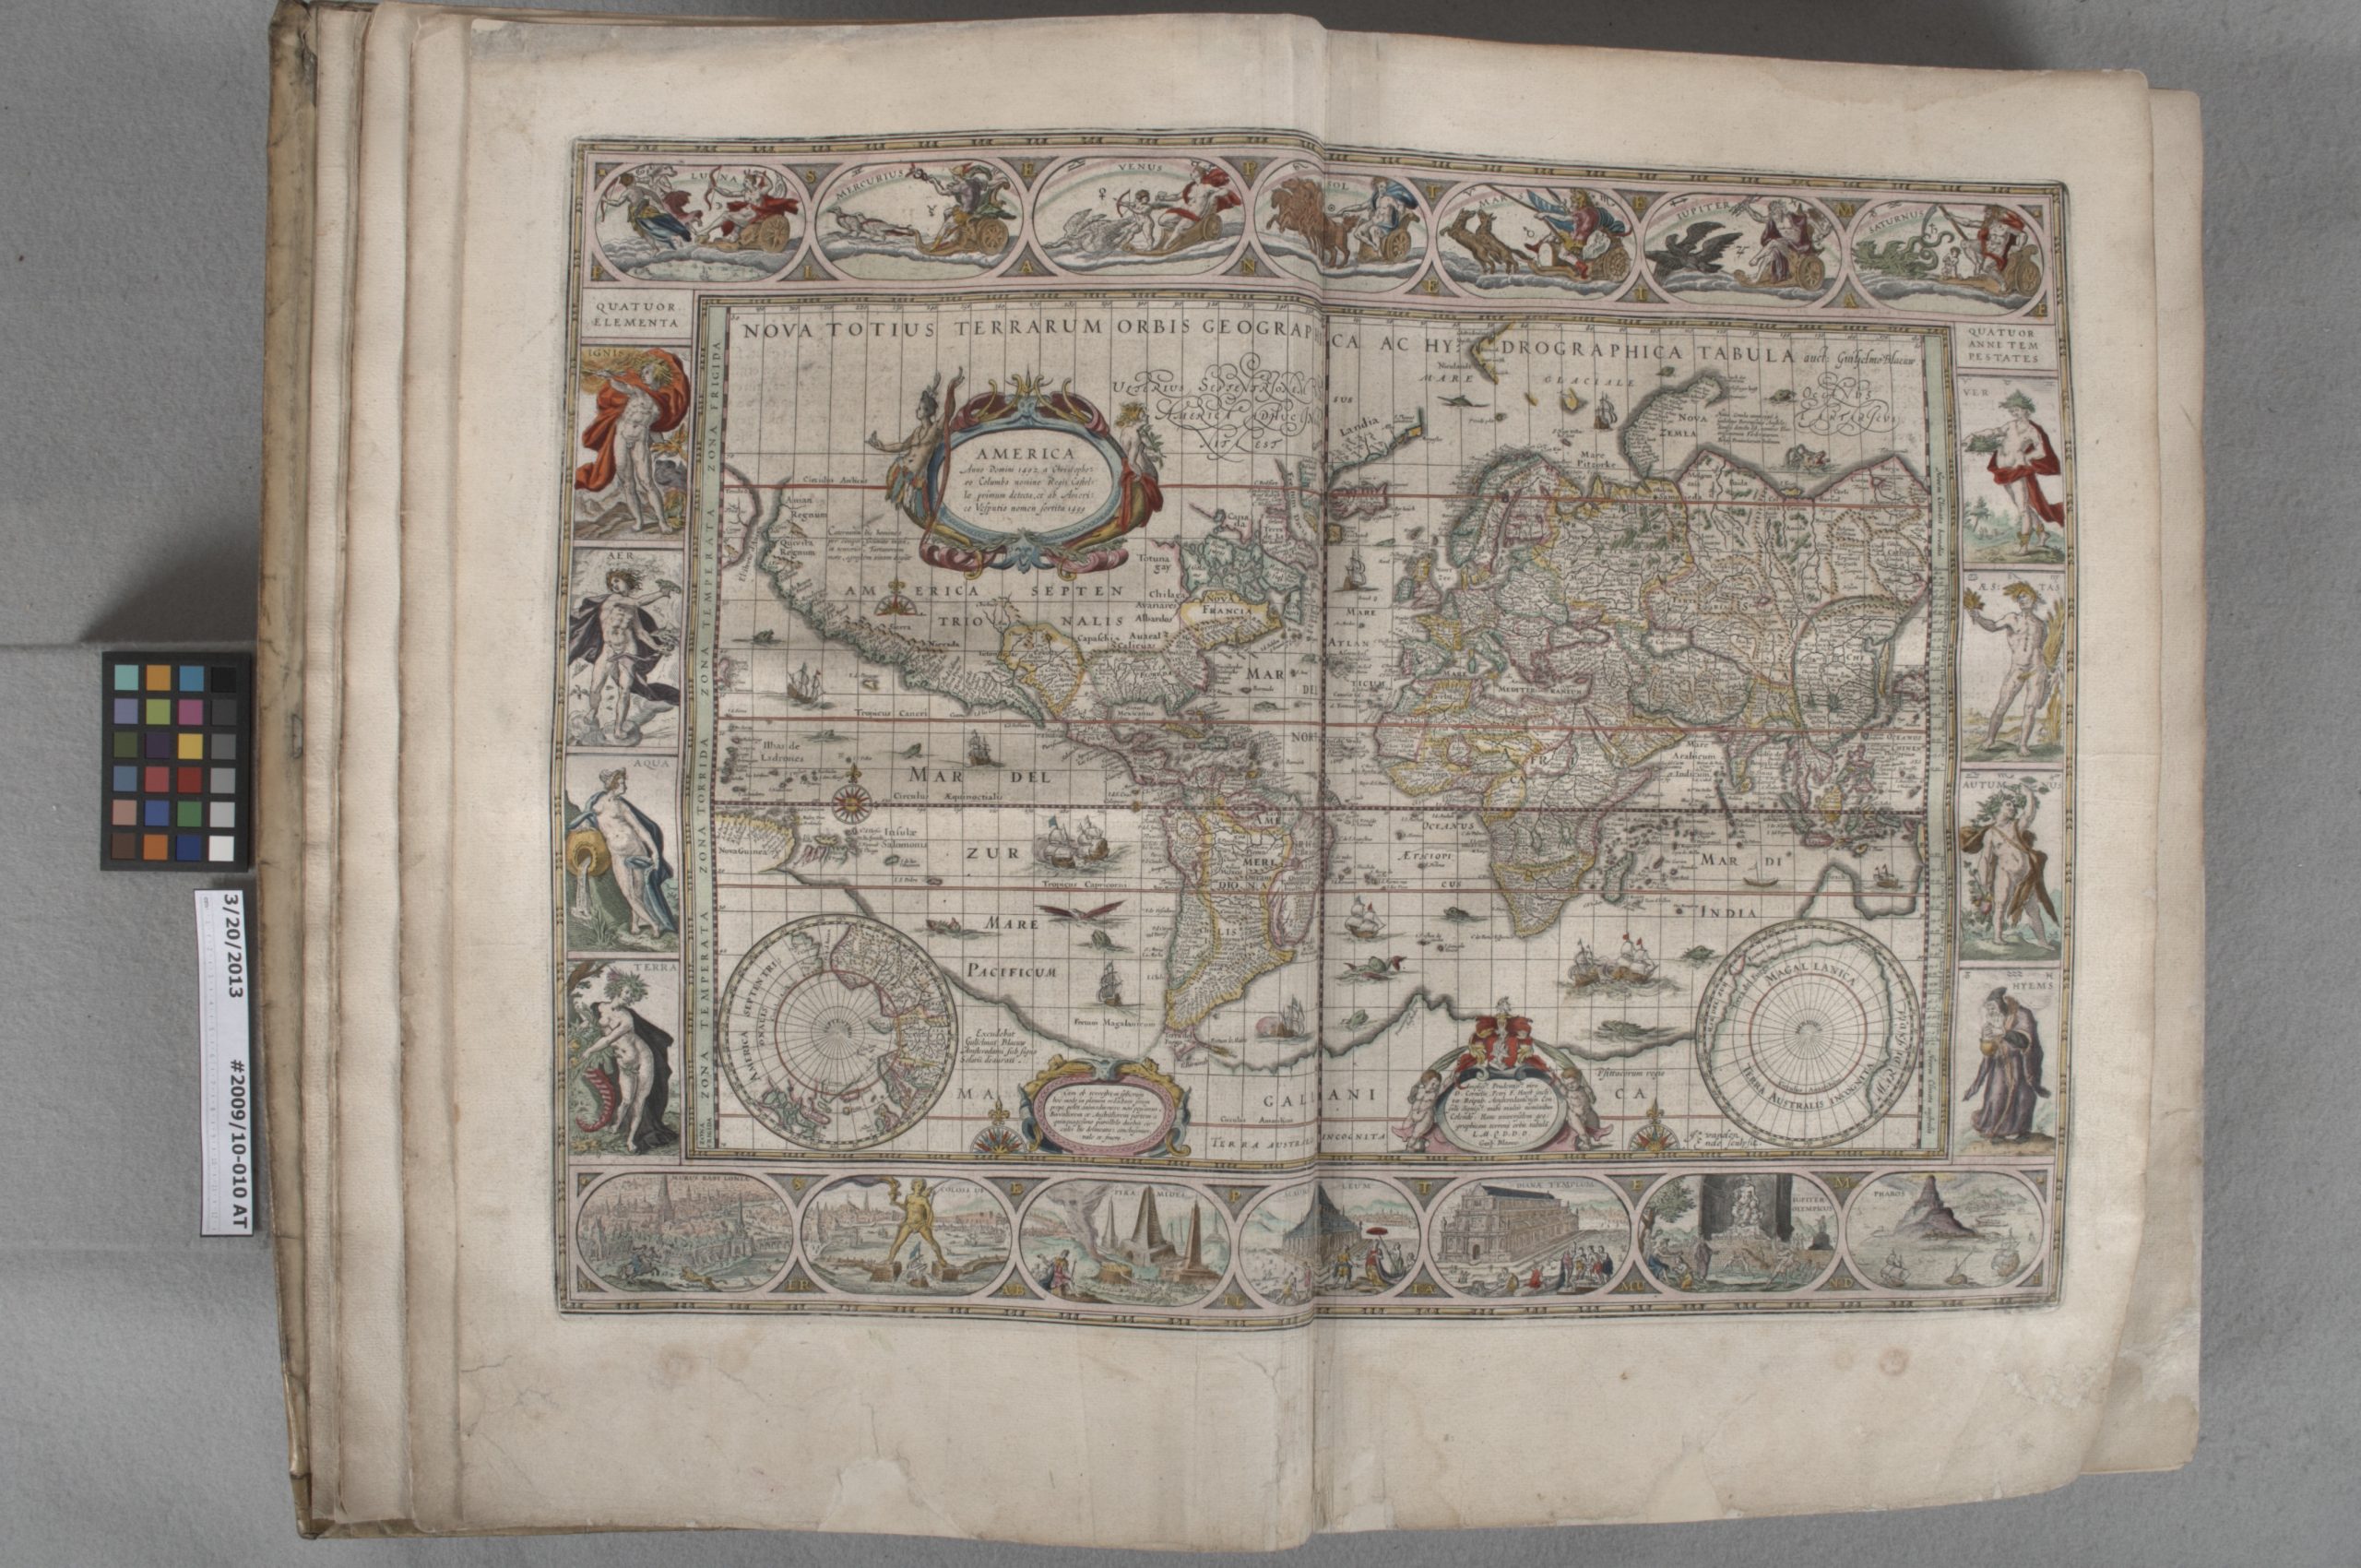
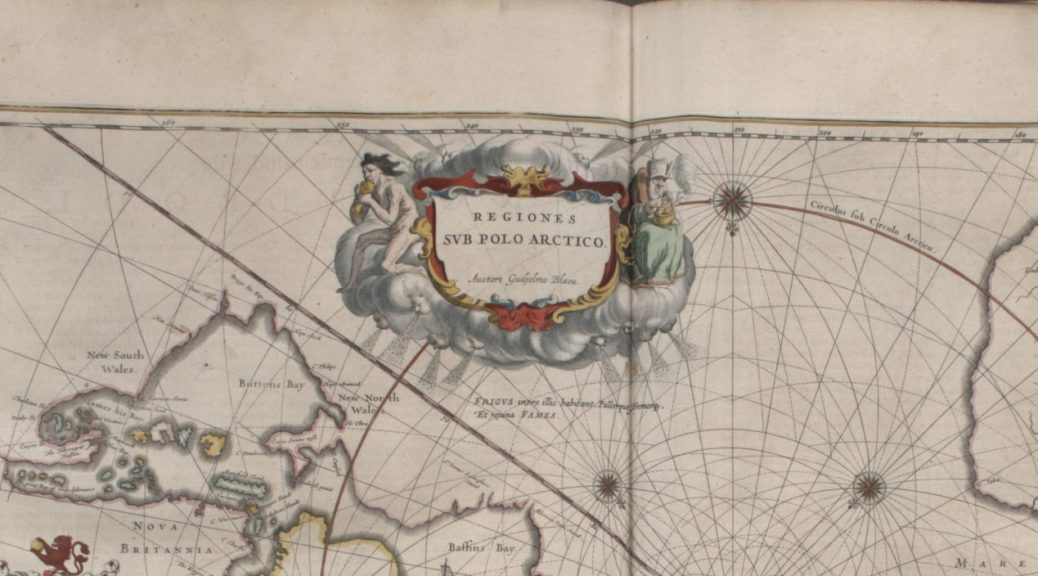
It’s a truism that early printed maps look a little different to modern eyes. This is partly the result of imprecise mathematical knowledge prior to the 18th century. According to David Woodward in The history of cartography, “before careful measurement, distances from place to place could be roughly paced” (13). “Roughly” is the key word. These differences are also bound up in the original goals of the maps, which in the case of Western European countries, often included economic, religious, and political expansion nearby and into faraway places (that is, colonialism) (Woodward 19). And finally, and very much related to the first two points, the world has never been static. For example, there was once a province called Carolina that included North Carolina and South Carolina as well as parts of Florida, Georgia, Alabama, Tennessee, and Mississippi. Things change.

I’m a cataloger, and catalogers want to describe those early maps accurately. But how do we do that when distance was “roughly” measured, or when place names and boundaries have changed? For example, how do we document a map showing that Texas once “included much of what later became Kansas, Colorado, Wyoming, New Mexico, and Oklahoma” (Lepore 222)? Subject headings do some of that work in a catalog record, but geographic headings specifically relate to modern boundaries, not historic. The real heavy lifting comes from including bounding coordinates, the easternmost and westernmost longitudes and northernmost and southernmost latitudes seen on a map. We provide those coordinates in two places in the record, one more visible than the other. If you look at one of our catalog records online, you’ll see the coordinates under “Scale.” We also include those same coordinates as coded data in a separate area in the MARC record (see row below beginning with “=034”). This coded data is very precisely structured data. You can’t see it in our online catalog, but if you ever need access to it, let us know! We’re here and happy to help.


Adding coordinates to map records is a relatively new practice, and not all Rubenstein Library maps include that data. We’re trying to change that. Using a combination of data editing software, and digitized versions of maps, we’ve begun adding that data point to our early printed map records. Doing this work today has an immediate impact for researchers. In our online records, you can see the coordinates and use that data to make research decisions. It also serves an important task for the future. Coordinate data is easily accessible to librarians and can be changed into other data standards for use in digital humanities projects (Kiser & Smeltekop). Without coordinates, this work may be at a standstill.
Since we began this project a few weeks ago, we’ve made changes to over 100 hundred records, with no plans to stop. We still have several hundred to go!
Want to know more about maps? We don’t blame you! In 2013, Duke students in Borderworks Lab curated “Mapping the City: a stranger’s guide,” an exhibit featuring maps and atlases held by the Rubenstein Library. The exhibit is online and is very cool.
Works Cited
Kiser, Tim, and Nicole Smeltekop. “A Method for Creating Scanned Map Metadata for Geoportals, Library Catalogs, and Digital Repositories: Reworking Existing MARC Records of Paper Maps to Create New Records for Their Scanned Counterparts.” Journal of Map & Geography Libraries, vol. 14, no. 2-3, Feb. 2018, pp. 109–131. Library, Information Science & Technology Abstracts with Full Text, doi:10.1080/15420353.2019.1640166.
Lepore, Jill. These Truths: a History of the United States. W.W. Norton & Company, 2019.
Woodward, David. “Cartography and the Renaissance: Continuity and Change.” History of Cartography, vol. 3:1, University of Chicago Press, 2007, pp. 3–24.