

Post by Joyce Chapman, Assessment Analyst and Consultant.
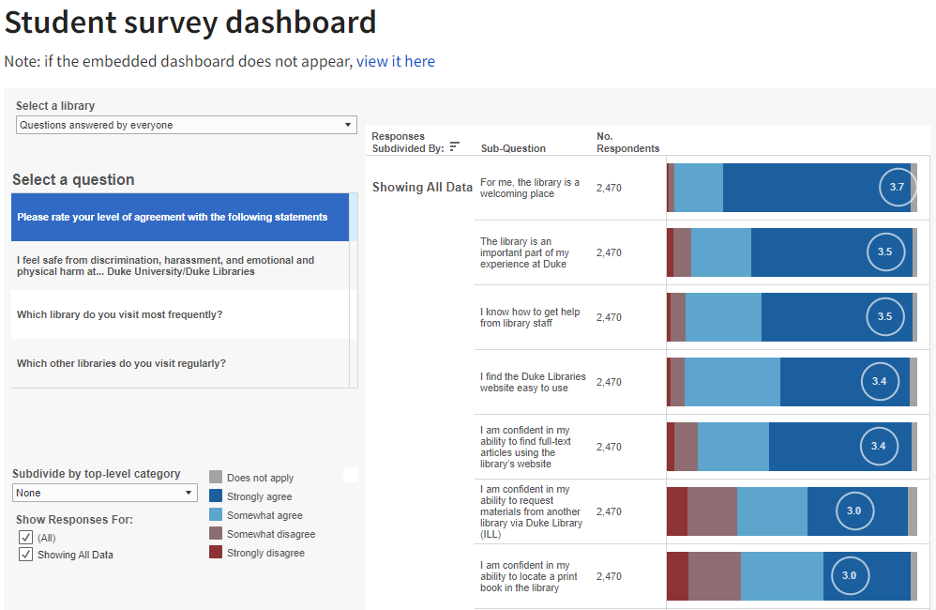
Our path to hosting library data parties started with something we’ve done many times before. Every two years, the Duke University Libraries runs a large-scale student satisfaction survey to learn how the Libraries can better meet our student needs. Once the data is in, our work begins: small teams of staff code thousands of comments with topical tags, reformat the data, and build interactive dashboards with which both quantitative and qualitative survey data can be analyzed and explored. Once the dashboards are ready, we hold a large staff workshop, where over 50 staff from different library departments come together to explore student feedback. At the workshop, staff document trends, note areas where the Libraries needs to improve, and look for areas where students of a specific demographic (such as undergraduates, or students a particular school) have different concerns or problems than the main body of students. Staff then brainstorm solutions that the Libraries can enact to address the problem areas uncovered by the survey, and finally they rank the cost and impact of each solution. The recommendations are then presented to library leadership teams, and groups of staff work over the course of the next year to enact as many solutions as possible.
While students provide the data by taking the survey, in the past they have not been involved in data analysis or brainstorming potential solutions to problem areas the survey uncovered. In 2024, the Libraries decided to try something new to bring students’ valuable feedback to these parts of the process where it had been historically lacking. We threw some parties!!! Because who doesn’t like a good party?
What happens at library Data Parties?
At this point the burning question on your mind is likely “what happens at a library data party?” Are there data-themed cocktails? Are participants required to interpret data through dance? The answer is no. This is just the most exciting name we can come up with for a 2-hour intensive workshop with free snacks that involves a lot of data.
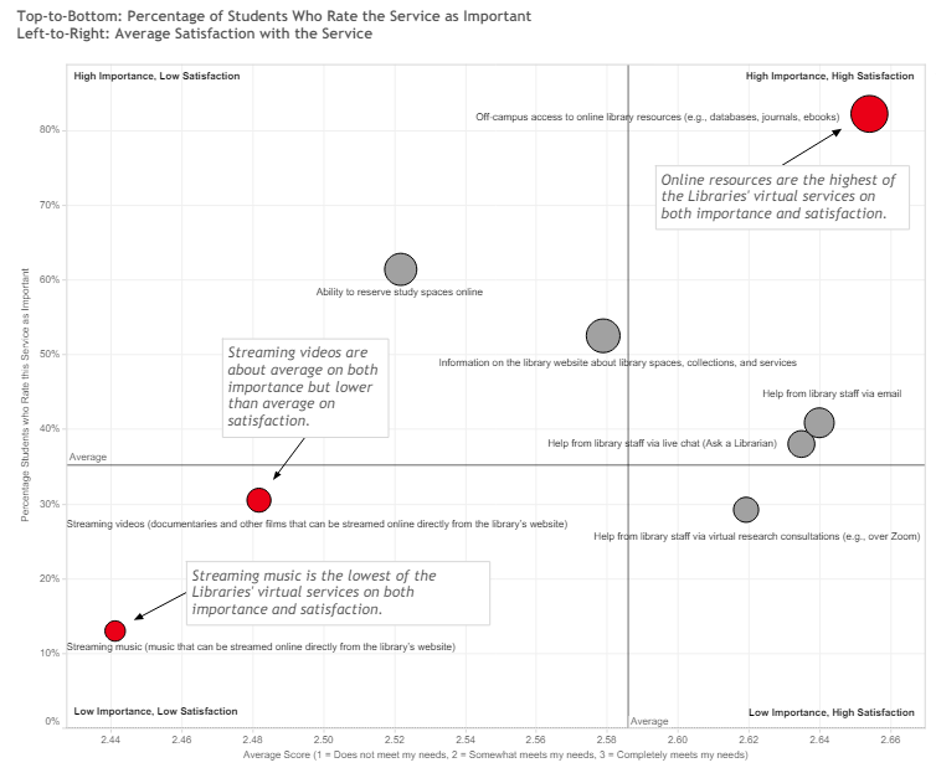
We held one event for undergraduates and another for graduate students. During the Data Parties, students were split into small groups, and each group was provided with a worksheet to complete as they moved through five stations in a large conference room. Each station focused on a topic, such as “physical spaces in the libraries.” A set of large visualizations were taped to the walls displaying the data from the survey relevant to that topical station. Students had ten minutes per station, half of which was spent examining the data individually prior to discussing the data as a group and completing the worksheet. At each station, students were asked to consider the following questions:
- What, if anything, surprises you about the data?
- Do you notice any other patterns?
- What more do you wish you knew or what additional information do you wish you had?
- Given the data, what are the problems or issues that exist for the libraries in this area?
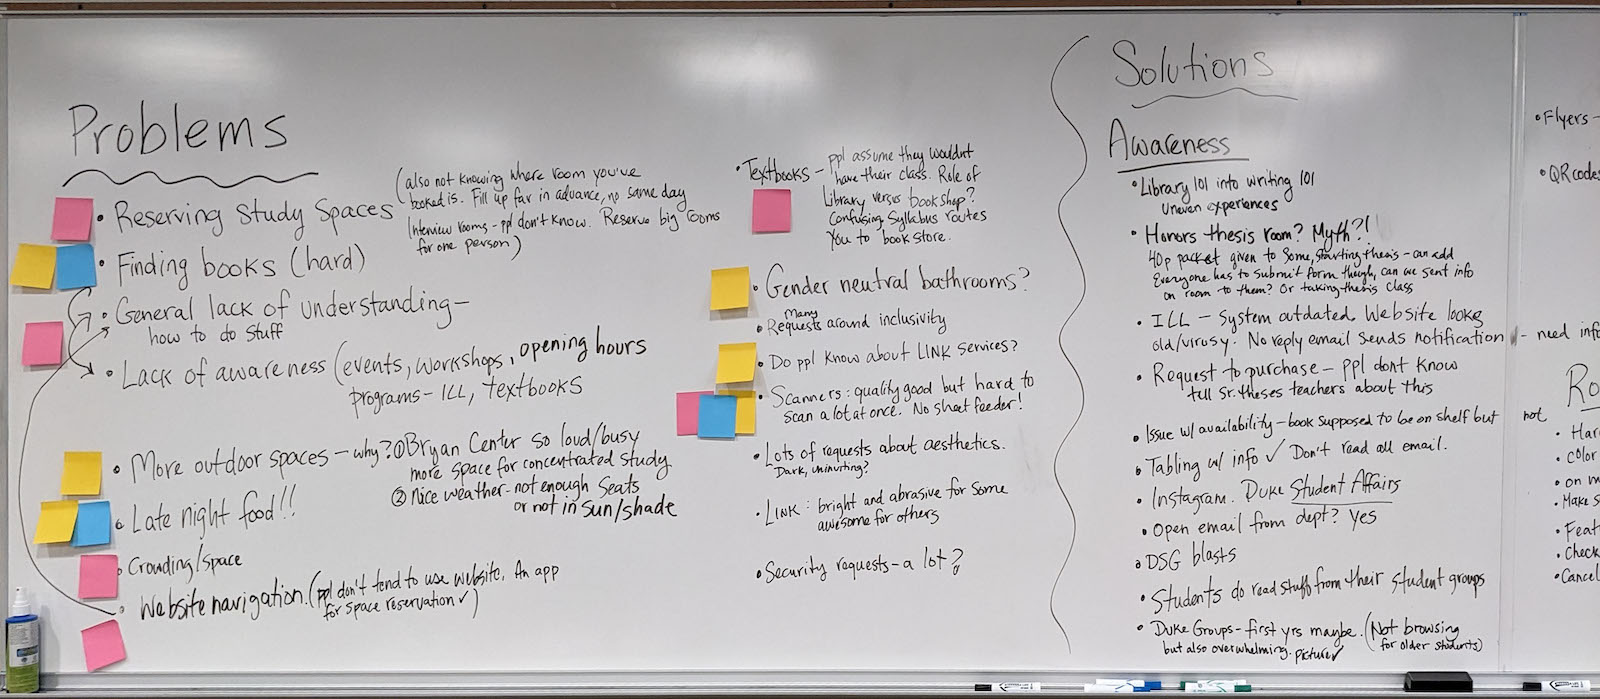
Following the small group work, students came together with staff moderators. In a group conversation, students generated a list of problems on a whiteboard, which they then ranked with colored post-its as having high, medium, and low impact. Next, they brainstormed solutions to the problems on a second whiteboard.
How did we organize the Data Parties and get people to show up?
The Libraries sent direct email invitations to the 437 students who had volunteered their contact information on the biennial student survey to participate in “future feedback opportunities with the Libraries.” Thirty-eight kindly souls responded, though due to scheduling conflicts, not all of them were able to participate. We got 14 additional volunteers by advertising via the Libraries’ social media accounts, posting an event that appeared on the library homepage carousel, flyering outside the library coffeeshop with candy, and submitting a blurb to be included in the Duke International Student Center’s newsletter. As an incentive, participants were offered a $25 Amazon or restaurant gift card, as well as snacks during the event.
How well did the Data Parties work?
The structure of the Data Parties worked well to engage students in discussions about the survey data and generate high priority solutions. Students used their unique perspective and knowledge of campus facilities and organizations to generate ideas for how to address problems that staff would not have come up with on their own. A post-event feedback form indicated that students enjoyed talking with peers about the libraries and brainstorming solutions.
One difficulty was that with a single, two-hour event, students only saw a staff-curated view of the data via pre-made charts and graphs. They were not able to explore the data deeply and generate their own insights. This was because we had tried to keep it easy for students to participate by keeping the event short and avoiding pre-work. Graduate students in particular said they would have liked to explore the data in more depth themselves, and might be willing to participate in a series of discussions instead of a single event.
Another challenge was recruitment and participation. Despite slots filling up quickly, only half of the graduate students registered for the event actually showed up. We used that information to increase our recruitment efforts for the undergraduate event.
We also found it difficult to juggle gathering feedback from both students and other library stakeholders. This method of engaging students in the analysis process had the unintended result of generating suggestions that did not get reviewed by the broader library staff at the staff workshop, which had already occurred. In the future, it may be better to treat the process as three phases that each need both staff and student feedback: analyzing survey data, brainstorming recommendations, and prioritizing those recommendations.
Recommendations for the Libraries to pursue
The highest areas of need and impact uncovered by our direct analysis of the survey data, discussions during the staff survey data workshop, and the Data Parties with students are Outreach and Space Strategy. The primary recommendations are:
Coordinated patron outreach
The 2023 Student Survey, 2023 International Student Study, and 2024 Strategic Plan have all identified a critical need for increased outreach to students and faculty providing information about the Libraries’ services, resources, and spaces. Findings from the student survey emphasize a need for centralized vision and management for this outreach. Ideally, a new staff position would be hired to address the increased demand for communication strategy and graphic design support these recommendations would require. As a new position may be impossible in the short term, we recommend a combination of stop-gap measures:
- Re-designate part of an existing staff person’s responsibilities to take ownership over new patron outreach efforts
- Hire an outreach design intern (proposal being put forward by AUXS)
- Form a standing outreach and content strategy working group to prioritize project work and develop content, in partnership with the outreach coordinator and the Web Editorial Board
Coordinated space strategy
While every student survey generates suggestions for improvements to spaces, the post-pandemic survey results suggest more dramatic changes than have been undertaken in recent years. These changes require looking at use of our spaces as a whole; understanding the changing needs of our patrons; and developing a multi-year, multi-space strategy for keeping our spaces responsive to patron needs between renovations. As with outreach, a coordinated approach to space strategy would ideally be assigned to a dedicated staff person, but the Assessment Core Team recommends a stop-gap measure of charging a standing space strategy team. A motivated and dedicated leader will be critical to the team’s success. A spaces team has also been recommended after past biennial student satisfaction surveys.
What’s next?
The Libraries is entering a new strategic plan cycle, and we expect a lot of changes to be happening in over the next few years. Our plan is to reflect on our new priorities and what we have learned from our biennial surveys, and redesign our survey instrument and analysis process. Some changes we are considering are: lengthen the cycle to one survey every three years, redesign the survey to reduce the length and ensure coverage of high priority topics, expand our engagement with students during survey analysis, use the Data Party format for staff data exploration events as well, and make sure our recommendations are focused and reflective of a combination of data from both the student and staff perspective.
One thought on “Library Data Parties (the BEST kind of party!)”
Comments are closed.