
 The Office of the Vice Provost for Research is announcing a data visualization challenge focused on a rich dataset describing research activity and output of Duke researchers. The datasets are from Scholars@Duke and they describe publications, authorships, and scholarly collaborations from university researchers.
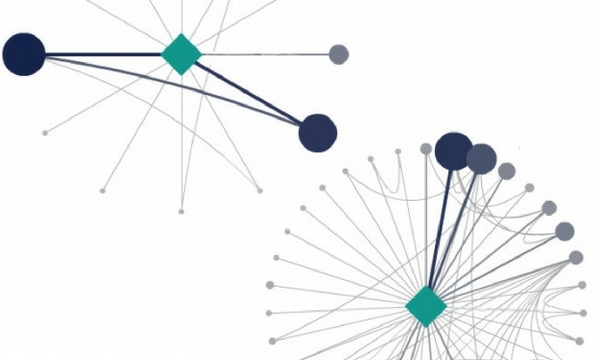
The challenge. Create visualizations to capture the richness and dynamism of Duke research. Envisioning Duke Research | Visualizing Scholars@Duke
The dataset encompasses bibliographical information and abstracts, publication venue (including journals and conferences), and a co-authorship network. More information can be obtained on the Scholars@Duke website.
In order to participate in the challenge, simply download the data and indicate your intent to submit visualization by midnight on Sunday, January 15, 2017. The visualization will be presented at a poster session on January 19 and at the Duke Research Computing Symposium on January 20.
First prize is $500, second prize is $250, and third prize will be awarded $100. Judges of the posters are experts in data analysis and visualization in the Duke community. All are invited to participate in this amazing opportunity to showcase skills in data visualization!