Category Archives: Assessment

Search Results: Prototypes, Analysis & Inspiration

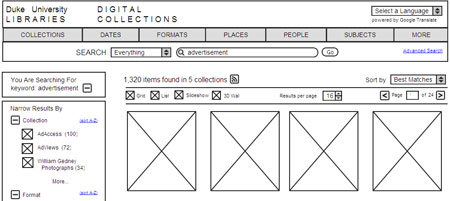
As we continue our redesign, we’re getting some really helpful feedback on our mockups for item pages. By all means, keep it coming! Here are some new prototypes for our search results screens, as well as our analysis of our current search results and examples of others systems we like. What do you think?

Prototypes

serp-prototypes

There are five examples here; some are searching across all collections and others are searching within a single collection. Particular areas of interest for us: location of the ‘Narrow by’ facets, display of results for matching digital collections or matching digital exhibits, collection branding & info.

Analysis

View this feedback (Search Results (Cross-Collection): Existing Interface) on Notable
Here’s what we have learned about our search interface from our various evaluation methods:

Web Analytics

  1. About 75% of searches are within-collection searches; 25% are cross-collection.
  2. The majority of searches are for various topics, though many users search for items from a particular decade (“1920s”), format (“advertisements”), or collection (“Gamble”).
  3. Some users attempt to retrieve every item possible through search (“*”, “all”, “a”)

Usability Tests (Spring 2008)

Continue reading Search Results: Prototypes, Analysis & Inspiration

Search Analysis: What We’ve Learned

Stop searching for records- just flip a lever; Ad*Access. Item R0712.

We’re taking a user-centered approach in planning the new Digital Collections web interface to ensure that our new design meets the needs and expectations of the people who use it.  One way to discover those needs is to analyze our web traffic in an attempt to decipher user intent when searching and browsing materials in our site.  Valuable patterns exist in this data that can help us optimize the site’s utility and performance by supporting actual user information-seeking behaviors.  Lou Rosenfeld recently wrote a terrific blog post about this “bottom-up analysis” on A List Apart.

Using aggregated data from Google Analytics, we studied searches performed in our site from the period between May 1st and November 1st this year.  We found that Duke Digital Collections was searched approximately 131,000 times during this six month period; that’s an average of 717 searches per day.  The average user spent about three minutes on the site after entering his or her search query and viewed nearly four pages.  Visitors also adjusted their searches with keyword refinement 26% of the time. Continue reading Search Analysis: What We’ve Learned

Item Pages: What We’ve Learned

We have been assessing our web interface to Digital Collections for some time using a healthy variety of evaluation techniques and soliciting ideas for a new & improved interface. Let’s first take a look at our item pages, with an annotated review of our current site:

<a href=”https://seanaery.notableapp.com/website-feedback/10444/Item-Page-Existing-Interface” mce_href=”https://seanaery.notableapp.com/website-feedback/10444/Item-Page-Existing-Interface”>View this feedback (Item Page – Existing Interface) on Notable</a>

Here’s what we have learned about the item pages, broken down by source:

Web Analytics

  1. Our most-accessed items get viewed mostly via external links, especially from social media tools (like StumbleUpon) and Google Images.
  2. More than 3/4 of item page views are for the medium image view as opposed to the details view.

Usability Tests (Spring 2008)

Continue reading Item Pages: What We’ve Learned

Answering the important questions.

Recently we implemented Google Analytics to track usage of our digital collections.  Sean has already contributed several great posts about our digital collections use statistics, but one thing I find particularly interesting (and amusing) is that Google Analytics allows us to see the types of keywords our users are entering into Google, Yahoo, and other search engines, and where those keywords lead them in our digital collections.

Not surprisingly, some search queries are common and reveal the subject strengths of our digital collections.  For example, the top three queries that bring users to our collections are “sheet music,” “ad access,” and “history of advertising.”

After scanning through thousands of these search queries, several distinct categories emerge: the known-item query (an exact title in quotes), the URL as query (e.g.  http://library.duke.edu/digitalcollections/adaccess/), and the format query (e.g. “diaries” or “manuscripts”), among others.  The most entertaining category, however, is the query issued in the form of a question.

Below are some of the important questions our users have asked with links to where they’ve found answers to those questions in our digital collections.

/* Style Definitions */
table.MsoNormalTable
{mso-style-name:”Table Normal”;
mso-tstyle-rowband-size:0;
mso-tstyle-colband-size:0;
mso-style-noshow:yes;
mso-style-parent:””;
mso-padding-alt:0in 5.4pt 0in 5.4pt;
mso-para-margin:0in;
mso-para-margin-bottom:.0001pt;
mso-pagination:widow-orphan;
font-size:10.0pt;
font-family:”Times New Roman”;
mso-ansi-language:#0400;
mso-fareast-language:#0400;
mso-bidi-language:#0400;}

Presentation to Duke Libraries (2008 Usage Stats)

I presented this morning (March 4, 2009) at our monthly First Wednesday library IT presentation series about Digital Collections stats from 2008 server logs (slides below):

The slides are very basic. Included are some figures extracted from previous blog posts (http://library.duke.edu/blogs/digital-collections/category/assessment/) as well as ‘greatest hits’–the most-accessed item from each collection.

Video Discovery Stats for DSVA: A First Look

Our Diamonstein-Spielvogel video archive collection, comprised of about 130 videos, was introduced this past fall and represents our first digital video collection. Our Digital Collections system (Tripod) does not yet support discovery within a video collection, so in the interim, we are using two external video services in tandem to host the collection and are relying on their native interfaces for search and retrieval.

  • videos uploaded to iTunes U the week of September 21, 2008
  • videos uploaded to YouTube the week of December 14, 2008

Each service provides some distinct advantages over the other. A basic matrix of differences can be found here:
http://www.oit.duke.edu/web-multimedia/multimedia/YouTube/index.html#faq

Usage

To gauge use, we looked at about 8 weeks of data in both systems following the publication of the videos in YouTube. There were 16,412 YouTube views, 993 iTunes downloads, and 392 iTunes previews.

Diamonstein-Spielvogel Video Archive Usage Stats
Dec 14, 2008 – Feb 8, 2009

Continue reading Video Discovery Stats for DSVA: A First Look

Home(page) Economics

As Tom mentioned, we’re in the process of re-examining our homepage (and the layout of individual collection homepages).

What do people actually do when they come to the Duke Digital Collections homepage as it is now?  One way to tell is to review our server logs.

Here’s a look at the year in review.

2008 At a Glance:  68,325 homepage hits

Activity from Homepage Count Pct
Browse directly to a collection homepage 21,342 31.24%
Do a cross-collection search 7,533 11.03%
Go to the homepage or an anchored section of it* 2,549 3.73%
Browse the A-Z List of collections 2,170 3.18%
Check out exhibits 1,478 2.16%
Go to Duke Libraries homepage 922 1.35%

Continue reading Home(page) Economics

Does this still fit?

shoesEver go to a shoe store, try on a pair of shoes and think, “Wow, these are great”? Ever wear those same shoes around town for a bit and realize that they are actually too tight?

After wearing them for a year or so, we’ve decided that the Digital Collections home page and individual collection home pages are just too tight — we want to squeeze more great stuff into the current designs than they will comfortably hold.

The challenge?

We want the standard introductory text, contact information, navigation, copyright and usage info as before — but we want so much more:

  • Cooliris galleries
  • YouTube videos
  • Term clouds
  • RSS feeds of recent comments (oh, wait, we don’t have a commenting system)
  • RSS feeds of other stuff (since we don’t have a commenting system)
  • Interactive widgets (Simile Timeline anyone?)
  • Mashups (Data, meet Google maps. Google maps, meet data.)

Yes, we have Web 2.0 on the brain. Maybe this will pass. Until then, we will re-think a variety of pages with greater content flexibility in mind.

Stay tuned…

Collection Usage Stats for 2008

Looking back at our 2008 web logs, we can learn a lot about how our system and our collections are being used. We hope to combine an analysis of this usage data with usability testing and other modes of evaluation to better inform our continued development of our system & interface in 2009.

Here are two separate charts (below): one for the first half of 2008 (Jan – June) and the other for the second half (July – Dec). The one on the right includes more collections (we introduced several throughout the year) and may be a more representative look at the usage.  Also keep in mind that the collections vary in size (larger collections have more items *to be viewed* and often have more ways to formulate queries).

Click to enlarge:

Jan – June 2008
July – Dec 2008

Interesting findings

Continue reading Collection Usage Stats for 2008

How We’re Found (or, Referrer Stats for 2008)

Now that 2008 is over, we’ll be posting a few charts & graphs that illustrate some interesting trends in how our digital collections (and our shiny new system) have been used in the past year. This post focuses on “referrers,” or, those other sites that people come from that directly lead them to land on our pages.

OK, so what are we counting?

How many?

  • 890,000 referrals from 10,000 unique external domains (all Duke library web sites/pages excluded). Only the top 9 individually account for more than 1% of external referrals, so there’s quite a long tail.

Notable External Referrers

Of the 10,000, some stand out in particular…
Continue reading How We’re Found (or, Referrer Stats for 2008)