
 Looking back at our 2008 web logs, we can learn a lot about how our system and our collections are being used. We hope to combine an analysis of this usage data with usability testing and other modes of evaluation to better inform our continued development of our system & interface in 2009.
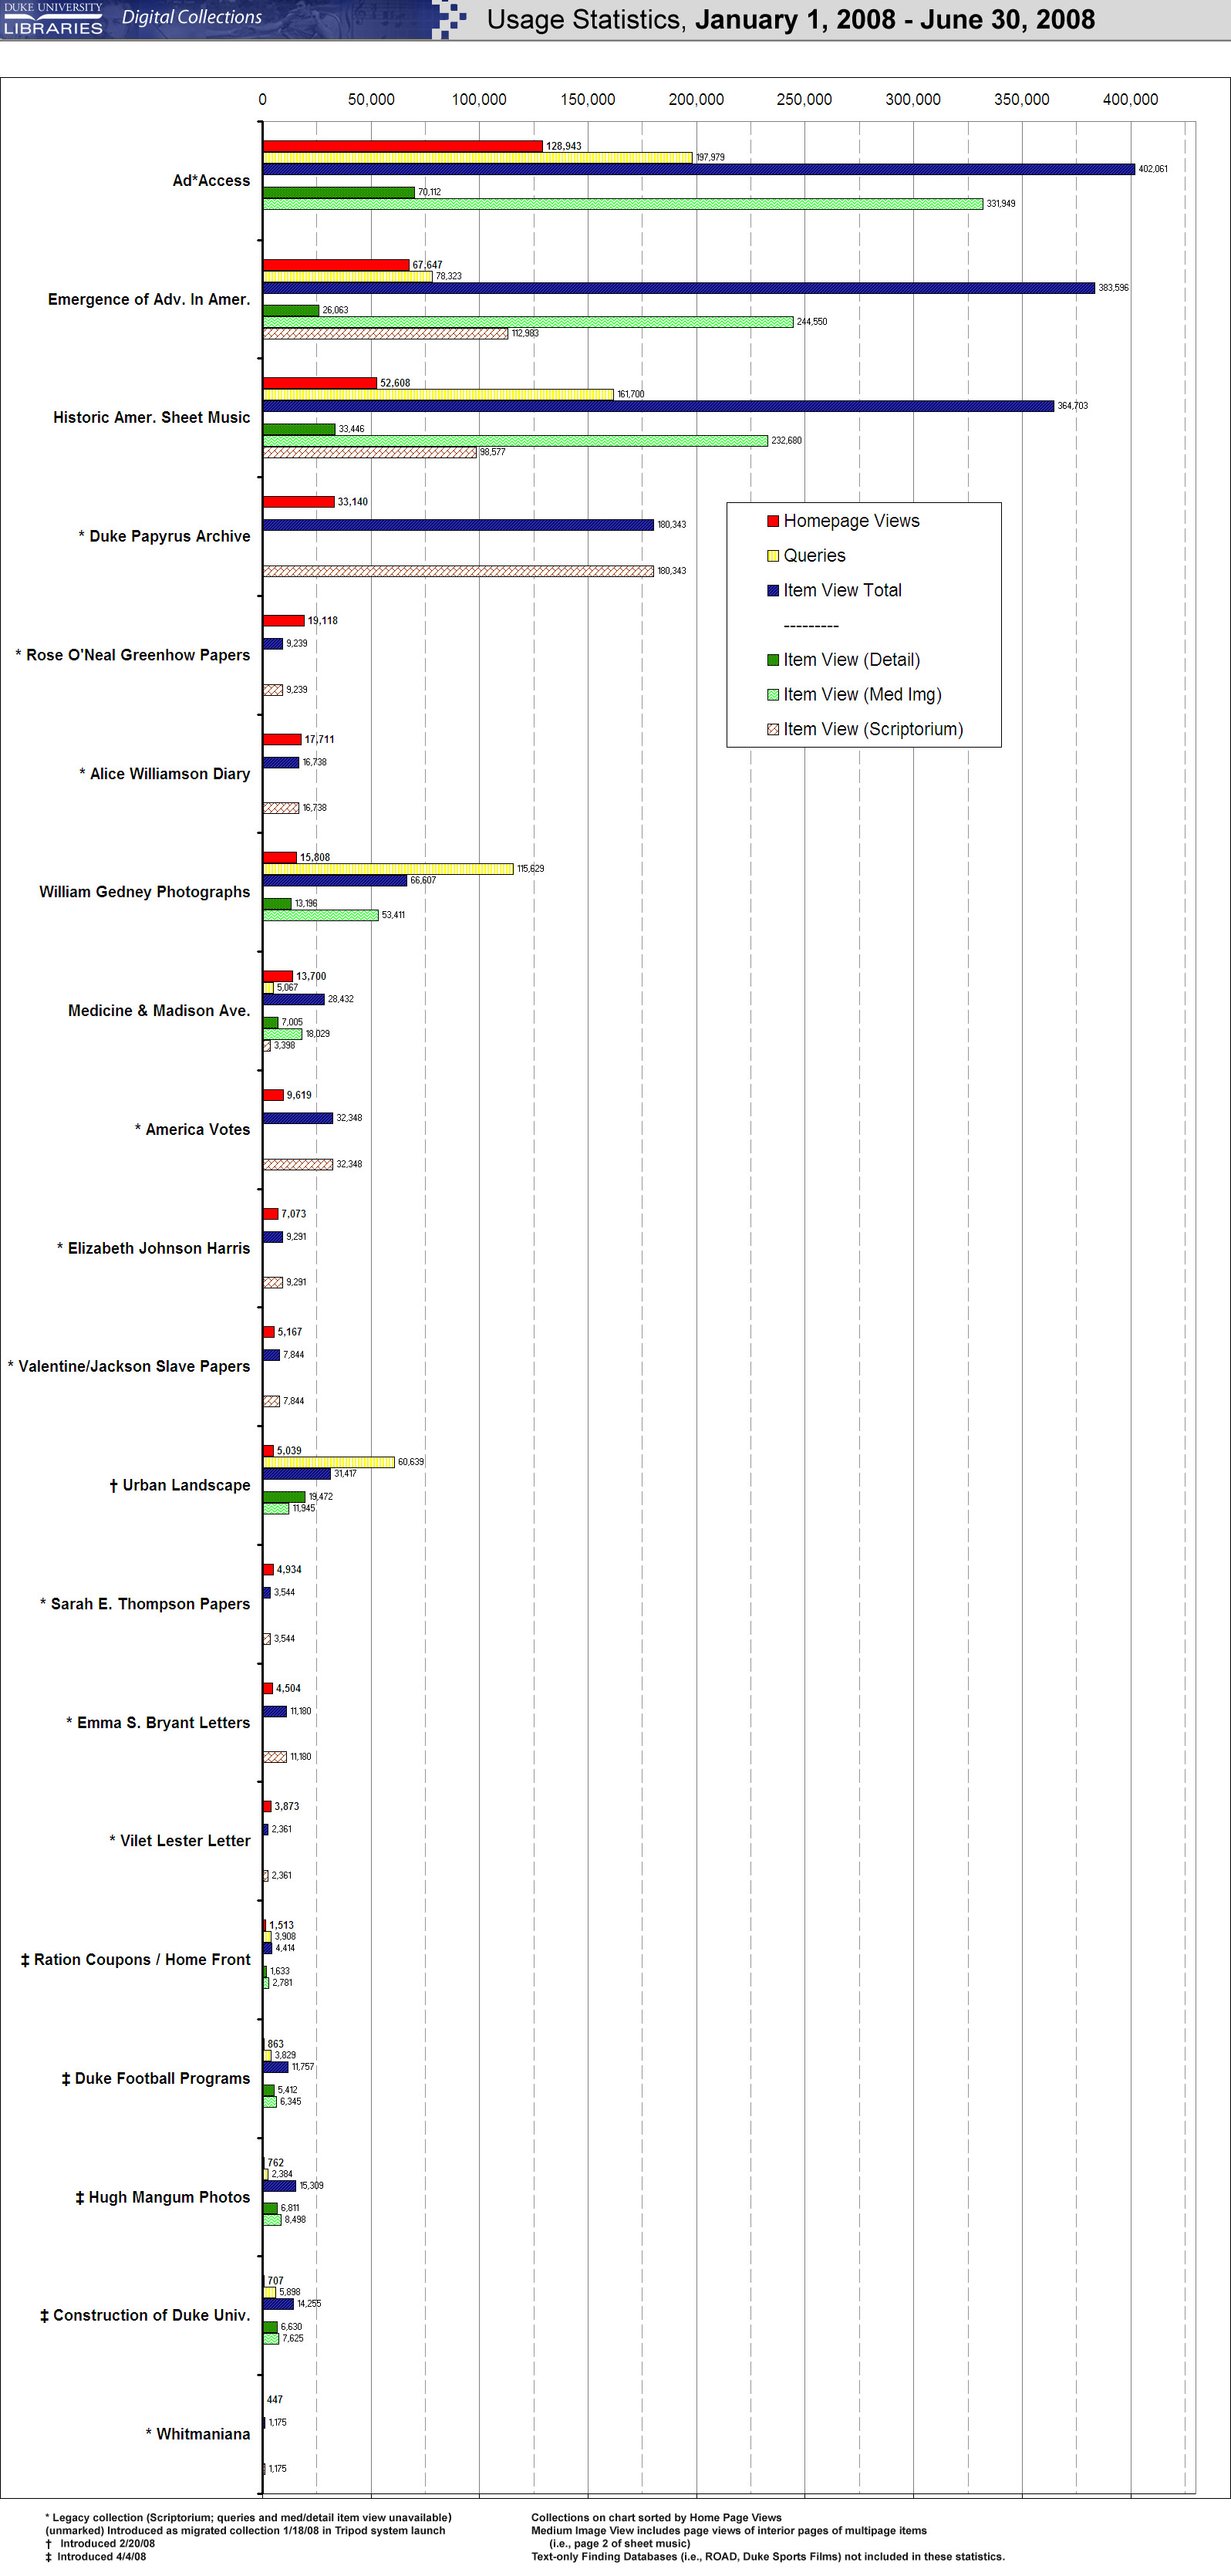
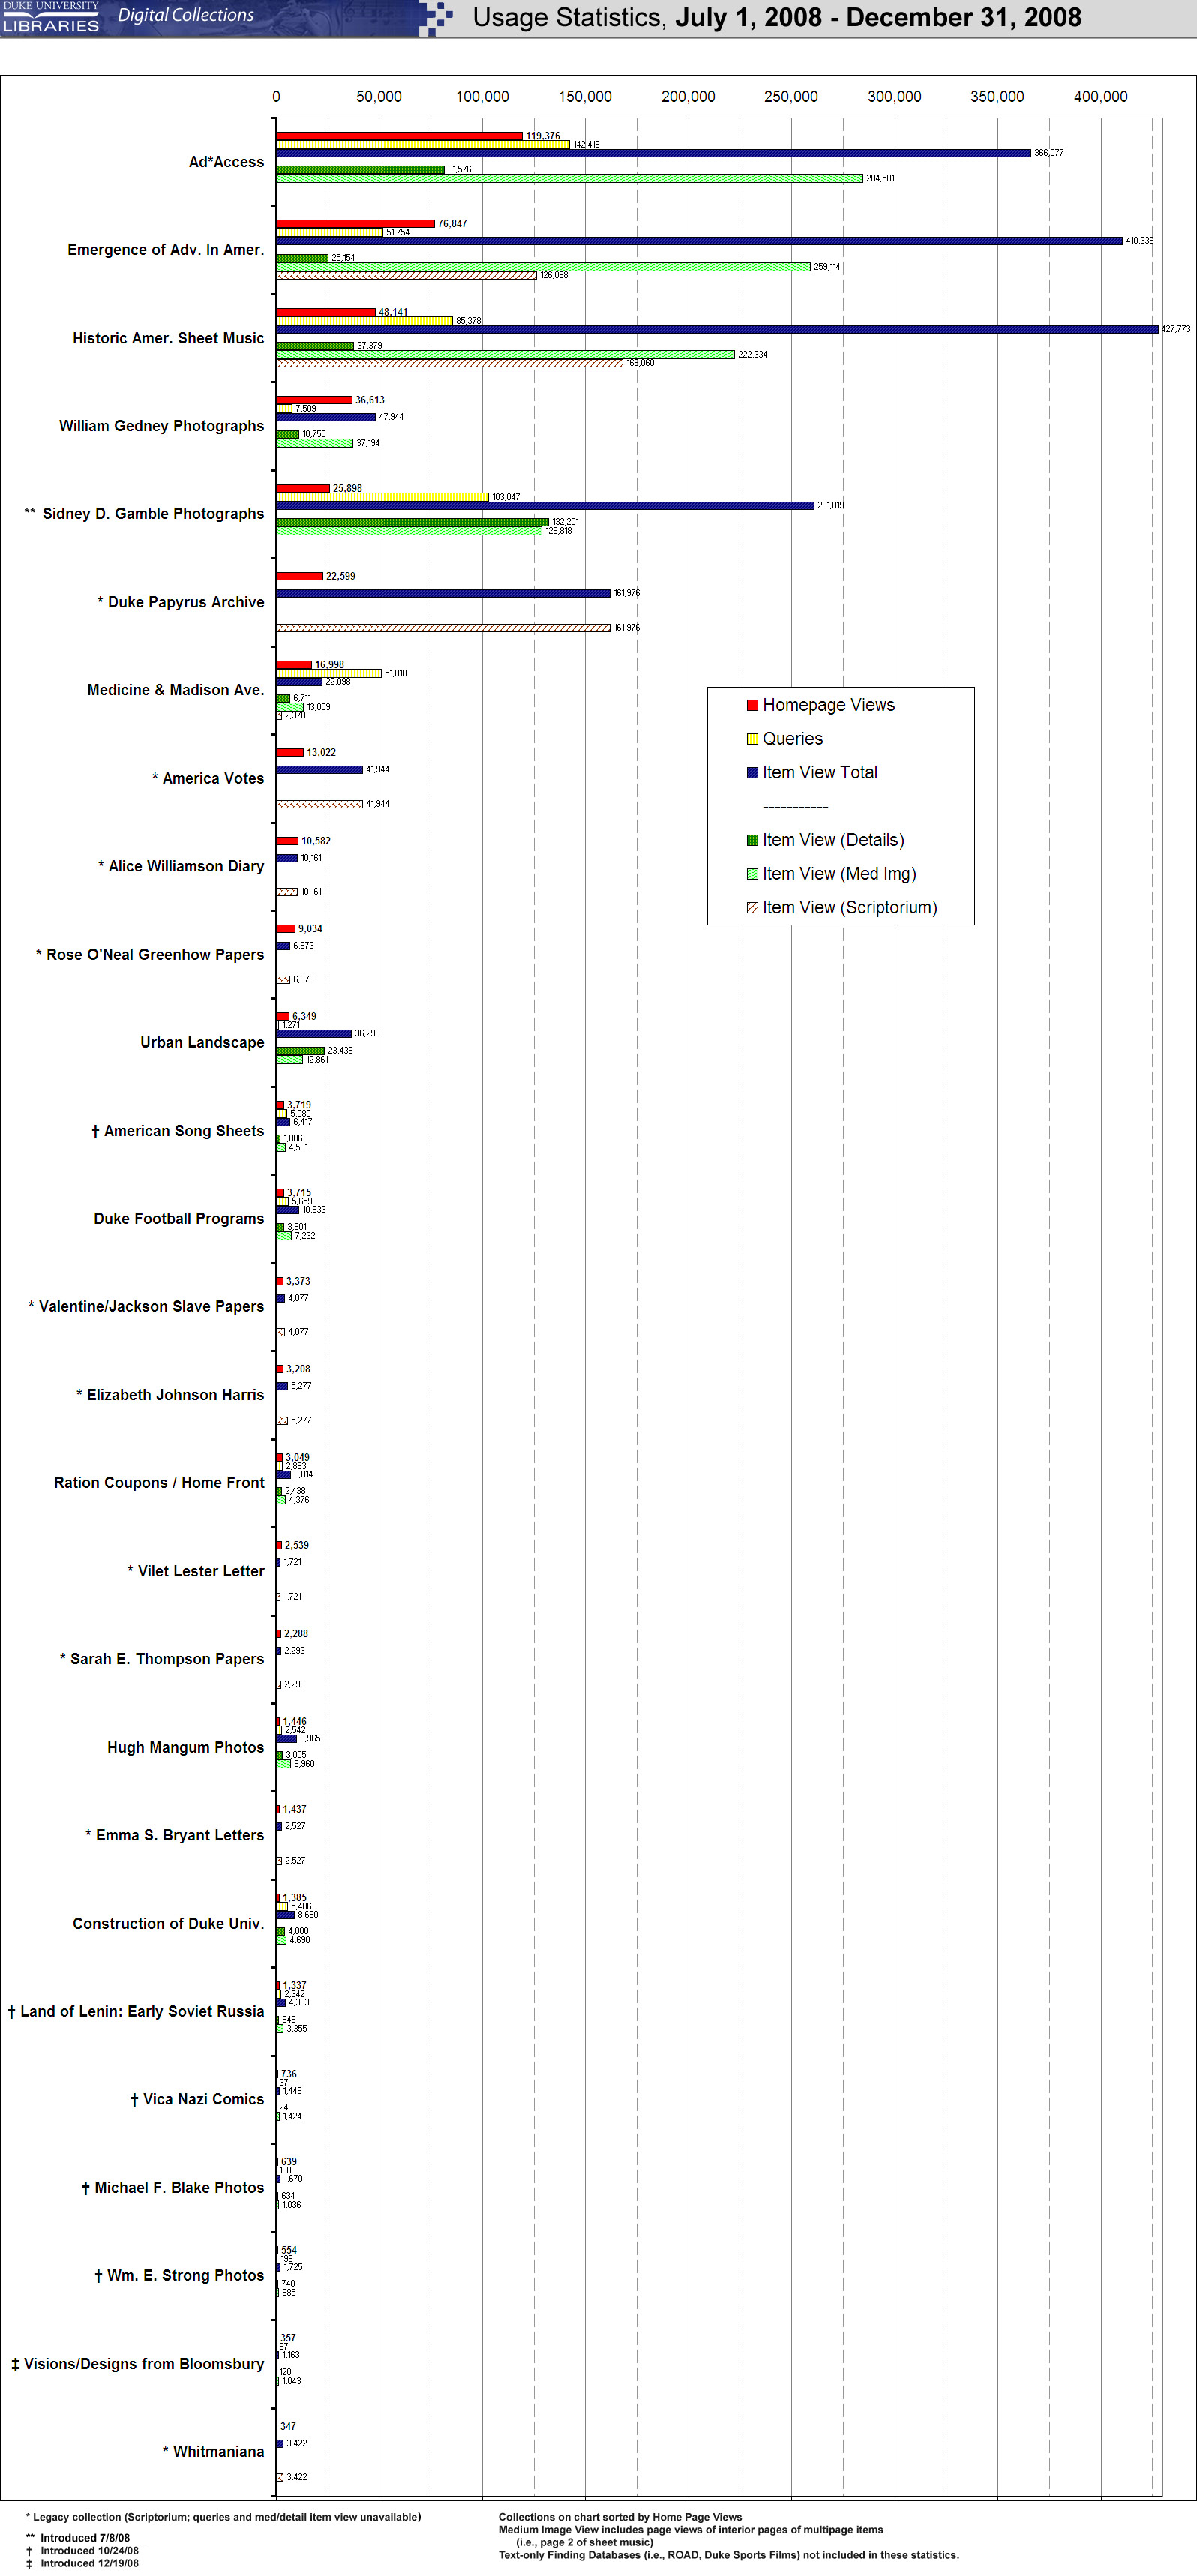
Here are two separate charts (below): one for the first half of 2008 (Jan – June) and the other for the second half (July – Dec). The one on the right includes more collections (we introduced several throughout the year) and may be a more representative look at the usage. Also keep in mind that the collections vary in size (larger collections have more items *to be viewed* and often have more ways to formulate queries).
Click to enlarge:
Interesting findings
- Cross-collection vs. Within-collection searches.
Our system was designed to enable easy searching across multiple collections. Our users definitely have used that capability, though most queries were still performed within the context of a single collection. For all of 2008, 23.3% of total queries (1,436,604) were searching across multiple collections; 76.7% were within a single collection. The second half of 2008 saw more cross-collection querying (27.1%) than the first (20.2%). Of course, the more collections we build, the more useful (and interesting) it is to search across them. Of all the cross-collection queries (334,425), only 2.25% (7,533) directly originated from our Digital Collections homepage. The rest of the query action happened inside–as followup (new searches or refinements) to other searches, on item pages, or on individual collection home or contextual pages.
8.08% (27,026) of cross-collection queries came from individual collection homepages. In fact, the “Search All Collections” search box on both the Ad*Access homepage (3.49% — 11,657) and Historic American Sheet Music homepage (2.97% — 9,916) was used even more frequently than the master search box on the Digital Collections homepage. We built our system interface with the challenge of maintaining the branding and the identity of the individual collections while integrating their discovery and display into a common site. Beyond putting in an overarching homepage with a common search box to accomplish this feat, it appears we’ve gotten even more significant leverage from the reverse angle: connecting the individual collection websites back out to our full breadth of digitized collection content.
- Details view vs. Medium Image.
Of all the overall item views in 2008, 21.5% were for the details (metadata-centric with thumbnail) view and 78.5% were for a medium image (image-centric with some metadata on the left). This was a fairly consistent finding for most of the collections. Note: Large image hits were not tracked, and multi-page items like sheet music have more images to be viewed than details.
Does this mean that users are more interested in the visual content of the collections than the descriptions? Perhaps, although we found that the details page was used heavily in one particular collection, the Sidney D. Gamble Photographs. (50.6% details view, 49.4% medium image). Why? The metadata is fairly sparse, although to supplement it, we introduced linked terms (tags) in the details view for this collection, extracted from the item titles. Clicking “above,” “boat,” “gorge,” or “pagoda” here will retrieve other items in the collection with those terms.
 It’s possible that this extra navigation/discovery feature is what makes the details view more desirable.
 - Comparing Queries, Item Views, & Homepage Views
These are obviously imperfect metrics open to a lot of interpretation, but the following may prove useful. Looking only the collections in our new system (‘Tripod’) in the aggregate:
Jan – Jun 08 Jul – Dec 08 Total 2008 Homepage Views 1 316,829 386,532 703,361 Queries 2
796,255 640,349 1,436,604 Item Views 3
1,107,593 1,328,068 2,435,661 Item Views per Query 1.39 2.07 1.70 Item Views per Homepage View 3.50 3.44 3.46 Queries per Homepage View 2.51 1.66 2.04 1. Homepage Views: includes master homepage for all digital collections plus homepages of individual collections.2. Queries: any page view with ‘/search/’ in the URL string. Includes cross-collection & within-collection queries. Is not just search box submission (re-sorts, facet limit selections, page 2+ of search results, canned searches, & some browse pages all count).
3. Item Views: includes either detail or medium view. Also includes page 2+ view of multipage item, so count is likely skewed for collections with paginated objects (i.e., sheet music or comics)
So, very generally speaking, for every homepage view, two queries are performed and for every set of search results, nearly two items are viewed. Also, about three and a half items are viewed for every one homepage view.
Let’s look at examples of individual collections that deviate from the averages. These figures may ultimately only help to illustrate that user interaction differs across the various collections:
Item Views per Query. HIGH: vica (39.14), blake (15.46), bloomsbury (11.99), strong (8.80), hmp (5.13). // LOW: mma (0.80), gedney (0.93), diap (1.09), songsheets (1.26).
Item Views per Homepage View. HIGH: hmp (11.45), duc (10.97), gamble (10.08), diap (5.95), hasm (5.22). // LOW: mma (1.46), songsheets (1.73), vica (1.97).
Queries per Homepage View. HIGH: duc (5.44), diap (5.44), gamble (3.98). // LOW: vica (0.05), blake (0.17), bloomsbury (0.27), strong (0.35), eaa (0.90).
- Homepage Views
The Digital Collections homepage views increased by 34.7% from the first half of the year to the second (29,239 to 39,373). This may be a result of better marketing or perhaps the addition of several new collections after July created both more attention and places from which to link back to the homepage.Though the most popular individual collection homepages are still hit more frequently than the overall homepage. From July – December, the homepages of Ad*Access (119,376), Emergence of Advertising in America (76,847), and Historic American Sheet Music (48,141) were all visited more frequently than the Digital Collections homepage (39,373). - New Collections on the Block
The Sidney D. Gamble Photographs collection certainly made a splash, introduced in the first week of July. From July to December, it had the 2nd-most queries of all the collections (103,047), 4th-most item views (261,019), and 5th-most homepage views (25,898).Of our five collections introduced in October, American Song Sheets is off and running with the strongest usage (3,719 homepage views, 5,080 queries, 6,417 item views in a little over two months).
- Legacy Collections
Finally, let’s not forget our existing digitized collections that remain in flat HTML files and have not been migrated into our new system. Several of these collections are still being used more heavily than many of the collections that we have created or migrated in 2008. The Duke Papyrus Archive stands out in particular: on the whole year, it had the 4th-most homepage views (55,739) and item views (342,319).
Related post: Referrer Stats for 2008
2 thoughts on “Collection Usage Stats for 2008”
Comments are closed.