Category Archives: Digital Collections

A simple tool with a lot of power: Project Estimates

It takes a lot to build and publish digital collections as you can see from the variety and scope of the blog posts here on Bitstreams.  We all have our internal workflows and tools we use to make our jobs easier and more efficient.  The number and scale of activities going on behind the scenes is mind-boggling and we would never be able to do as much as we do if we didn’t continually refine our workflows and create tools and systems that help manage our data and work.  Some of these tools are big, like the Duke Digital Repository (DDR), with its public, staff and backend interface used to preserve, secure, and provide access to digital resources, while others are small, like scripts built to transform ArchiveSpace output into a starter digitization guides.  In the Digital Production Center (DPC) we use a homegrown tool that not only tracks production statistics but is also used to do project projections and to help isolate problems that occur during the digitization process.  This tool is a relational database that is affectionately named the Daily Work Report and has collected over 9 years of data on nearly every project in that time.

A long time ago, in a newly minted DPC, supervisors and other Library staff often asked me, “How long will that take?”, “How many students will we need to digitize this collection?”, “What will the data foot print of this project be?”, “How fast does this scanner go?”, “How many scans did we do last year?”, “How many items is that?”.  While I used to provide general information and anecdotal evidence to answer all of these questions, along with some manual hunting down of this information, it became more and more difficult to answer these questions as the number of projects multiplied, our services grew, the number of capture devices multiplied and the types of projects grew to include preservation projects, donor requests, patron request and exhibits.  Answering these seemingly simple questions became more complicated and time consuming as the department grew.  I thought to myself, I need a simple way to track the work being done on these projects that would help me answer these recurring common questions.

We were already using a FileMaker Pro database with a GUI interface as a checkout system to assign students batches of material to scan, but it was only tracking what student worked on what material.  I decided I could build out this concept to include all of the data points needed to answer the questions above.  I decided to use Microsoft Access because it was a common tool installed on every workstation in the department, I had used it before, and classes and instructional videos abound if I wanted to do anything fancy.

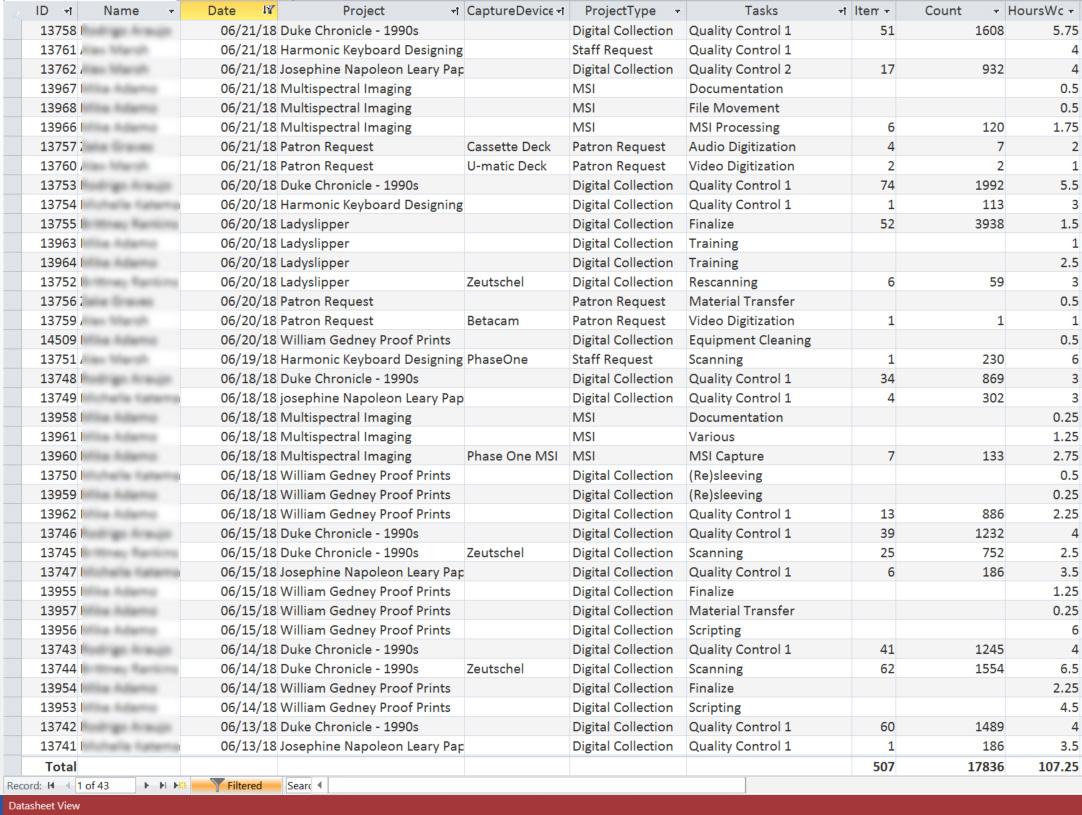
Enter the Daily Work Report (DWR).  I created a number of discrete tables to hold various types of data: project names, digitization tasks, employee names and so on.  These fields are connected to a datasheet represented as a form, which allowed for dropdown lists and auto filling for rapid and consistent entry of information. 

At the end of each shift students and professionals alike fill out the DWR for each task they performed on each project and how long they worked on each task.  These range from the obvious tasks of scanning and quality control to more minute tasks of derivative creation, equipment cleaning, calibration, documentation, material transfer, file movement, file renaming, ingest prep, and ingest.

Some of these tasks may seem minor and possibly too insignificant to record but they add up.  They add up to ~30% of the time it takes to complete a project.   When projecting the time it will take to complete a project we collect Scanning and Quality Control data from a similar project, calculate the time and add 30%.

Common Digitization Tasks

Task
Hours Overall % of project
Scanning 406.5 57.9
Quality Control 1 133 19
Running Scripts 24.5 3.5
Collection Analysis 21 3
Derivative Creation 20.5 2.9
File Renaming 15.5 2.2
Material Transfer 14 2
Testing 12.5 1.8
Documentation 10 1.4
File Movement 9.75 1.4
Digitization Guide 7 1
Quality Control 2 6.75 1
Training 6 0.9
Quality Control 3 5.5 0.9
Stitching 3 0.4
Rescanning 1.5 0.2
Finalize 1.5 0.2
Troubleshooting 1.5 0.2
Conservation Consultation 1 0.1
Total 701 100

New Project Estimates

Using the Daily Work Report’s Datasheet View, the database can be filtered by project, then by the “Scanning” task to get the total number of scans and the hours worked to complete those scans.  The same can be done for the Quality Control task.  With this information the average number of scans per hour can be calculated for the project and applied to the new project estimate.

Gather information from an existing project that is most similar to the project you are creating the estimate for.  For example, if you need to develop an estimate for a collection of bound volumes that will be captured on the Zeutschel you should find a similar collection in the DWR to run your numbers.

Gather data from an existing project:

Scanning

  • Number of scans = 3,473
  • Number of hours = 78.5
  • 3,473/78.5 = 2/hr

Quality Control

  • Number of scans = 3,473
  • Number of hours = 52.75
  • 3,473/52.75 = 8/hr

Apply the per hour rates to the new project:

Estimated number of scans: 7,800

  • Scanning: 7,800 / 44.2/hr = 176.5 hrs
  • QC: 7,800 / 68.8/hr = 113.4 hrs
  • Total: 290 hrs
  • + 30%: 87 hrs
  • Grand Total: 377 hrs

Rolling Production Rate

When an update is required for an ongoing project the Daily Work Report can be used to see how much has been done and calculate how much longer it will take.  The number of images scanned in a collection can be found by filtering by project then by the “Scanning” Task.  That number can then be subtracted from the total number of scans in the project.  Then, using a similar project to the one above you can calculate the production rate for the project and estimate the number of hours it will take to complete the project.

Scanning

  • Number of scans in the project = 7,800
  • Number of scans completed = 4,951
  • Number of scans left to do = 7,800 – 4,951 = 2,849

Scanning time to completion

  • Number of scans left = 2,849
  • 2,849/42.4/hr = 2 hrs

Quality Control

  • Number of files to QC in the project = 7,800
  • Number of files completed = 3,712
  • Number of files left to do = 7,800 – 3,712 = 4,088

QC hours to completion

  • Number of scans left to scan = 4,088
  • 4,088/68.8 = 4 hrs

The amount of time left to complete the project

  • Scanning – 67.2 hrs
  • Quality Control – 59.4 hrs
  • Total = 126.2 hrs
  • + 30% = 38
  • Grand Total = 164.2 hrs

Isolate an error

Errors inevitably occur during most digitization projects.  The DWR can be used to identify how widespread the error is by using a combination of filtering, the digitization guide (which is an inventory of images captured along with other metadata about the capture process), and inspecting the images.  As an example, a set of files may be found to have no color profile.  The digitization guide can be used to identify the day the erroneous images were created and who created them. The DWR can be used to filter by the scanner operator and date to see if the error is isolated to a particular person, a particular machine or a particular day.  This information can then be used to filter by the same variables across collections to see if the error exists elsewhere.  The result of this search can facilitate retraining, recalibrating of capture devices and also identify groups of images that need to be rescanned without having to comb through an entire collection.

While I’ve only touched on the uses of the Daily Work Report, we have used this database in many different ways over the years.  It has continued to answer those recurring questions that come up year after year.  How many scans did we do last year?  How many students worked on that multiyear project?  How many patron requests did we complete last quarter?  This database has helped us do our estimates, isolate problems and provide accurate updates over the years.  For such a simple tool it sure does come in handy.

Web Accessibility: Values and Vigilance

The Duke Libraries are committed to providing outstanding service based on respect and empathy for the diverse backgrounds and needs in our community. Our guiding principles make clear how critically important diversity and inclusion are to the library, and the extent to which we strive to break down barriers to scholarship.

One of the biggest and most important barriers for us to tackle is the accessibility of our web content. Duke University’s Web Accessibility site sums it up well:

Duke believes web content needs to be accessible to people with a wide range of abilities, including visual, auditory, physical, speech, cognitive, language, learning, and neurological abilities.

Screenshot of Duke Web Accessibility homepage
The Duke Web Accessibility website is a tremendous resource for the Duke community.

This belief is also consistent with the core values expressed by the American Library Association (ALA). A library’s website and online resources should be available in formats accessible to people of all ages and abilities.

Web Content

As one of the largest research libraries in the U.S., we have a whole lot of content on the web to consider.

Our website alone comprises over a thousand pages with more than fifty staff contributors. The library catalog interface displays records for over 13 million items at Duke and partner libraries. Our various digital repositories and digital exhibits platforms host hundreds of thousands of interactive digital objects of different types, including images, A/V, documents, datasets, and more. The list goes on.

Any attempt to take a full inventory of the library’s digital content reveals potentially several million web pages under the library’s purview, and all that content is managed and rendered via a dizzying array of technology platforms. We have upwards of a hundred web applications with public-facing interfaces. We built some of these ourselves, some are community-developed (with local customizations), and others we have licensed from vendors. Some interfaces are new, some are old. And some are really old, dating all the way back to the mid-90s.

Ensuring that this content is equally accessible to everyone is important, and it is indeed a significant undertaking. We must also be vigilant to ensure that it stays accessible over time.

With that as our context, I’d like to highlight a few recent efforts in the library to improve the accessibility of our digital resources.

Style Guide With Color Contrast Checks

In January 2019, we launched a new catalog, replacing a decade-old platform and its outdated interface. As we began developing the front-end, we knew we wanted to be consistent, constrained, and intentional in how we styled elements of the interface. We were especially focused on ensuring that any text in the UI had sufficient contrast with its background to be accessible to users with low vision or color-blindness.

We tried out a few existing “living style guide” frameworks. But none of them proved to be a good fit, particularly for color contrast management. So we ended up taking a DIY approach and developed our own living style guide using Javascript and Ruby.

Screenshot of the library catalog style guide showing a color palette.
The library catalog’s living style guide dynamically checks for color contrast accessibility.

Here’s how it works. In our templates we specify the array of color variable names for each category. Then we use client-side Javascript to dynamically measure the hex & RGB values and the luminance of each color in the guide. From those figures, we return score labels for black and white contrast ratios, color-coded for WCAG 2.0 compliance.

This style guide is “living” in that it’s a real-time up-to-date reflection of how elements of the UI will appear when using particular color variable names and CSS classes. It helps to guide developers and other project team members to make good decisions about colors from our palette to stay in compliance with accessibility guidelines.

Audiovisual Captions & Interactive Transcripts

In fall 2017, I wrote about an innovative, custom-developed feature in our Digital Repository that renders interactive caption text for A/V within and below our media player. At that time, however, none of our A/V items making use of that feature were available to the public.  In the months since then, we have debuted several captioned items for public access.

We extended these features in 2018, including: 1) exporting captions on-the-fly as Text, PDF, or original WebVTT files, and 2) accommodating transcript files that originated as documents (PDF, Word)

Screenshot of an interactive transcript with export options
WebVTT caption files for A/V are rendered as interactive HTML transcripts and can be exported into text or PDF.

Two of my talented colleagues have shared more about our A/V accessibility efforts at conferences over the past year. Noah Huffman presented at ARCHIVES*RECORDS (Joint Annual Meeting of CoSA, NAGARA, and SAA) in Aug 2018. And Molly Bragg presented at Digital Library Federation (DLF) Forum (slides) in Nov 2018.

Institutional Repository Accessibility

We have documented our work over 2018 revitalizing DSpace at Duke, and then subsequently developing a new set of innovative features that highlight Duke researchers and the impact of their work. This spring, we took a closer look at our new UI’s accessibility following Duke’s helpful guide.
In the course of this assessment, we were able to identify (and then fix!) several accessibility issues in DukeSpace. I’ll share two strategies in particular from the guide that proved to be really effective. I highly recommend using them frequently.

The Keyboard Test

How easy is it to navigate your site using only your keyboard? Can you get where you want to go using TAB, ENTER, SPACE, UP, and DOWN?  Is it clear which element of the page current has the focus?
Screenshot of DukeSpace homepage showing skip to content link
A “Skip to main content” feature in DukeSpace improves navigation via keyboard or assistive devices.
This test illuminated several problems. But with a few modest tweaks to our UI markup, we were able to add semantic markers to designate page sections and a skip to main content link, making the content much more navigable for users with keyboards and assistive devices alike.

A Browser Extension

If you’re a developer like me, chances are you already spend a lot of time using your browser’s Developer Tools pane to look under the hood of web pages, reverse-engineer UIs, mess with styles and markup, or troubleshoot problems.
The Deque Systems aXe Chrome Extension (also available for Firefox) integrates seamlessly into existing Dev Tools. It’s a remarkably useful tool to have in your toolset to help quickly find and fix accessibility issues. Its interface is clear and easy to understand. It finds and succinctly describes accessibility problems, and even tells you how to fix them in your code.
An image from the Deque aXe Chrome extension site showing the tool in action.
With aXe testing, we quickly learned we had some major issues to fix. The biggest problems revealed were missing form labels and page landmarks, and low contrast on color pairings. Again, these were not hard to fix since the tool explained what to do, and where.
Turning away from DSpace for a moment, see this example article published on a popular academic journal’s website. Note how it fares with an automated aXe accessibility test (197 violations of various types found).  And if you were using a keyboard, you’d have to press Tab over 100 times in order to download a PDF of the article.
Screenshot of aXe Chrome extension running on a journal website.
UI for a published journal article in a publisher’s website after running the aXe accessibility test. Violations found: 197.

Now, let’s look at the open access copy of that same article that resides in our DukeSpace site. With our spring 2019 DukeSpace accessibility revisions in place, when we run an aXe test, we see zero accessibility violations. Our interface is also now easily navigated without a mouse.

Screenshot or DukeSpace UI showing no violations found by aXe accessibility checker
Open access copy of an article in DukeSpace: No accessibility violations found.

Here’s another example of an open access article in DukeSpace vs. its published counterpart in the website of a popular journal (PNAS).  While the publisher’s site markup addresses many common accessibility issues, it still shows seven violations in aXe. And perhaps most concerning is that it’s completely unnavigable via a keyboard: the stylesheets have removed all focus styles from displaying.

Concluding Thoughts

Libraries are increasingly becoming champions for open access to scholarly research. The overlap in aims between the open access movement and web accessibility in general is quite striking. It all boils down to removing barriers and making access to information as inclusive as possible.

Our open access repository UIs may never be able to match all the feature-rich bells and whistles present in many academic journal websites. But accessibility, well, that’s right up our alley. We can and should do better. It’s all about being true to our values, collaborating with our community of peers, and being vigilant in prioritizing the work.

Look for many more accessibility improvements throughout many of the library’s digital resources as the year progresses.


Brief explanatory note about the A11Y++ image in this post: A11Y is a numeronym — shorthand for the word “accessibility” and conveniently also visually resembling the word “ally.” The “++” is an increment operator in many programming languages, adding one to a variable. 

My Family Story through the Duke Digital Collections Program

Hello! This is my first blog as the new Digital Production Service Manager, and I’d like to take this opportunity to take you, the reader, through my journey of discovering the treasures that the Duke Digital Collections program offers. To personalize this task, I  explored the materials related to my family’s journey to the United States. First, I should contextualize. After migrating from south China in the mid-1800s, my family fled Vietnam in the late 1970s and we left with the bare necessities – mainly food, clothes, and essential documents. All I have now are a few family pictures from that era and vividly told stories from my parents to help me connect the dots of my family’s history.

When I started delving into Duke’s Digital Collections, it was heartening to find materials of China, Vietnam, and even anti-war materials in the U.S. The following are some materials and collections that I’d like to highlight.

The Sidney D. Gamble Photographs offer over 5,000 photographs of China in the early 20th century. Images of everyday life in China and landscapes are available in this collection.The above image from the Gamble collection, is that of a junk, or houseboat, photographed in the early 1900s. When my family fled Vietnam, fifty people crammed into a similar vessel and sailed in the dead of night along the Gulf of Tonkin. My parents spoke of how they were guided by the moonlight and how fearful they were of the junk catching fire from cooking rice.

The African American Soldier’s Vietnam War photograph album collection offers these gorgeous images of Vietnam. This is the country that was home for multiple generations for my family, and up until the war, it was a good life. I am astounded and grateful that these postcards were collected by an American soldier in the middle of war. Considering that I grew up in Los Angeles, California, I have no sense of the world that my parents inhabited, and these images help me appreciate their stories even more. On the other side of the planet, there were efforts to stop the war and it was intriguing to see a variety of digital collections depicting these perspectives through art and documentary photography. The image below is that of a poster from the Italian Cultural Posters collection depicting Uncle Sam and the Viet Cong.

In addition to capturing street scenes in London, the Ronald Reis Collection, includes images of Vietnam during the war and anti-war effort in the United States. The image below is that of a demonstration in Bryant Park in New York City. I recognize that the conflict was fought on multiple fronts and am grateful for these demonstrations, as they ultimately led to the end of the war.Lastly, the James Karales Photos collection depicts Vietnam during the war. The image below, titled “Soldiers leaving on helicopter” is one that reminds me of my uncle who left with the American soldiers and started a new life in the United States. In 1980, thanks to the Family Reunification Act, the aid of the American Red Cross, and my uncle’s sponsorship, we started a new chapter in America.

Perhaps this is typical of the immigrant experience, but it still is important to put into words. Not every community has the resources and the privilege to be remembered, and where there are materials to help piece those stories together, they are absolutely valued and appreciated. Thank you, Duke University Libraries, for making these materials available.

Digitization Details: The Process of Digitizing a Collection

About four and a half years ago I wrote a blog post here on Bitstreams titled: “Digitization Details: Before We Push the “Scan” Button” in which I wrote about how we use color calibration, device profiling and modified viewing environments to produce “consistent results of a measurable quality” in our digital images.  About two and a half years ago, I wrote a blog post adjacent to that subject titled “The FADGI Still Image standard: It isn’t just about file specs” about the details of the FADGI standard and how its guidelines go beyond ppi and bit depth to include information about UV light, vacuum tables, translucent material, oversized material and more.  I’m surprised that I have never shared the actual process of digitizing a collection because that is what we do in the Digital Production Center.

Building digital collections is a complex endeavor that requires a cross-departmental team that analyzes project proposals, performs feasibility assessments, gathers project requirements, develops project plans, and documents workflows and guidelines in order to produce a consistent and scalable outcome in an efficient manner.  We call our cross-departmental team the Digital Collections Implementation Team (DCIT) which includes representatives from the Conservation staff, Technical Services, Digital Production, Metadata Architects and Digital Collections UI developers, among others.  By having representatives from each department participate, we are able to consider all perspectives including the sticking points, technical limitations and time constraints of each department. Over time, our understanding of each other’s workflows and sticking points has enabled us to refine our approach to efficiently hand off a project between departments.

I will not be going into the details of all the work other departments contribute to building digital collections (you can read just about any post on the blog for that). I will just dip my toe into what goes on in the Digital Production Center to digitize a collection.

Digitization

Once the specifics of a project are nailed down, the scope of the project has been finalized, the material has been organized by Technical Services, Conservation has prepared the material for digitization, the material has been transferred to the Digital Production Center and an Assessment Checklist is filled out describing the type, condition, size and number of items in a collection, we are ready to begin the digitization process.

Digitization Guide
A starter digitization guide is created using output from ArchivesSpace and the DPC adds 16-20 fields to capture technical metadata during the digitization process. The digitization guide is an itemized list representing each item in a collection and is centrally stored for ease of access. 

Setup
Cameras and monitors are calibrated with a spectrometer.  A color profile is built for each capture device along with job settings in the capture software. This will produce consistent results from each capture device and produce an accurate representation of any items captured which in turn removes subjective evaluation from the scanning process.

Training
Instructions are developed describing the scanning, quality control, and handling procedures for the project and students are trained.

Scanning
Following instructions developed for each collection, the scanner operator will use the appropriate equipment, settings and digitization guide to digitize the collection.  Benchmark tests are performed and evaluated periodically during the project. During the capture process the images are monitored for color fidelity and file naming errors. The images are saved in a structured way on the local drive and the digitization guide is updated to reflect the completion of an item.   At the end of each shift the files are moved to a production server.

Quality Control 1
The Quality Control process is different depending on the device with which an item was captured and the nature of the material.  All images are inspected for:  correct file name, skew, clipping, banding, blocking, color fidelity, uniform crop, and color profile.  The digitization guide is updated to reflect the completion of an item.

Quality Control 2
Images are cropped (leaving no background) and saved as JPEGs for online display.  During the second pass of quality control each image is inspected for: image consistency from operator to operator and image to image, skew and other anomalies.

Finalize
During this phase we compare the digitization guide against the item and file counts of the archival and derivative images on our production server.   Discrepancies such as missing files, misnamed files and missing line items in the digitization guide and are resolved.

Create Checksums and dark storage
We then create a SHA1 checksum for each image file in the collection and push the collection into a staging area for ingest into the repository.

Sometimes this process is referred to simply as “scanning”.

Not only is this process in active motion for multiple projects at the same time, the Digital Production Center also participates in remediation of legacy projects for ingest into the Duke Digital Repository, multispectral imaging, audio digitization and video digitization for, preservation, patron and staff requests… it is quite a juggling act with lots of little details but we love our work!

Time to get back to it so I can get to a comfortable stopping point before the Thanksgiving break!

Vote!

In anticipation of next Tuesday’s midterm elections, here is a photo gallery of voting-related images from Duke Digital Collections. Click on a photo to view more images from our collections dealing with political movements, voting rights, propaganda, activism, and more!

This image is part of a series of photographs taken by James Karales on assignment for Look Magazine during the voting rights march from Selma to Montgomery, Alabama in March 1965.
Propaganda poster of the Italian Socialist Party. It reads: “Workers, vote for socialism means voting for women’s rights and labor.”
Image is part of “Thirteen-Month Crop: One Year in the Life of a Piedmont Virginia Tobacco Farm,” which documents the Moore family farm in Pittsylvania County, Virginia.
Poster with depiction of large PCI flag with the Italian flag behind it.
Leaflet created by the League of Women Voters of North Carolina.
Socialist Party literature, explaining their views.

If you haven’t already taken advantage of early voting, we at Bitstreams encourage you to exercise your right on November 6!

“To Greenland in 105 Days, or, Why Did I Ever Leave Home”: Henry J. Oosting’s Misadventure in the Arctic (1937)

When Duke professor and botanist Henry J. Oosting agreed to take part in an expedition to Greenland in the summer of 1937 his mission was to collect botanical samples and document the region’s native flora. The expedition, organized and led by noted polar explorer Louise Arner Boyd, included several other accomplished scientists of the day and its principal achievement was the discovery and charting of a submarine ridge off of Greenland’s eastern coast.

Narwhal sketch
Oosting’s sketch of a Narwhal

In a diary he kept during his trip titled “To Greenland in 105 Days, or Why did I ever leave home,” Oosting focuses little on the expedition’s scientific exploits. Instead, he offers a more intimate look into the mundane and, at times, amusing aspects of early polar exploration. Supplementing the diary in the recently published Henry J. Oosting papers digital collection are a handful of digitized nitrate negatives that add visual interest to his arctic (mis)adventures.

Oosting’s journey got off to an inauspicious start when he wrote in his opening entry on June 9, 1937: “Frankly, I’m not particularly anxious to go now that the time has come–adventure of any sort has never been my line–and the thought of the rolling sea gives me no great cheer.” What follows over the next 200 pages or so, by his own account, are the “inane mental ramblings of a simple-minded botanist,” complete with dozens of equally inane marginal doodles.

Musk Ox Steak doodle
Oosting sketch of Musk Ox steak

The Veslekari, the ship chartered by Louise Boyd for the expedition, first encountered sea ice on July 12 just off the east coast of Greenland. As the ship slowed to a crawl and boredom set in among the crew the following day, Oosting wrote in his diary that “Miss Boyd’s story of the polar bear is worth recording.” He then relayed a joke Boyd told the crew: “If you keep a private school and I keep a private school then why does a polar bear sit on a cake of ice…? To keep its privates cool, of course.”  For clarification, Oosting added: “She says she has been trying for a long time to get just the right picture to illustrate the story but it’s either the wrong kind of bear or it won’t hold its position.”

Hoisting a polar bear
Crew hoisting a polar bear on board the Veslekari

When the expedition finally reached the Greenland coast at the end of July, Oosting spent several days exploring the Tyrolerfjord glacier, gathering plant specimens and drying them on racks in the ship’s engine room. On the glacier, Oosting observed an arctic hare, an ermine, and noted that “my plants are accumulating in such quantity.”

Oosting sketch of foot

As the expedition wore on Oosting grew increasingly frustrated with the daily tedium and with Boyd’s unfailing enthusiasm for the enterprise. “In spite of everything…we are stopping at more or less regular intervals to see what B thinks is interesting,” Oosting wrote on August 19.  “I didn’t go ashore this A.M. for a 15 min. stop even after she suggested it–have heard about it 10 times since…I’ll be obliged to go in every time now regardless or there will be no living with this woman. I am thankful, sincerely thankful, there are only 5 more days before we sail for I am thoroughly fed-up with this whole business.”

Arctic Hare
Arctic Hare

By late August, the Veslekari and crew headed back east towards Bergen, Norway and eventually Newcastle, England, where Oosting boarded a train for London on September 12. “This sleeping car is the silliest arrangement imaginable,” Oosting wrote, “my opinion of the English has gone down–at least my opinion of their ideas of comfort.” After a brief stint sightseeing around London, Oosting boarded another ship in Southampton headed for New York and eventually home to Durham. “It will be heaven to get back to the peace and quiet of Durham,” Oosting pined on September 14, “I’m developing a soft spot for the lousy old town.”

Veslekari
Veslekari, the vessel chartered by Louise Boyd for the 1937 Greenland expedition

Oosting arrived home on September 21, where his diary ends. Despite his curmudgeonly tone throughout and his obsession with recording every inconvenience and impediment encountered along the way, it’s clear from other sources that Oosting’s work on the voyage made important contributions to our understanding of arctic plant life.

In The Coast of Northeast Greenland (1948), edited by Louise Boyd and published by the American Geographic Society, Oosting authored a chapter titled “Ecological Notes on the Flora,” in which he meticulously documented the specimens he collected in the arctic. The onset of World War II and concerns over national security delayed publication of Oosting’s findings, but when released, they provided valuable new information about plant communities in the region.  While Oosting’s diary reveals a man with little appetite for adventure, his work endures.  As the forward to Boyd’s 1948 volume attests:  “When travelers can include significant contributions to science, then adventure becomes a notable achievement.”

Oosting sketch
Oosting sketch

We are Hiring!

Duke University Libraries is recruiting a Digital Production Services Manager to direct the operations of our Digital Production Center, its staff (3 FTE plus student assistants), and associated digitization services. We are seeking someone experienced in leading digitization projects who is excited to partner with colleagues around the library to reformat and preserve unique library collections and provide access to them online. This is an excellent opportunity for someone who likes working with people, projects, and primary sources!

This newly created position combines people and project management responsibilities with hands-on digitization duties. Previous supervisory experience is not required; however, the ability to direct the work of others is essential to this position, as is a service oriented attitude. Strong organizational and project management skills are also a must. Some form of digitization experience in a library or other cultural heritage setting is required for this role as well. The successful candidate will join the highly collaborative Digital Collections and Curation Services department and work under the direct supervision of the department head.

The Digital Production Center (DPC) is a specialized unit that creates digital surrogates of primary resources from Duke University Libraries collections for the purposes of preservation and access. Learn more about the DPC on our web page, or through the Digital Strategies and Technology division’s blog, Bitstreams. To see some of the materials we have digitized, check out Duke Digital Collections online.

Duke is a diverse community committed to the principles of excellence, fairness, and respect for all people. As part of this commitment, we actively value diversity in our workplace and learning environments as we seek to take advantage of the rich backgrounds and abilities of everyone. We believe that when we understand, celebrate, and tap into our uniqueness to creatively solve problems and address shared goals, our possibilities are limitless. Duke University Libraries value diversity of thought, perspective, experience, and background and are actively committed to a culture of inclusion and respect.

Duke offers a comprehensive benefit package, which includes both traditional benefits such as health insurance, leave time and retirement, as well as wide ranging work/life and cultural benefits. Details can be found at: http://www.hr.duke.edu/benefits/index.php.

For a full job description please see https://library.duke.edu/about/jobs/dpsmanager. To apply, submit an electronic resume, cover letter, and list of 3 references: https://hr.duke.edu/careers/apply – refer to requisition #401463554. Review of applications will begin immediately and will continue until the position is filled.

Open, Flip, Scan, Close: Observations from The Duke Chronicle Collection Project

Beginning Launch in….

Exciting news from Digital Collections! The 1990’s decade of The Duke Chronicle is being prepped for completion. It has been nine months since I started scanning The Chronicle, and I have come across some interesting stories and images. Despite the fact that I can’t digest the 1990’s being twenty years ago, flipping through the pages brought back some good memories of those days. They also brought some perspective of events I was too young, and too focused on the new trendiest toy, to recall.

It all falls down

As I’m sure some of you remember, in the 1990’s, the world saw the slow destruction of the massive empire that was the Soviet Union. I was much too young to remember the monumental days of the fall of the Berlin Wall and the gradual independence of the Eastern European nations, but the students at Duke were old enough to witness and digest it. Apparently, there was such an interest in the topic that course enrollments skyrocketed in some areas. Since the situation was so new at the time, professors did not have any readings to assign, and previous course materials were made obsolete! I could see myself being one of the many students signing up for these courses.


Barbecue or peace of mind

Another random yet interesting article I found involved hog farms in North Carolina. Allegedly, the smell was so bad and spread so wide that neighbors were experiencing mood changes. A medical psychology professor completed an odor study, and found people were more depressed, angry and tired compared to people who didn’t live near hog farms. It became enough of an issue for local residents to file a lawsuit against the nearby hog farms. Although I have never lived near a hog farm, if I had to smell feces, urine and hog feed every time I came home, I don’t think I would be a happy camper either.


We have come so far

This particular article hit close to home. The University Archives were worried about navigating the preservation of important emails and other electronic documents. They discussed printing emails back in 1999, but we have now moved on to preserving electronic records in their original form. There are even courses dedicated to the subject in the archival field. It’s funny reading this article after scanning it for the very same purpose. Preservation.


Back in the day

Some more goodies I noticed while scanning this project.

Did anyone have any of these state of the art electronics?

Ohh, so this is how you found out what classes were available.

In the meantime 

I know the students, faculty and staff of the ’90s will probably get a kick out of viewing these old newspaper issues, but I’m sure everyone else will enjoy reading through The Chronicle too. While you wait for the 1990’s to be made available publicly, take a look  at the current digitized Chronicle collection.


Woman: The World Over

An amazing collection of lantern slides depicting women from nations around the world. At first glance, the women in these portraits seem like other portraits of the time, generally nondescript portraits of people at some random moment in time.  But upon closer inspection, and with the use of an accompanying lecture booklet, a much deeper picture is painted of the lives of these women.

Women: The World Over is a commercially-produced set of slides created by the European firm Riley Brothers in Bradford, England in 1901 that boasts a catalogue of 1,500 slide sets for sale or hire with lecture-format captions. These slides include women of different classes, working in agricultural, service, and industrial settings with lecture notes that refer to problematic social conditions for women, particularly regarding marriage, and changing social norms as the 20th century begins.

These lantern slides are part of the Lisa Unger Baskin Collection, a large collection with a common thread of revealing the often hidden role of women working and being productive throughout history.  The slides  will be a part of the exhibition, 500 Years of Women’s Work: the Lisa Unger Baskin Collection on display from March 5-June 15, 2019 in the Biddle Rare Book Room, Stone Family Gallery, and History of Medicine Room.

Included with the images below are transcriptions from the lecture booklet that accompanies this set of slides and contain views of the time and the author’s opinion.

“Arab women. Here we have some city Arab women coming from the well. These women are always veiled in public, the long black veil extending from their eyes down to their waist, and sometimes to their feet. Between their eyes, and stretching upwards to their foreheads, is a curious brass ornament resembling three stout thimbles, one on top of another. This serves a double purpose­ to act as an ornament, and to still further conceal the features. The rest of the figure is enveloped in a long gown with very wide sleeves. No one can fail to be struck with the upright walk of the women in Egypt, and some say it is due to their habit of carrying heavy weights on their heads, which renders it necessary to walk very erect and firmly.”
“Market Women, Madeira. We are now in sunny Madeira, where a group of market women await our notice. The streets of Funchal are always bright and busy. Sledges laden with sugar cane, barrels of wine or luggage, and drawn by oxen, dispute the road with hammock bearers and porters of all descriptions. But the gaily dressed women and girls who hasten about with heavy loads upon their backs, and with bright coloured handkerchiefs upon their heads, are the most interesting sight. Baskets of fruit and vegetables are their commonest burdens, and very picturesque the groups look, whether they are standing at the street corner discussing the rise and fall in prices, or seated upon the ground as in the present instance, or walking slowly homewards in the cool of the day. They are a pleasant folk, and live a life of comparative freedom and pleasure.”
“Hulling Rice in the Philippines. Here we have come across some Philippine women engaged in hulling rice. There are immense rice fields in all parts of the island which give employment to thousands of people. Rice is their staple food and the home product is not yet sufficient for the home consumption. A family of five persons will consume about 250 lbs. of rice per month. No rice husking or winnowing machines are in use, save small ones for domestic purposes The grain is usually husked in a large hard-wood mortar, where it is beaten with a pestle, several women, and sometimes men working over one mortar.”
“Haymaking in Russian. Then we all know that woman from the earliest recorded times has been employed in harvest operations, and has been at home in the field of peace. This seems fitting work for women, and work which she seems always willing to undertake.
The picture introduces us to a Russian haymaker, whose garment is of the most striking colours, and whose frame is built for hard work. The Russian peasantry of her class are a cheerful and contented folk, courteous to strangers, but not too friendly to soap the water.”

All 48 slides and the accompanying booklet will be published on the Digital Collections website later this year, included in the exhibit mentioned above and will also be traveling to the Grolier Club in New York city in December of 2019.  Keep an eye out for them!


Catalog Record: https://search.library.duke.edu/search?id=DUKE008113723

Finding Aid: https://library.duke.edu/rubenstein/findingaids/womantheworldover/