As 2017 reaches its halfway point, we have concluded another busy quarter of development on the Duke Digital Repository (DDR). We have several new features to share, and one we’re particularly delighted to introduce is Rights display.
Back in March, my colleague Maggie Dickson shared our plans for rights management in the DDR, a strategy built upon using rights status URIs from RightsStatements.org, and in a similar fashion, licenses from Creative Commons. In some cases, we supplement the status with free text in a local Rights Note property. Our implementation goals here were two-fold: 1) use standard statuses that are machine-readable; 2) display them in an easily understood manner to users.
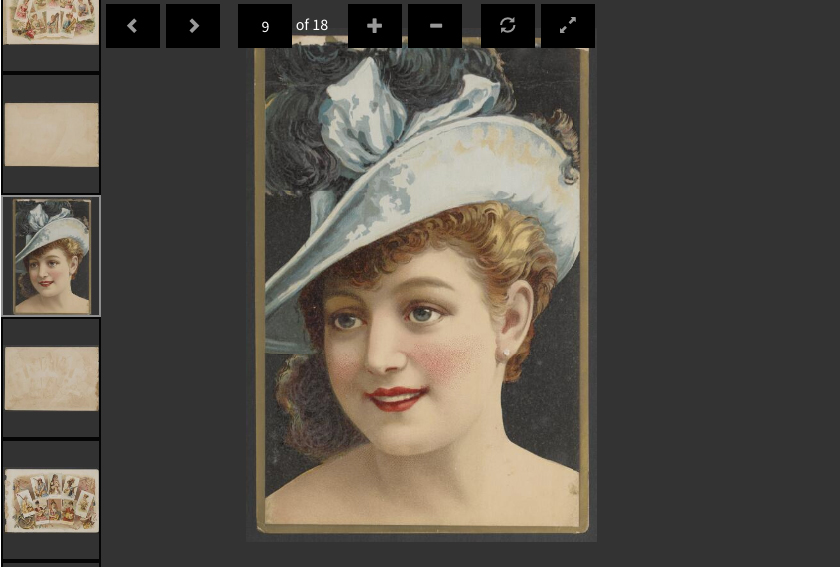
New rights display feature in action on a digital object.
What to Display
Getting and assigning machine-readable URIs for Rights is a significant milestone in its own right. Using that value to power a display that makes sense to users is the next logical step. So, how do we make it clear to a user what they can or can’t do with a resource they have discovered? While we could simply display the URI and link to its webpage (e.g., http://rightsstatements.org/vocab/InC-EDU/1.0/ ) the key info still remains a click away. Alternatively, we could display the rights statement or license title with the link, but some of them aren’t exactly intuitive or easy on the eyes. “Attribution-NonCommercial-NoDerivatives 4.0 International,” anyone?
Inspiration
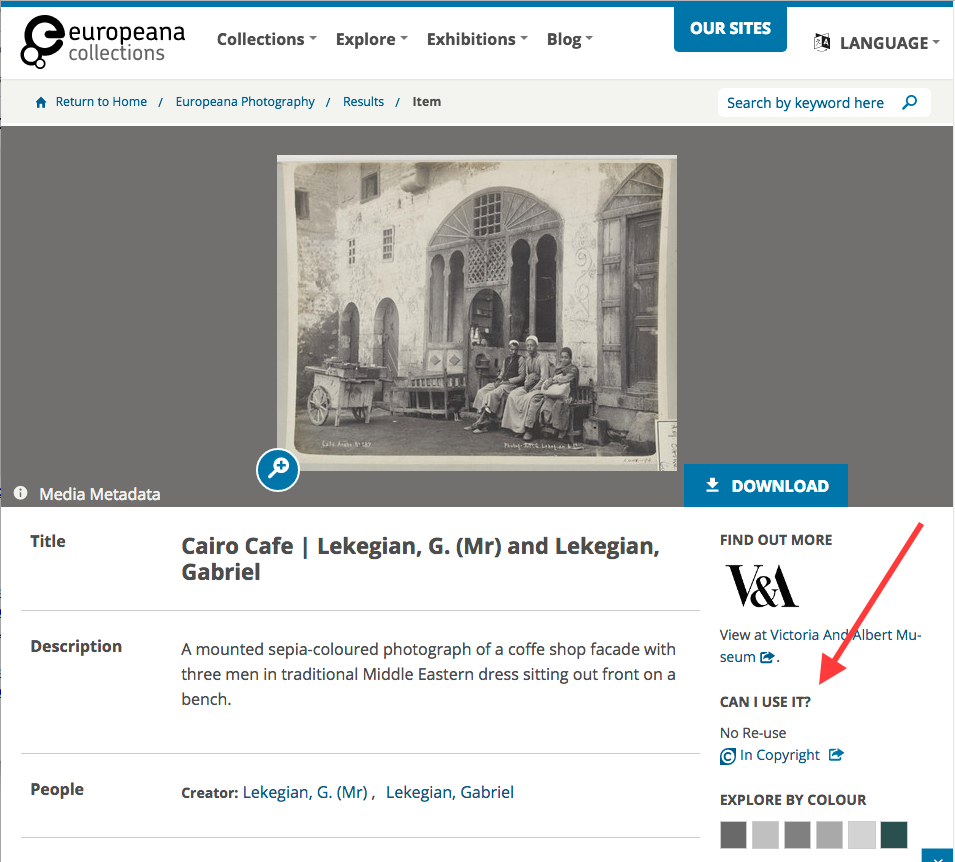
Looking around to see how other cultural heritage institutions have solved this problem led us to very few examples. RightsStatements.org is still fairly new and it takes time for good design patterns to emerge. However, Europeana — co-champion of the RightsStatements.org initiative along with DPLA — has a stellar collections site, and, as it turns out, a wonderfully effective design for displaying rights statuses to users. Our solution ended up very much inspired by theirs; hats off to the Europeana team.
Europeana Collections UI.
Icons
Both Creative Commons and RightsStatements.org provide downloadable icons at their sites (here and here). We opted to store a local copy of the circular SVG versions for both to render in our UI. They’re easily styled, they don’t take up a lot of space, and used together, they have some nice visual unity.
Circular icons from Creative Commons & RightsStatements.org
Labels & Titles
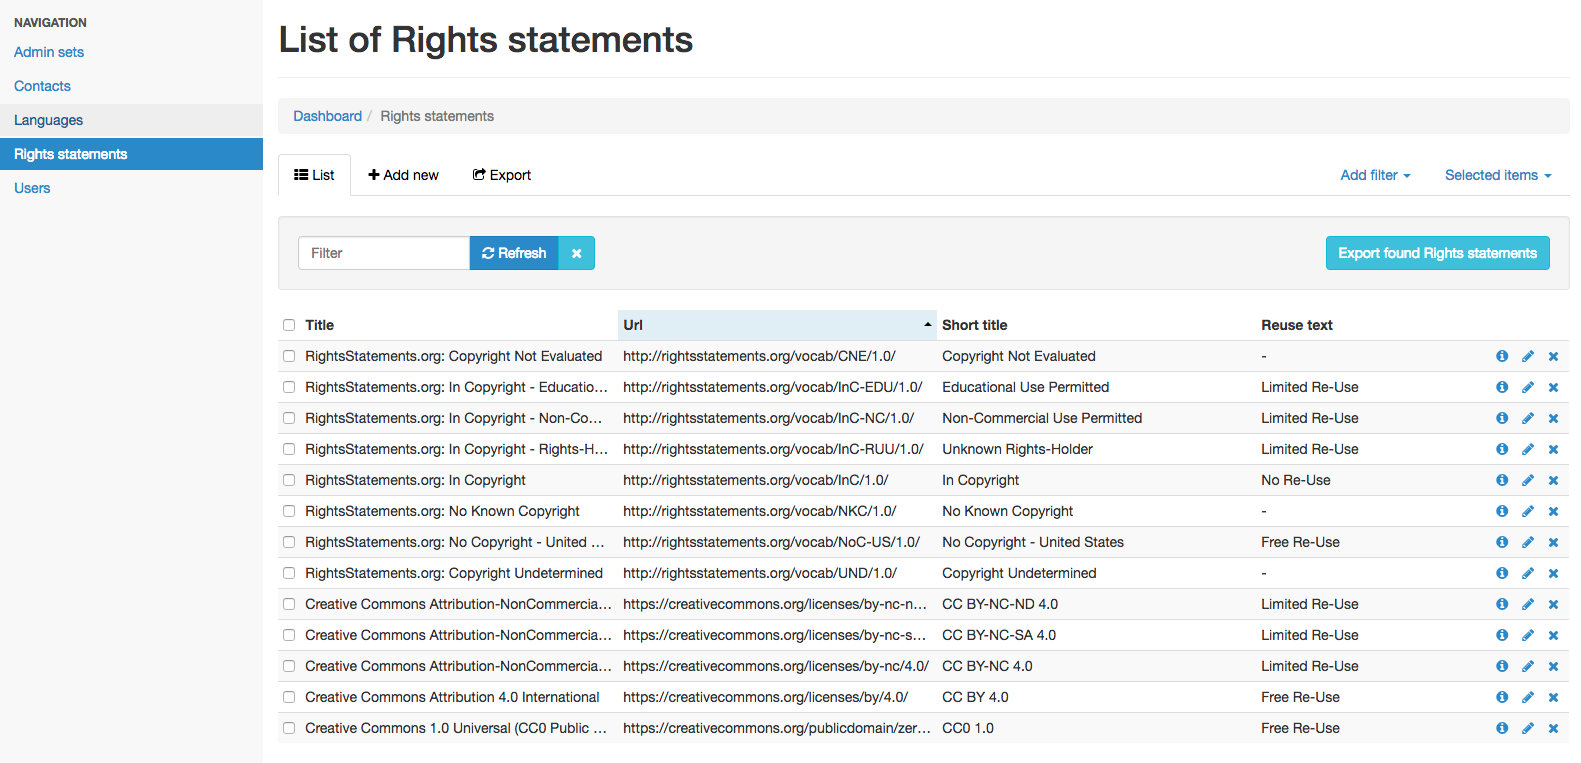
We have a lightweight Rails app with an easy-to-use administrative UI for managing auxiliary content for the DDR, so that made a good home for our rights statuses and associated text. Statements are modeled to have a URI and Title, but can also have three additional optional fields: short title, re-use text, and an array of icon classes.
Editing rights info associated with each statement.
Displaying the Info
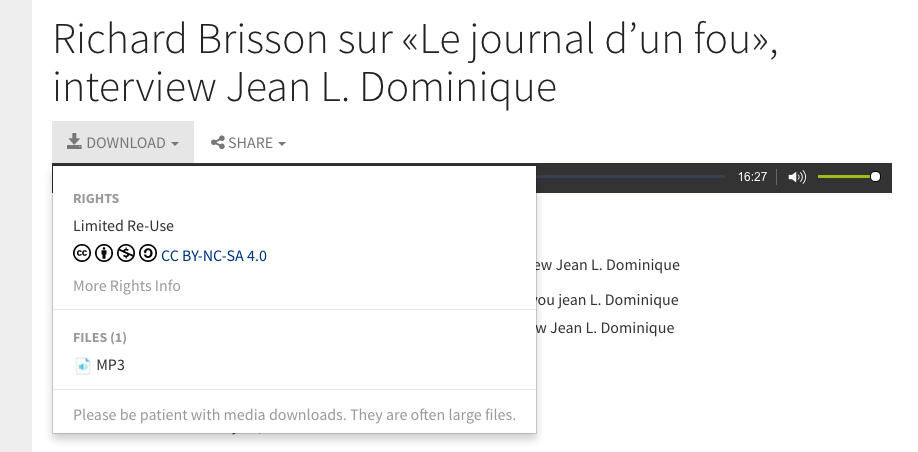
We wanted to be sure to show the rights status in the flow of the rest of an object’s metadata. We also wanted to emphasize this information for anyone looking to download a digital object. So we decided to render the rights status prominently in the download menu, too.
Rights status displays in the download menu.
Rights status also displays alongside other metadata.
What’s Next
Our focus in this area now shifts toward applying these newly available rights statuses to our existing digital objects in the repository, while ensuring that new ingests/deposits get assessed and assigned appropriate values. We’ll also have opportunities to refine where and how the statuses get displayed. We stand to learn a lot from our peer organizations implementing their own rights management strategies, and from our visitors as they use this new feature on our site. There’s a lot of work ahead, but we’re thrilled to have reached this noteworthy milestone.
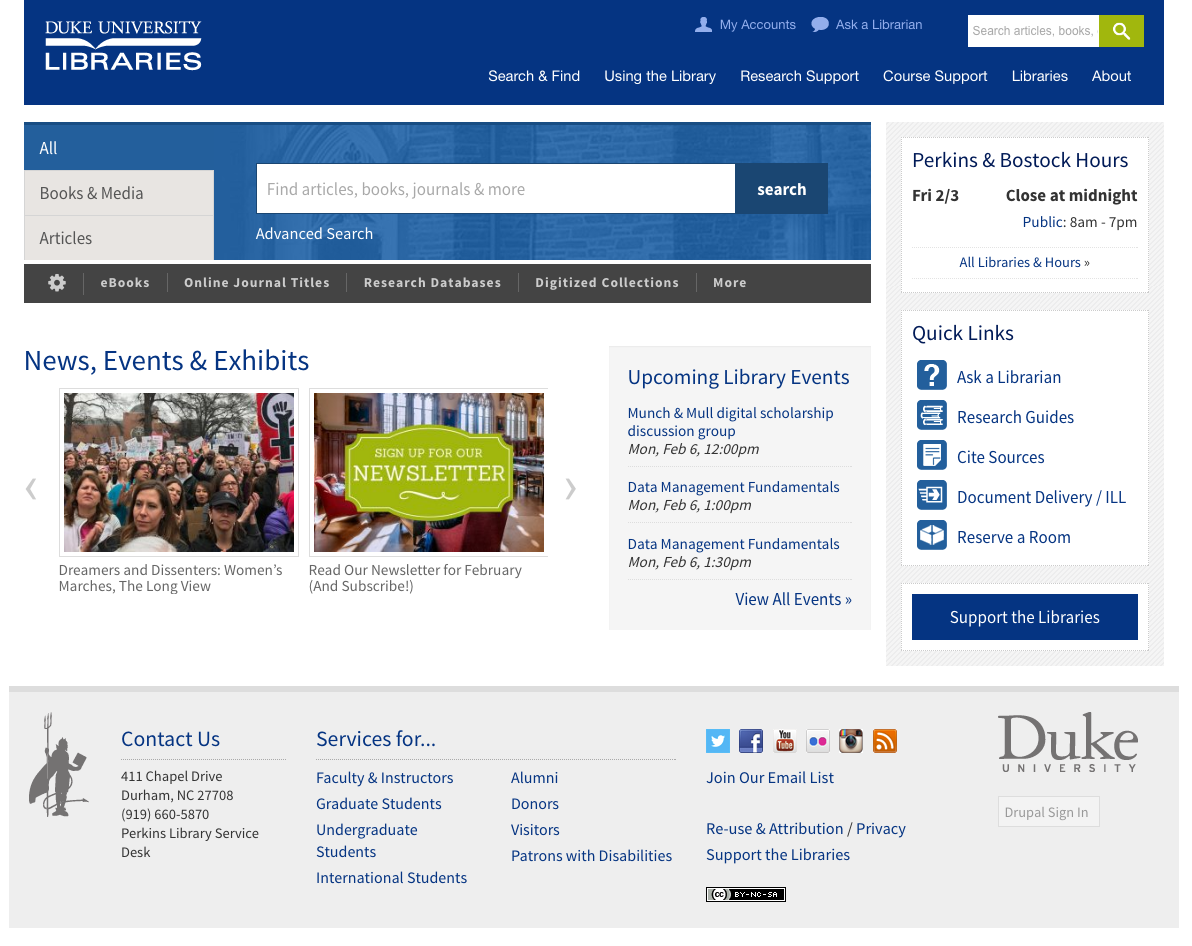
If you’ve visited the Duke University Libraries website in the past month, you may have noticed that it looks a bit more polished than it used to. Over the course of the fall 2016 semester, my talented colleague Michael Daul and I co-led a project to develop and implement a new theme for the site. We flipped the switch to launch the theme on January 6, 2017, the week before spring classes began. In this post, I’ll share some background on the project and its process, and highlight some noteworthy features of the new theme we put in place.
Newly refreshed Duke University Libraries website homepage.
Goals
We kicked off the project in Aug 2016 using the title “Website Refresh” (hat-tip to our friends at NC State Libraries for coining that term). The best way to frame it was not as a “redesign,” but more like a 50,000-mile maintenance tuneup for the site. We had four main goals:
Extend the Life of our current site (in Drupal 7) without a major redesign or redevelopment effort
Refresh the Look of the site to be modern but not drastically different
Better Code by streamlining HTML markup & CSS style code for easier management & flexibility
Enhance Accessibility via improved compliance with WCAG accessibility guidelines
Our site is fairly large and complex (1,200+ pages, for starters). So to keep the scope lean, we included no changes in content, information architecture, or platform (i.e., stayed on Drupal 7). We also worked with a lean stakeholder team to make decisions related to aesthetics.
Extending the Life of the Site
Our old website theme was aging; the project leading to its development began five years ago in Sep 2012, was announced in Jan 2013, and then eventually launched about three years ago in Jan 2014. Five years–and even three–is a long time in web years. Sites accumulate a lot of code cruft over time, the tools for managing and writing code become deprecated quickly. We wanted to invest a little time now to replace some pieces of the site’s front-end architecture with newer and better replacements, in order to buy us more time before we’d have to do an expensive full-scale overhaul from the ground up.
Refreshing the Look
Our 2014 site derived a lot its aesthetic from the main Duke.edu website at the time. Duke’s site has changed significantly since then, and meanwhile, web design trends have changed dramatically: flat design is in, skeuomorphism out. Google Web Fonts are in, Times, Arial, Verdana and company are out. Even a three year old site on the web can look quite dated.
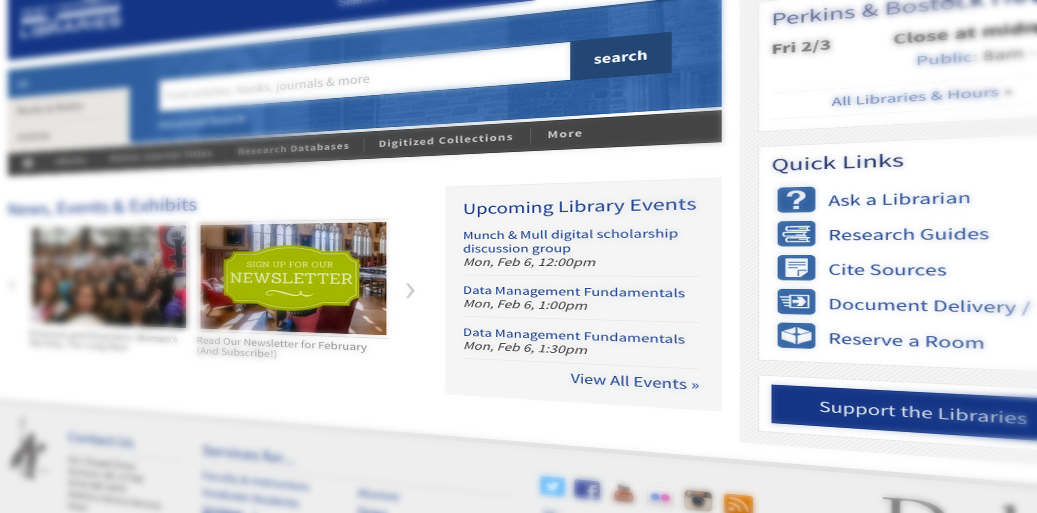
Old site theme, dated aesthetics.New “refreshed” theme, with flatter, more modern aestheticCloseup on skeuomorphic embellishments vs. flat elements.
Better Code
Beyond evolving aesthetics, the various behind-the-scenes web frameworks and code workflows are in constant, rapid flux; it can really keep a developer’s head on a swivel. Better code means easier maintenance, and to that end our code got a lot better after implementing these solutions:
Bootstrap Upgrade. For our site’s HTML/CSS/JS framework, we moved from Bootstrap version 2 (2.3.1) to version 3 (3.3.7). This took weeks of work: it meant thousands of pages of markup revisions, only some of which could be done with a global Search & Replace.
Sass for CSS. We trashed all of our old theme’s CSS files and started over using Sass, a far more efficient way to express and maintain style rules than vanilla CSS.
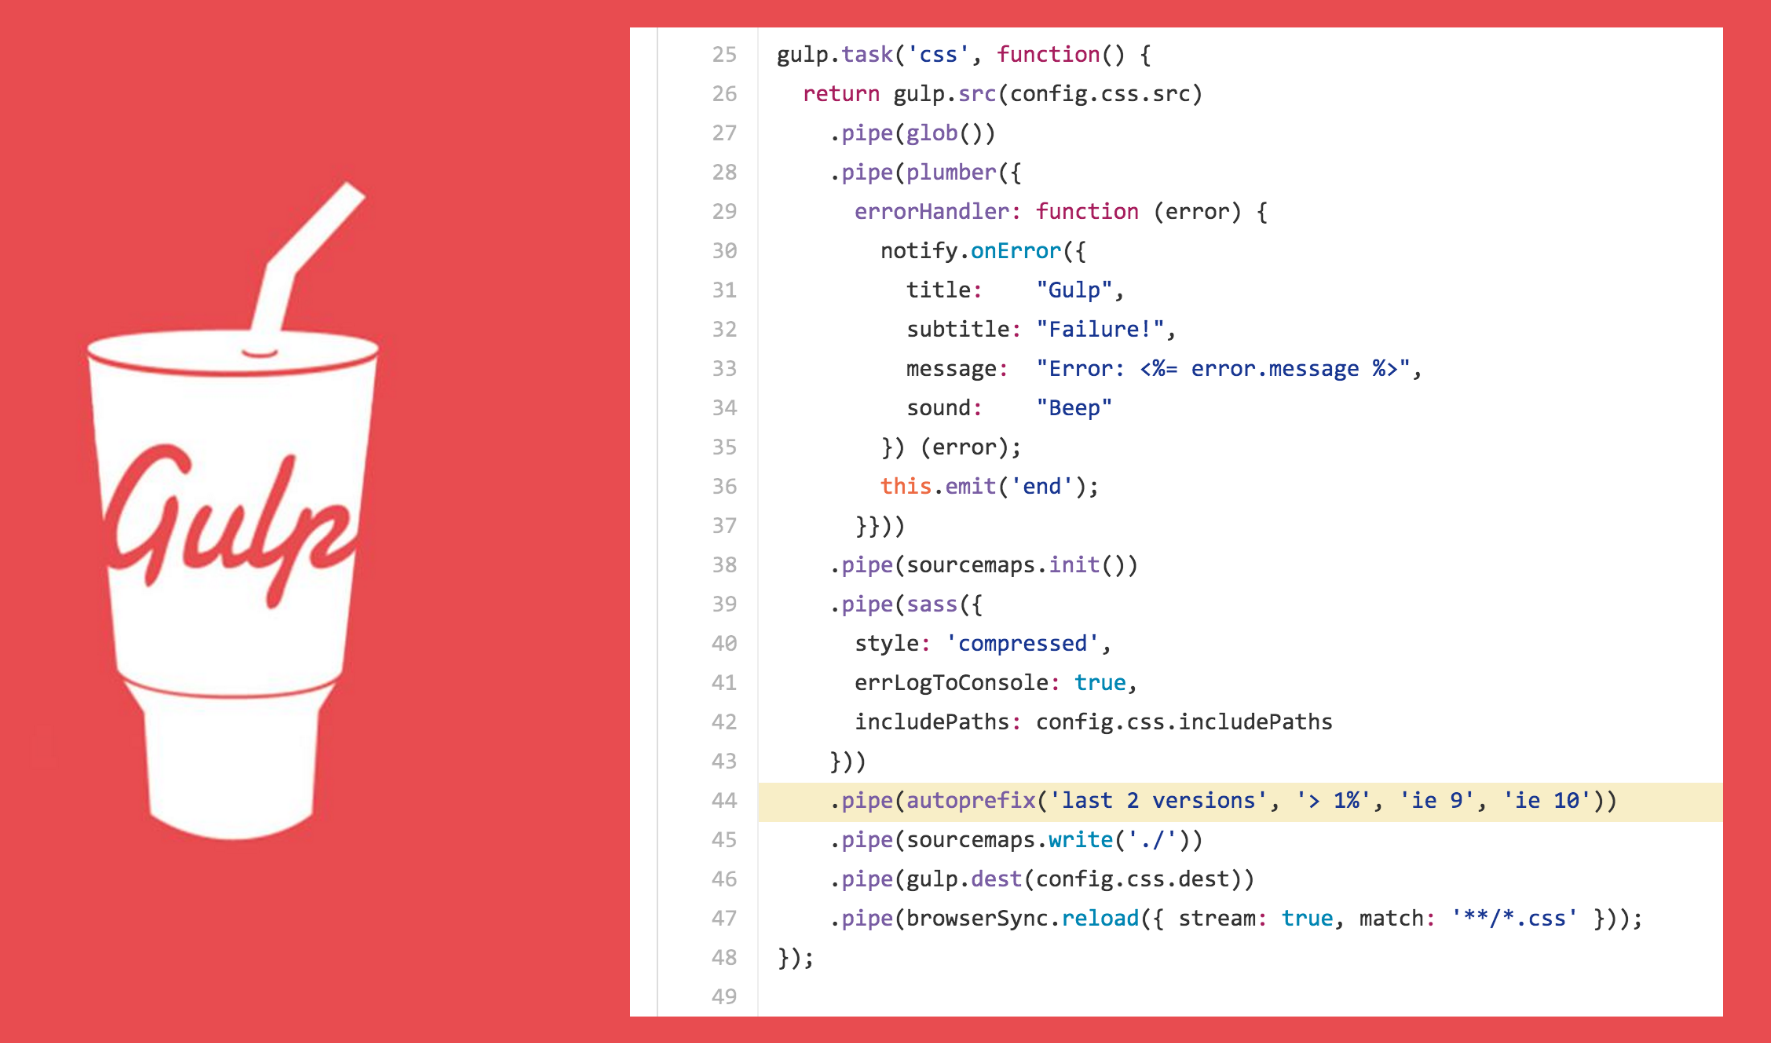
Gulp for Automation. Our new theme uses Gulp to automate code tasks like processing Sass into CSS, auto-prefixing style declarations to work on older browsers, and crunching 30+ css files down into one.
Font Awesome. We ditched most of our older image-based icons in favor of Font Awesome ones, which are far easier to reference and style, and faster to load.
Radix. This was an incredibly useful base theme for Drupal that encapsulates/integrates Sass, Gulp, Bootstrap, and FontAwesome. It also helped us get a Bootswatch starter theme in the mix to minimize the local styling we had to do on top of Bootstrap.
We named our new theme Dulcet and put it up on GitHub.
Sass for style management, e.g., expressing colors as reusable variables.Gulp for task automation, e.g., auto-prefixing styles to account for older browser workarounds.
Accessibility
Some of the code and typography revisions we’ve made in the “refresh” improve our site’s compliance with WCAG2.0 accessibility guidelines. We’re actively working on further assessment and development in this area. Our new theme is better suited to integrate with existing tools, e.g., to automatically add ARIA attributes to interactive page elements.
Feedback or Questions?
We would love to hear from you if you have any feedback on our new site, if you spot any oddities, or if you’re considering doing a similar project and have any questions. We encourage you to explore the site, and hope you find it a refreshing experience.
We’re excited to have released nine digitized collections online this week in the Duke Digital Repository (see the list below ). Some are brand new, and the others have been migrated from older platforms. This brings our tally up to 27 digitized collections in the DDR, and 11,705 items. That’s still just a few drops in what’ll eventually be a triumphantly sloshing bucket, but the development and outreach we completed for this batch is noteworthy. It changes the game for our ability to put digital materials online faster going forward.
Let’s have a look at the new features, and review briefly how and why we ended up here.
Collection Portals: No Developers Needed
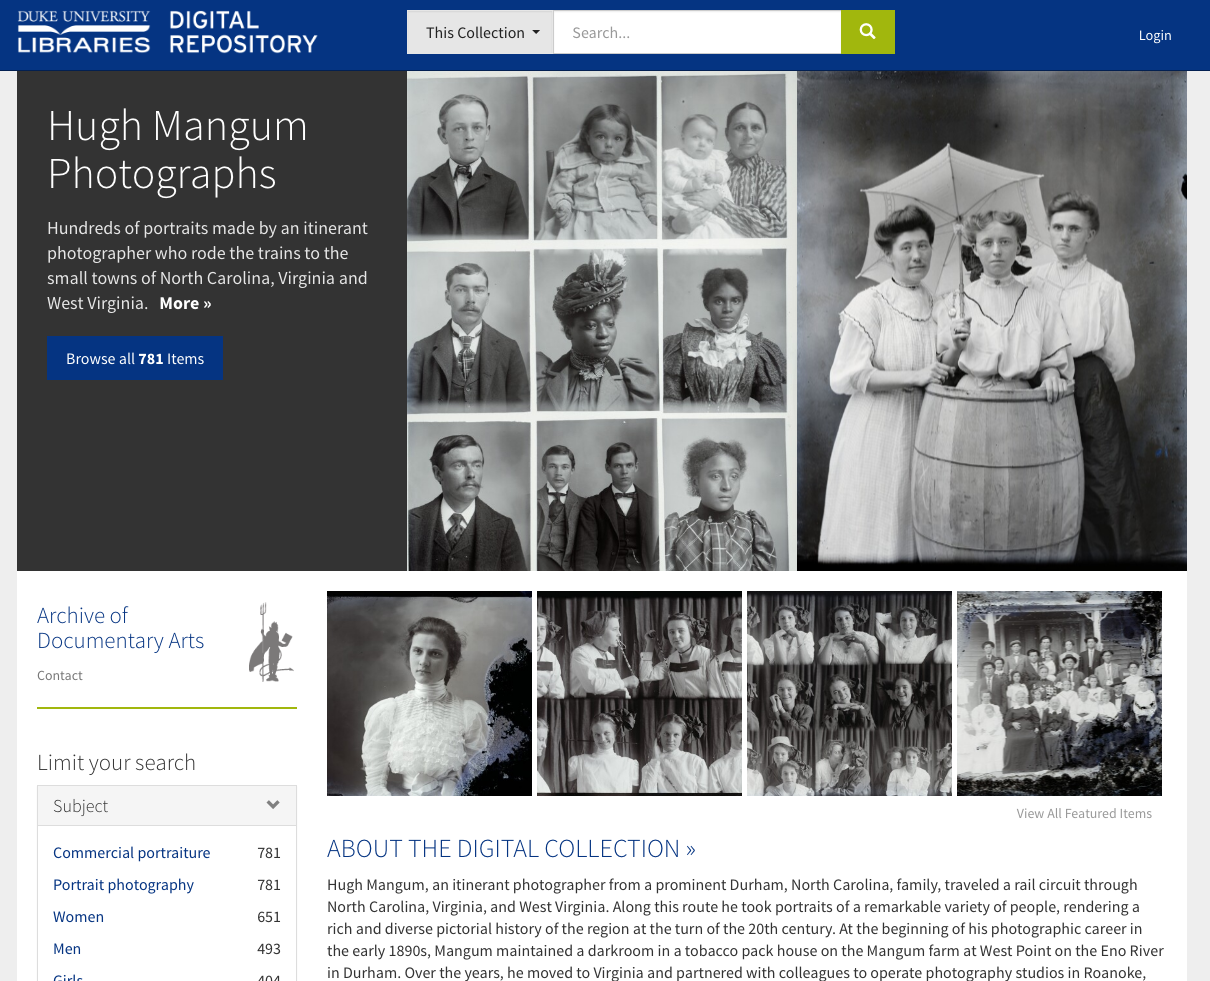
The Hugh Mangum Photographs collection portal, configured to feature selected images.
Before this week, each digital collection in the DDR required a developer to create some configuration files in order to get a nice-looking, made-to-order portal to the collection. These configs set featured items and their layout, a collection thumbnail, custom rules for metadata fields and facets, blog feeds, and more.
The Duke Chapel Recordings collection portal, configured with customized facets, a blog feed, and images external to the DDR.
It’s helpful to have this kind of flexibility. It can enhance the usability of collections that have distinctive characteristics and unique needs. It gives us a way to show off photos and other digitized images that’d otherwise look underwhelming. But on the other hand, it takes time and coordination that isn’t always warranted for a collection.
We now have an optimized default portal display for any digital collection we add, so we don’t need custom configuration files for everything. A collection portal is not as fancy unconfigured, but it’s similar and the essential pieces are present. The upshot is: the digital collections team can now take more items through the full workflow quickly–from start to finish–putting collections online without us developers getting in the way.
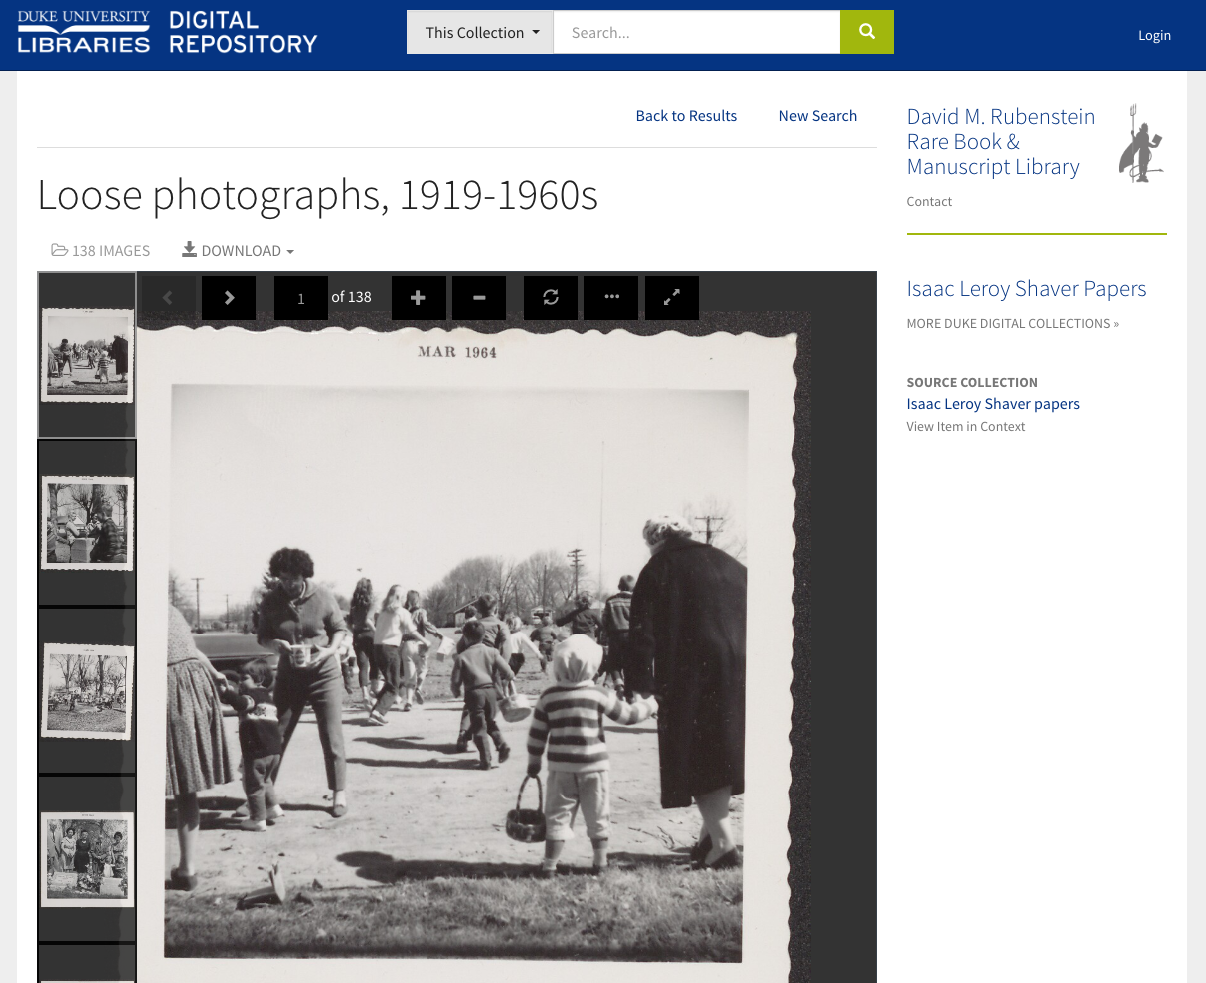
A new “unconfigured” collection portal requiring no additional work by developers to launch. Emphasis on archival source collection info in lieu of a digital collection description.
Folder Items
To better accommodate our manuscript collections, we added more distinction in the interface between different kinds of image items. A digitized archival folder of loose manuscript material now includes some visual cues to reinforce that it’s a folder and not, e.g., a bound album, a single photograph, or a two-page letter.
Folder items have a small folder icon superimposed on their thumbnail image.Above the image viewer is a folder icon with an image count; the item info header below changes to “Folder Info”
We completed a fair amount of folder-level digitization in recent years, especially between 2011-2014 as part of a collaborative TRLN Large-Scale Digitization IMLS grant project. That initiative allowed us to experiment with shifting gears to get more digitized content online efficiently. We succeeded in that goal, however, those objects unfortunately never became accessible or discoverable outside of their lengthy, text-heavy archival collection guides (finding aids). They also lacked useful features such as zooming, downloading, linking, and syndication to other sites like DPLA. They were digital collections, but you couldn’t find or view them when searching and browsing digital collections.
Many of this week’s newly launched collections are composed of these digitized folders that were previously siloed off in finding aids. Now they’re finally fully integrated for preservation, discovery, and access alongside our other digital collections in the DDR. They remain viewable from within the finding aids and we link between the interfaces to provide proper context.
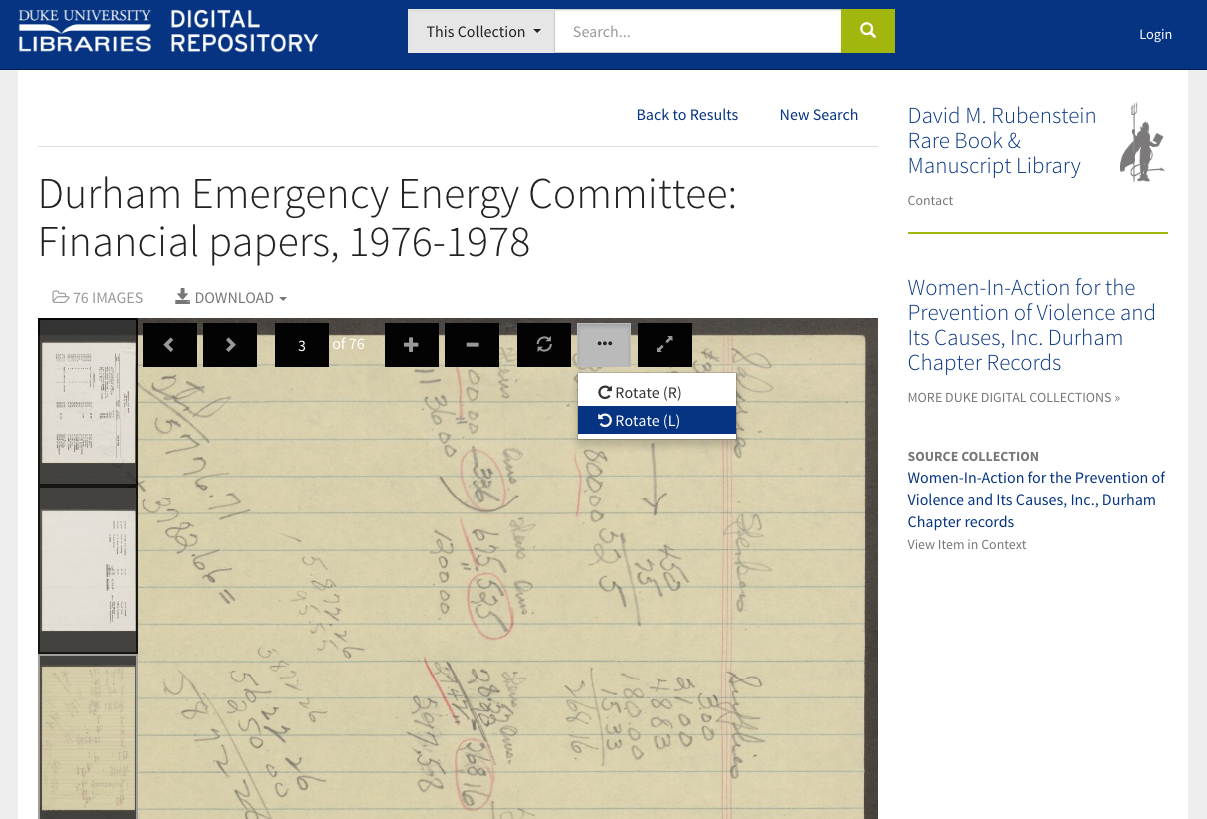
Keyboard Nav & Rotation
Two things are bound to increase when digitizing manuscripts en masse at the folder level: 1) the number of images present in any given “item” (folder); 2) the chance that something of interest within those pages ends up oriented sideways or upside-down. We’ve improved the UI a bit for these cases by adding full keyboard navigation and rotation options.
Rotation options in the image viewer. Navigate pages by keyboard (Page Up/Page Down on Windows, Fn+Up/Down on Mac).
Conclusion
Duke Libraries’ digitization objectives are ambitious. Especially given both the quality and quantity of distinctive, world-class collections in the David M. Rubenstein Library, there’s a constant push to: 1) Go Faster, 2) Do More, 3) Integrate Everything, and 4) Make Everything Good. These needs are often impossibly paradoxical. But we won’t stop trying our best. Our team’s accomplishments this week feel like a positive step in the right direction.
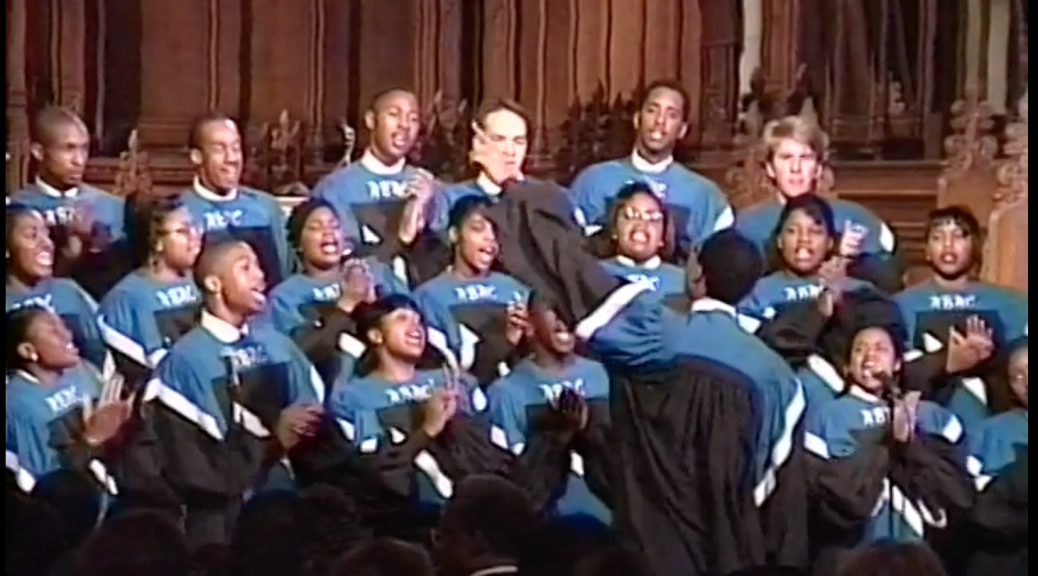
Audiovisual materials account for a significant portion of Duke’s Digital Collections. All told, we now have over 3,400 hours of A/V content accessible online, spread over 14,000 audio and video files discoverable in various platforms. We’ve made several strides in recent years introducing impactful collections of recordings like H. Lee Waters Films, the Jazz Loft Project Records, and Behind the Veil: Documenting African American Life in the Jim Crow South. This spring, the Duke Chapel Recordings collection (including over 1,400 recordings) became our first A/V collection developed in the emerging Duke Digital Repository platform. Completing this first phase of the collection required some initial development for A/V interfaces, and it’ll keep us on our toes to do more as the project progresses through 2019.
A video interface in the Duke Chapel Recordings collection.
Preparing A/V for Access Online
When digitizing audio or video, our diligent Digital Production Center staff create a master file for digital preservation, and from that, a single derivative copy that’s smaller and appropriately compressed for public consumption on the web. The derivative files we create are compressed enough that they can be reliably pseudo-streamed (a.k.a. “progressive download”) to a user over HTTP in chunks (“byte ranges”) as they watch or listen. We are not currently using a streaming media server.
Here’s what’s typical for these files:
Audio. MP3 format, 128kbps bitrate. ~1MB/minute.
Video. MPEG4 (.mp4) wrapper files. ~17MB/minute or 1GB/hour.
The video track is encoded as H.264 at about 2,300 kbps; 640×480 for standard 4:3.
The audio track is AAC-encoded at 160kbps.
These specs are also consistent with what we request of external vendors in cases where we outsource digitization.
The A/V Player Interface: JWPlayer
Since 2014, we have used a local instance of JWPlayer as our A/V player of choice for digital collections. JWPlayer bills itself as “The Most Popular Video Player & Platform on the Web.” It plays media directly in the browser by using standard HTML5 video specifications (supported for most intents & purposes now by all modern browsers).
In the Duke Digital Repository and our archival finding aids, we’re now using the latest version of JWPlayer. It’s got a modern, flat aesthetic and is styled to match our color palette.
JW Player displaying inline video for the Jazz Loft Project Records collection guide.
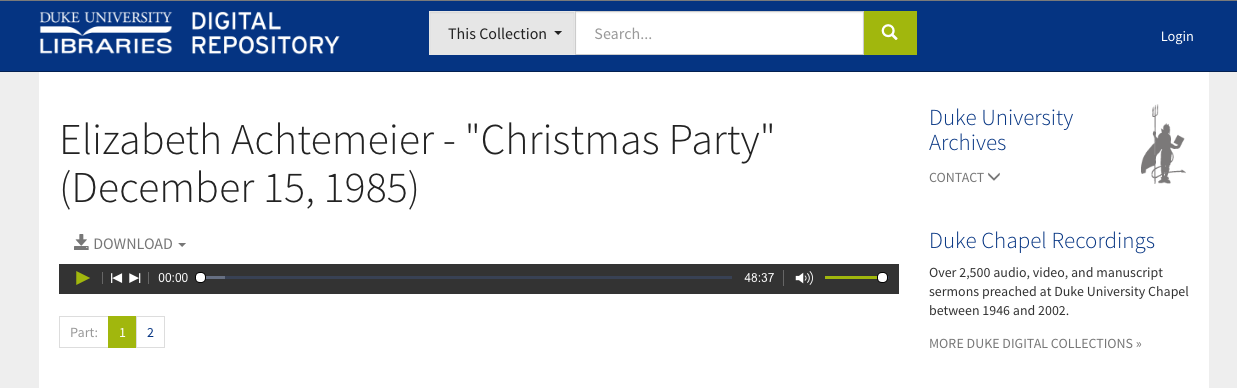
Playlists
Here’s an area where we extended the new JWPlayer with some local development to enhance the UI. When we have a playlist—that is, a recording that is made up of more than one MP3 or MP4 file—we wanted a clearer way for users to navigate between the files than what comes out of the box. It was fairly easy to create some navigational links under the player that indicate how many files are in the playlist and which is currently playing.
A multi-part audio item from Duke Chapel Recordings.
Captions & Transcripts
Work is now underway (by three students in the Duke Divinity School) to create timed transcripts of all the sermons given within the recorded services included in the Duke Chapel Recordings project.
We contracted through Popup Archive for computer-generated transcripts as a starting point. Those are about 80% accurate, but Popup provides a really nice interface for editing and refining the automated text before exporting it to its ultimate destination.
Caption editing interface provided by Popup Archive
One of the most interesting aspects of HTML5 <video> is the <track> element, wherein you can associate as many files of captions, subtitles, descriptions, or chapter information as needed. Track files are encoded as WebVTT; so we’ll use WebVTT files for the transcripts once complete. We’ll also likely capture the start of a sermon within a recording as a WebVTT chapter marker to provide easier navigation to the part of the recording that’s the most likely point of interest.
JWPlayer displays WebVTT captions (and chapter markers, too!). The captions will be wonderful for accessibility (especially for people with hearing disabilities); they can be toggled on/off within the media player window. We’ll also be able to use the captions to display an interactive searchable transcript on the page near the player (see this example using Javascript to parse the WebVTT). Our friends at NCSU Libraries have also shared some great work parsing WebVTT (using Ruby) for interactive transcripts.
The Future
We have a few years until the completion of the Duke Chapel Recordings project. Along the way, we expect to:
add closed captions to the A/V
create an interactive transcript viewer from the captions
work those captions back into the index to aid discovery
add a still-image extract from each video to use as a thumbnail and “poster frame” image
offer up much more A/V content in the Duke Digital Repository
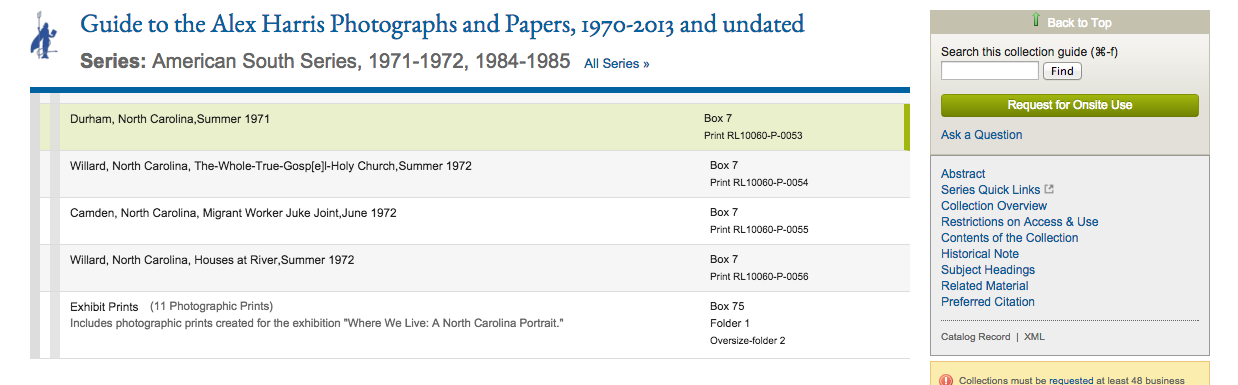
Our new digital collections (the ones in the Duke Digital Repository) have included a prominent link (under header “Source Collection”) from a digitized item to its source archival collection with some snippets of info from the collection guide presented in a popover. This was an important step toward connecting the dots, but still only gets someone to the top of the collection guide; from there, researchers are left on their own for figuring out where in the collection an item resides.
Archival source collection info presented for an item in the W. Duke & Sons collection.
A deep link to View Item in Context for an item in the Alex Harris Photographs Collection
This linkage is powered by indicating an ArchivesSpace ID in a digital object’s administrative metadata; it can be the ID for a series, subseries, folder, or item title, so we’re flexible in how granular the connection is between the digital object and its archival description.
Sticky Title & Series Info
Our archival collection guides are currently rendered as single webpages broken into sections. Larger collections make for long webpages. Sometimes they’re really super long. Where the contents of the collection are listed, there’s a visual hierarchy in place with nested descriptions of series, subseries, etc. but it’s still difficult to navigate around and simultaneously understand what it is you’re viewing. The physical tedium of scrolling and the cognitive load required to connect related descriptive information located far away on a page make for bad usability.
As of last week, we now we keep the title of the collection “stuck” to the top of the screen once you’re no longer viewing the top of the page (it also functions as a link to get back to the top). And even more helpful is a new sticky series header that links to the beginning of the archival series within which the currently visible items were arranged; there’s usually an important description up there that helps contextualize the items listed below. This sticky header is context-aware, meaning it follows you around like a loyal companion, updating itself perpetually to reflect where you are as you navigate up or down.
Title & series information “stuck” to the top of a collection guide.
This feature is powered via the excellent Bootstrap Scrollspy Javascript utility combined with some custom styling.
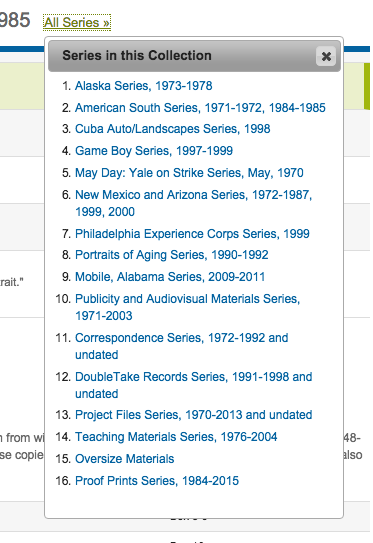
All Series Browser
To give researchers easier browsing between different archival series in a collection, we added a link in the sticky header to browse “All Series.” That link pops down a menu to jump directly to the start of each series within the collection guide.
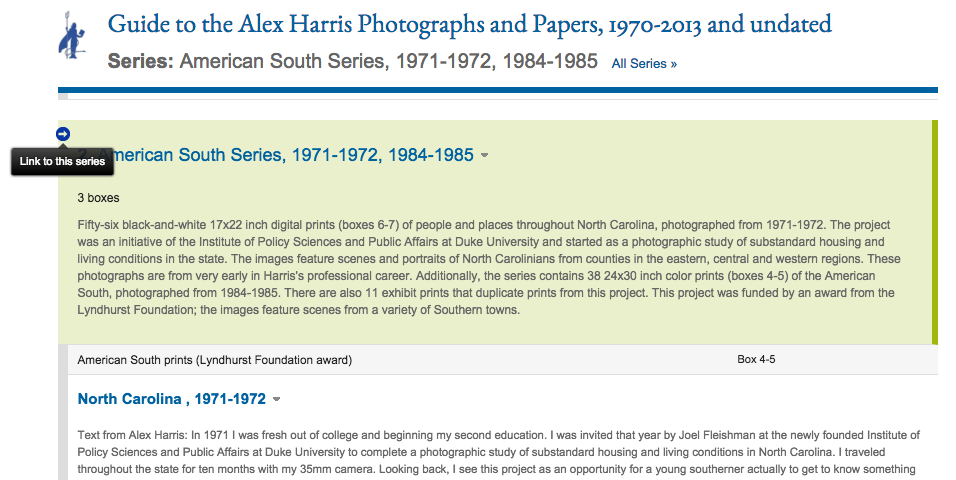
Direct Links to Anything
Researchers can now easily get a link to any row in a collection guide where the contents are described. This can be anything: a series, subseries, folder, or item. It’s simple—just mouseover the row, click the arrow that appears at the left, and copy the URL from the address bar. The row in the collection guide that’s the target of that link gets highlighted in green.
Click the arrow to link directly to a row within the collection guide.
We would love to get feedback on these features to learn whether they’re helpful and see how we might enhance or adjust them going forward. Try them out and let us know what you think!
Special thanks to our metadata gurus Noah Huffman and Maggie Dickson for their contributions on these features.
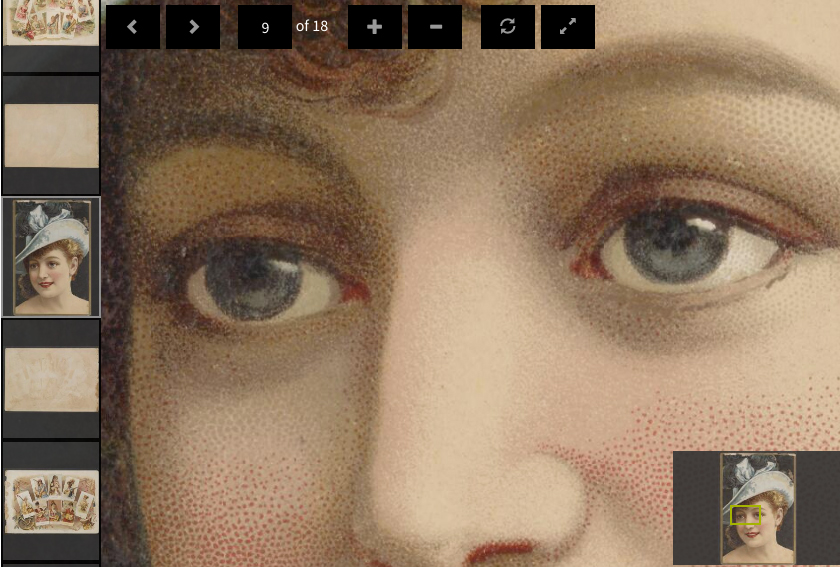
“an open-source, web-based viewer for high-resolution zoomable images, implemented in pure Javascript, for desktop and mobile.”
OpenSeadragon viewer in action on W. Duke & Sons collection.OpenSeadragon zoomed in, W. Duke & Sons collection.
In concert with tiled digital images (we use Pyramid TIFFs), an image server (IIPImage), and a standard image data model (IIIF: International Image Interoperability Framework), OpenSeadragon considerably elevates the experience of viewing our image collections online. Its greatest virtues include:
smooth, continuous zooming and panning for high-resolution images
open source, built on web standards
extensible and well-documented
We can’t wait to get to share more of our image collections in the new platform.
OpenSeadragon Examples Elsewhere
Arthur C. Clarke’s Third Law states, “Any sufficiently advanced technology is indistinguishable from magic.” And looking at high-res images in OpenSeadragon feels pretty darn magical. Here are some of my favorite implementations from places that inspired us to use it:
The Metropolitan Museum of Art. Zooming in close on this van Gogh self-portrait gives you a means to inspect the intense brushstrokes and texture of the canvas in a way that you couldn’t otherwise experience, even by visiting the museum in-person.
Self-Portrait with a Straw Hat (obverse: The Potato Peeler). Vincent van Gogh, 1887.
Chronicling America: Historic American Newspapers (Library of Congress). For instance, zoom to read in the July 21, 1871 issue of “The Sun” (New York City) about my great-great-grandfather George Aery’s conquest being crowned the Schuetzen King, sharpshooting champion, at a popular annual festival of marksmen. The sun. (New York [N.Y.]), 21 July 1871. Chronicling America: Historic American Newspapers. Lib. of Congress.
The software began with a company called Sand Codex, founded in Princeton, NJ in 2003. By 2005, the company had moved to Seattle and changed its name to Seadragon Software. Microsoft acquired the company in 2006 and positioned Seadragon within Microsoft Live Labs.
In March 2007, Seadragon founder Blaise Agüera y Arcase gave a TED Talk where he showcased the power of continuous multi-resolution deep-zooming for applications built on Seadragon. In the months that followed, we held a well-attended staff event at Duke Libraries to watch the talk. There was a lot of ooh-ing and aah-ing. Indeed, it looked like magic. But while it did foretell a real future for our image collections, at the time it felt unattainable and impractical for our needs. It was a Microsoft thing. It required special software to view. It wasn’t going to happen here, not when we were making a commitment to move away from proprietary platforms and plugins.
Sometime in 2008, Microsoft developed a more open Javascript-based version of Seadragon called Seadragon Ajax, and by 2009 had shared it as open-source software via a New BSD license. That curtailed many barriers for use, however it still required a Microsoft server-side framework and Microsoft AJAX library. So in the years since, the software has been re-engineered to be truly open, framework-agnostic, and has thus been rebranded as OpenSeadragon. Having a technology that’s this advanced–and so useful–be so open has been an incredible boon to cultural heritage institutions and, by extension, to the patrons we serve.
Setup
OpenSeadragon’s documentation is thorough, so that helped us get up and running quickly with adding and customizing features. W. Duke & Sons cards were scanned front & back, and the albums are paginated, so we knew we had to support navigation within multi-image items. These are the key features involved:
Sequence Mode. Previous/Next navigation through an image sequence.
Viewport Navigator. Small thumbnail showing current position in overall image.
IIIF Tile Sources. Provide the viewer with an array of IIP-generated IIIF info.json URLs: it does the rest.
Customizations
Some aspects of the interface weren’t quite as we needed them to be out-of-the-box, so we added and customized a few features.
Custom Button Binding. Created our own navigation menu to match our site’s more modern aesthetic.
Page Indicator / Jump to Page. Developed a page indicator and direct-input page jump box using the OpenSeadragon API
Styling. Revised the look & feel with additional CSS & Javascript.
Future Directions: Page-Turning & IIIF
OpenSeadragon does have some limitations where we think that it alone won’t meet all our needs for image interfaces. When we have highly-structured paginated items with associated transcriptions or annotations, we’ll need to implement something a bit more complex. Mirador (example) and Universal Viewer (example) are two example open-source page-viewer tools that are built on top of OpenSeadragon. Both projects depend on “manifests” using the IIIF presentation API to model this additional data.
The Hydra Page Turner Interest Group recently produced a summary report that compares these page-viewer tools and features, and highlights strategies for creating the multi-image IIIF manifests they rely upon. Several Hydra partners are already off and running; at Duke we still have some additional research and development to do in this area.
We’ll be adding many more image collections in the coming months, including migrating all of our existing ones that predated our new platform. Exciting times lie ahead. Stay tuned.
Google Images search for Yahoo Pipes. I tried to screenshot some of ours, but they’re no longer viewable.
Six or seven years ago, we discovered a handy new data mashup service from Yahoo! called Yahoo! Pipes. It had a slick drag-n-drop visual programming interface that made it easy to grab data from a bunch of different live sources, then combine, reshape, and conditionally change it into a new dynamic feed modeled however we happened to need it. “Pipes” was a perfect name, a nod to the | (pipe) character used in Unix to chain command-line inputs and outputs, and evocative of the blue pipes you would drag to connect modules in the Pipes UI to funnel data from one to another. It was—quite literally—a series of tubes.
Over the years, we grew to rely on Yahoo! Pipes’ data-mashing wizardry for several features central to the presentation of information on our library website. If you’ve read Bitstreams in the past, you probably have followed a link that was shuttled through Pipes before ultimately being rendered on the website.
Here’s are some of the things we had done in the library website that Pipes made possible:
New Additions. Create media-rich RSS feeds of New Additions (by category) to the library catalog by mashing raw XML into MediaRSS.
Blogs. Combine RSS feeds from ten or more library blogs into one shared feed.
Jobs. Create a shared RSS feed of library job postings matching any of four job types.
Imagine our dismay in June, when Yahoo! announced it was pulling the plug on Pipes, shutting it down for good in September. In our scramble to find a suitable replacement, we saw Huginn as the best alternative.
Huginn
The amazing Huginn logo, from https://github.com/cantino/huginn/blob/master/README.md
Cleverly named after a raven in Norse mythology, Huginn is an open-source data mashup application. It can do a lot of the things Yahoo! Pipes could, but it’s also quite different.
Similarities to Yahoo! Pipes
Collect data from various sources on the web and transform it
Combine disparate data into a single stream
Emit a new customized feed at a URL for other services to access
Differences from Pipes
No visual editor; instead, you hand-code JSON to configure
Open source rather than hosted; you have to run it yourself
Constantly being improved by developers worldwide
A Ruby on Rails app; can be forked/customized as needed
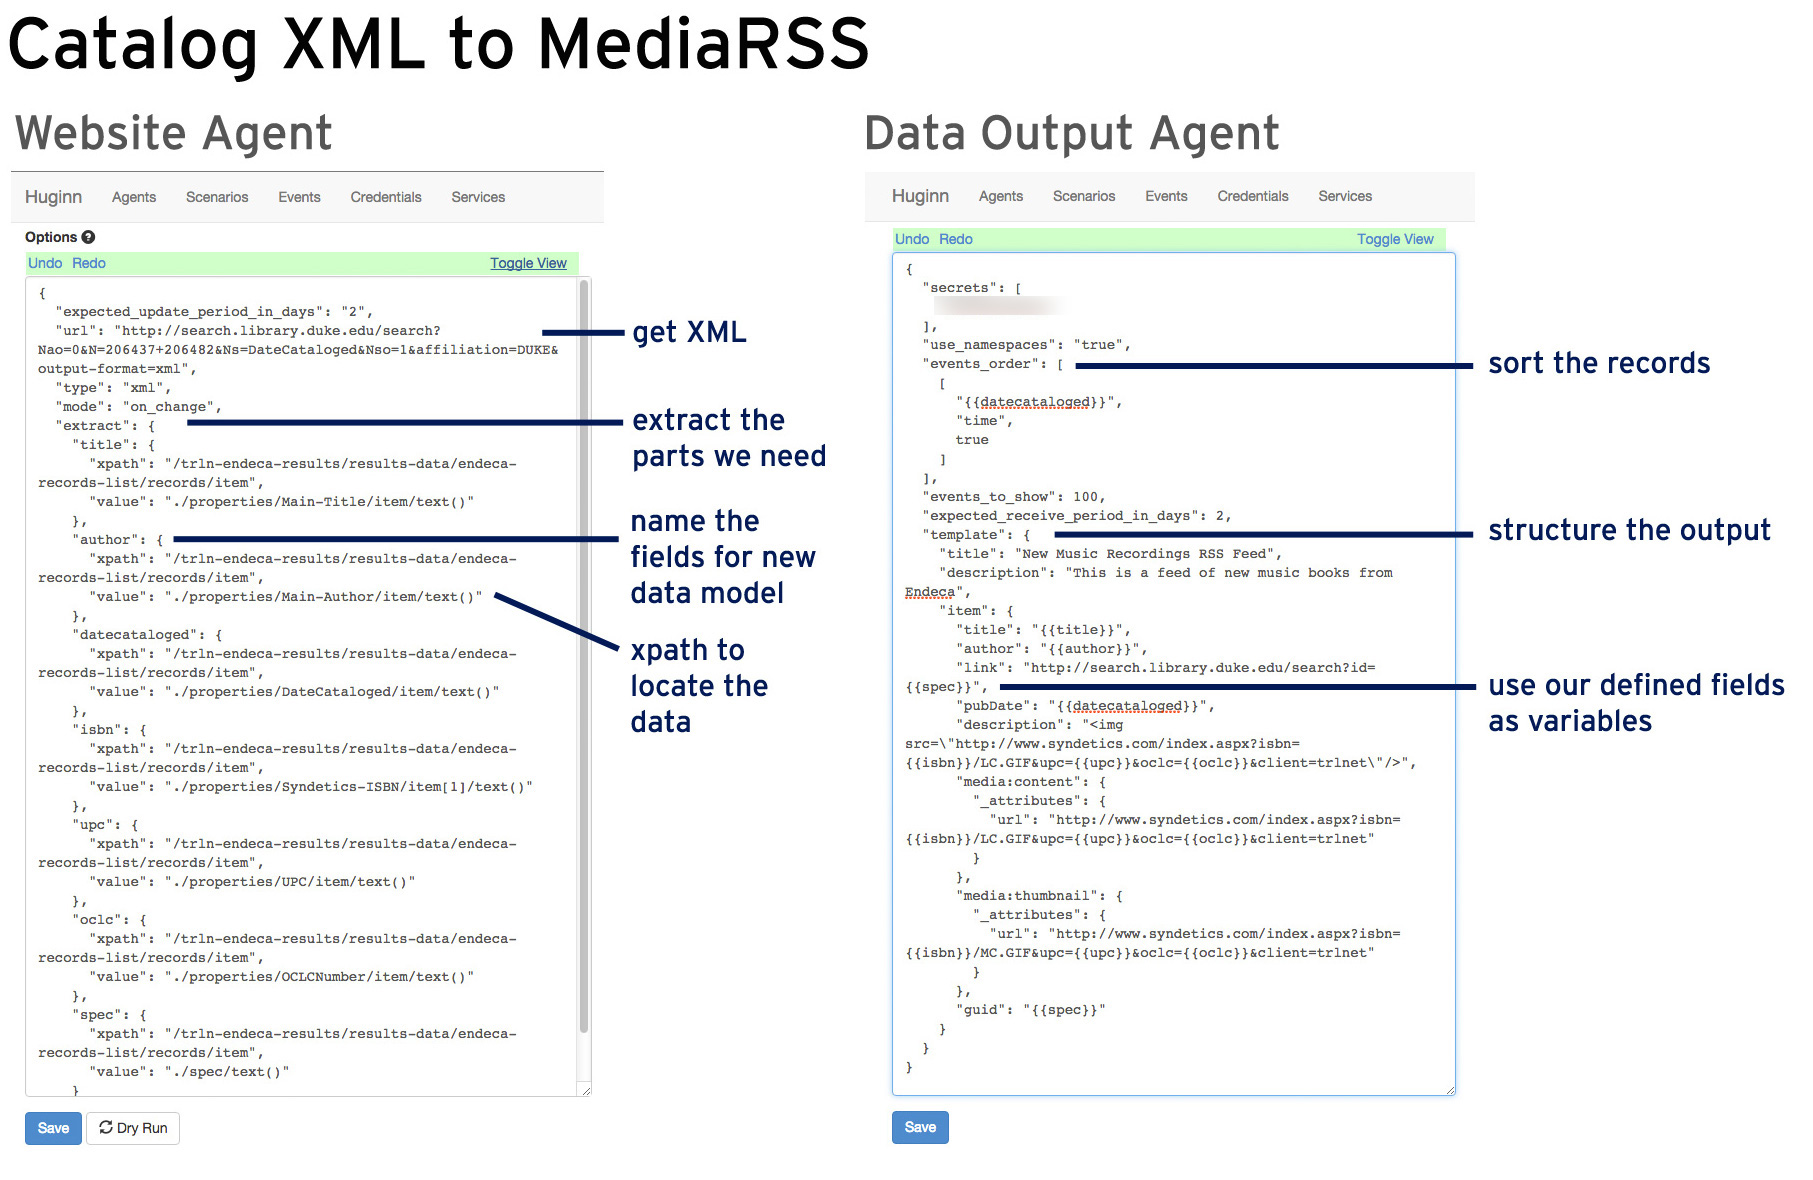
To recreate each feed we’d built in Pipes, we had to build two kinds of Huginn Agents: one or more “Website Agents” to gather and extract the data we need, then a “Data Output Agent” to publish a new customized feed. Agents are set up by writing some configuration rules structured as JSON.
Huginn description: “The Website Agent scrapes a website, XML document, or JSON feed and creates Events based on the results.”
With a Website Agent, we’re gathering data from a source (for us, typically RSS or raw XML). We specify a URL, then start structuring what elements we want to extract using XPath expressions.
Data Output Agent
Huginn description: The Data Output Agent outputs received events as either RSS or JSON. Use it to output a public or private stream of Huginn data.
The Data Output Agent uses one or more Website Agents as data sources. We configure some rules about what to expose and can further refine the data in the output using Liquid Templating. In the case of New Additions to the catalog, it’s here where we make a <media:content> element in our feed and assemble a URL to a cover image from bits of data extracted from the raw XML.
Examples
Huginn Agents for converting catalog data to a media-rich RSS feed for New Additions widgets.
Huginn Data Output Agent to publish a single RSS feed from several contributing feeds.
Looking Ahead
So far, so good. Huginn is now successfully powering most of the feeds that we had previously managed through Yahoo! Pipes. We look forward to seeing what kinds of features are added by the developer community.
Shoutouts to Cory Lown & Michael Daul for all their work in helping make the transition from Pipes to Huginn.
Rachel Ingold (Curator for the History of Medicine Collections at the Rubenstein Library) and I co-presented yesterday at the TRLN Annual Conference 2015 in Chapel Hill, NC:
Sean Aery, Digital Projects Developer, Duke Rachel Ingold, Curator for the History of Medicine Collections, Duke
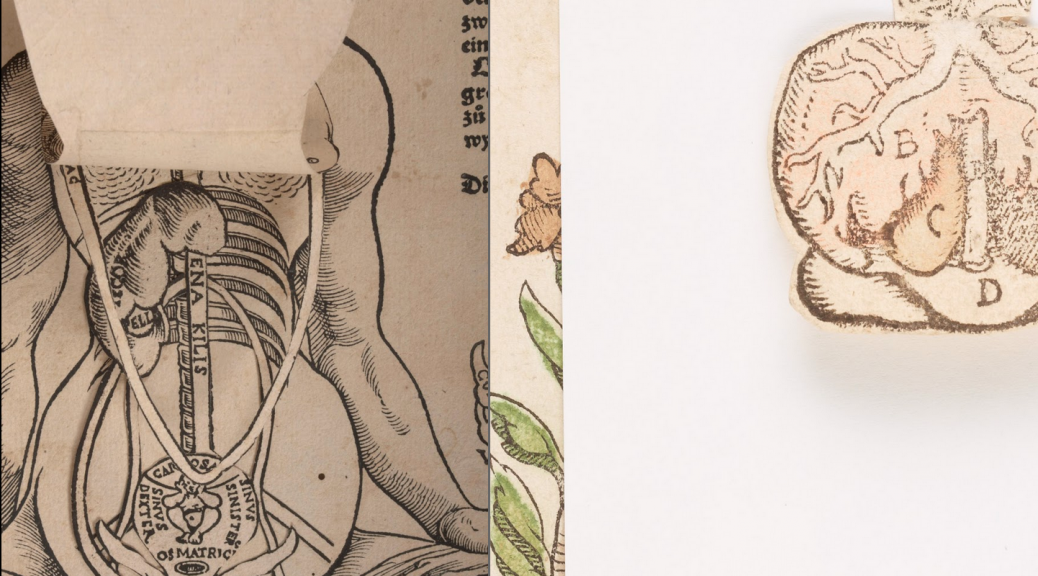
Duke’s Digital Collections program recently published a remarkable set of 16th-17th century anatomical fugitive sheets from The Rubenstein Library’s History of Medicine Collections. These illustrated sheets are similar to broadsides, but feature several layers of delicate flaps that lift to show inside the human body. The presenters will discuss the unique challenges posed by the source material including conservation, digitization, description, data modeling, and UI design. They will also demonstrate the resulting digital collection, which has already earned several accolades for its innovative yet elegant solutions for a project with a high degree of complexity.
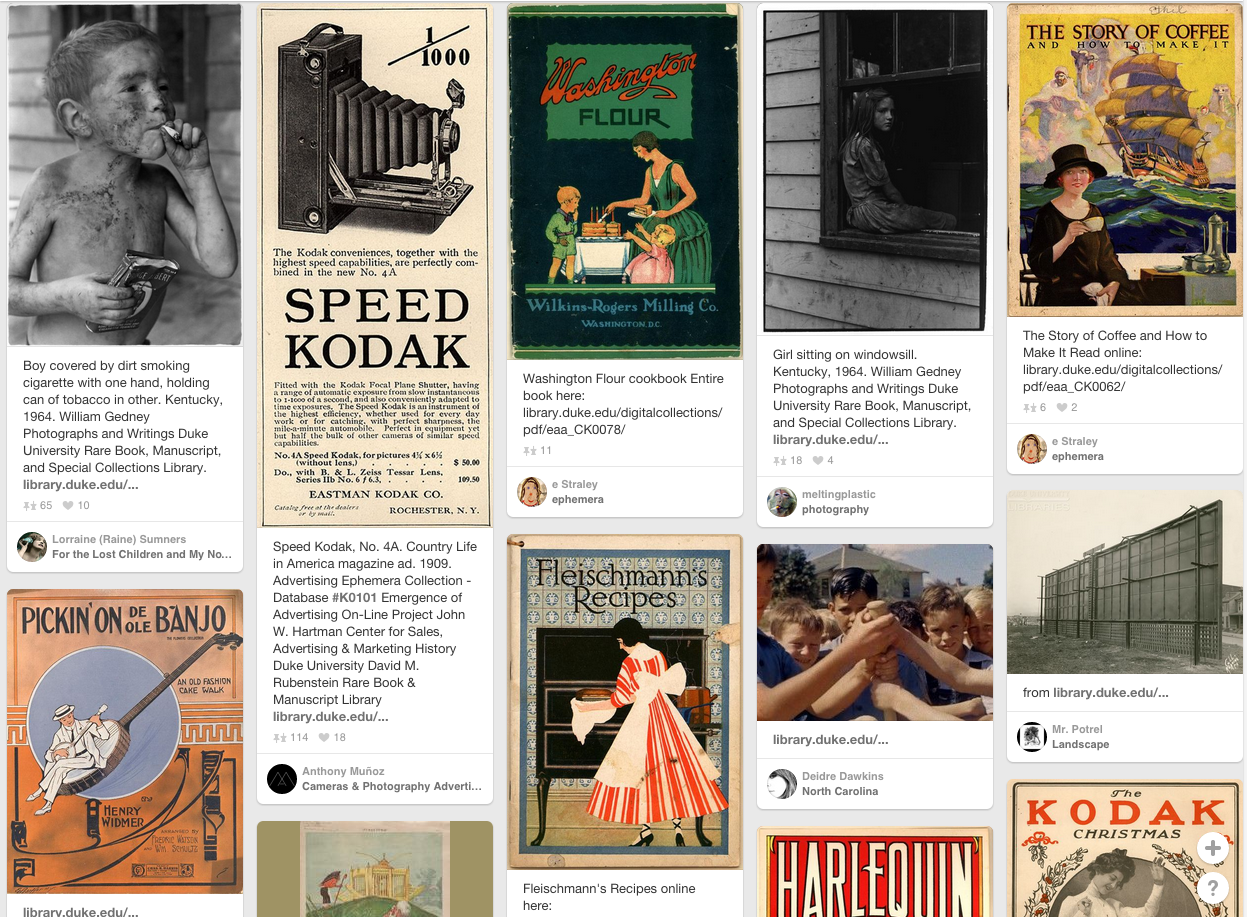
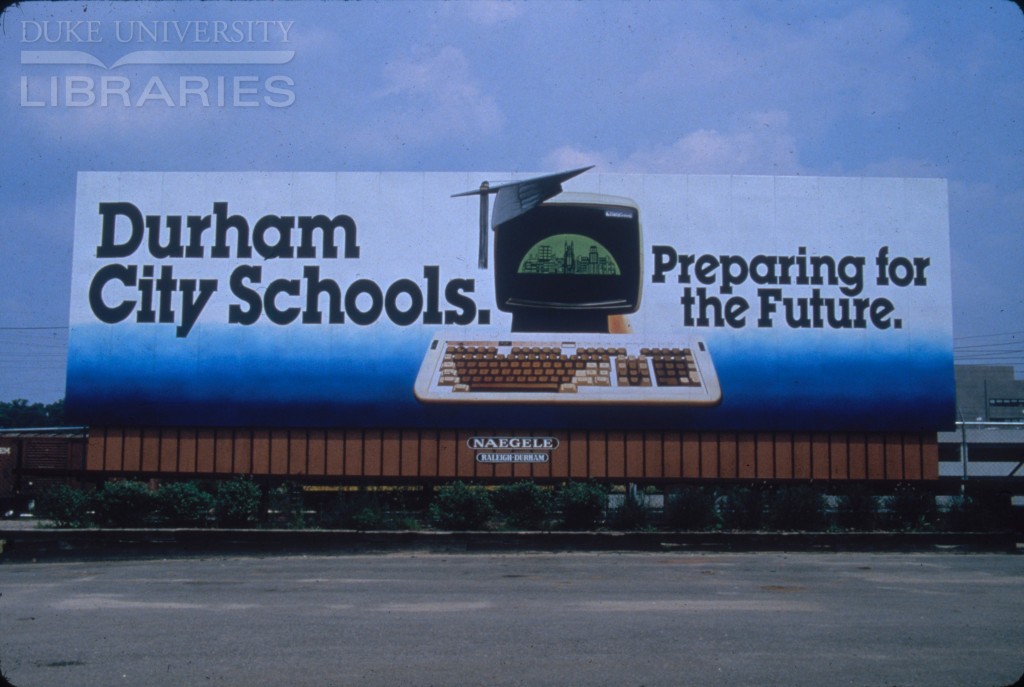
Our Digital Collections program aspires to build “distinctive digital collections that provide access to Duke’s unique library and archival materials for teaching, learning, and research at Duke and worldwide.” Those are our primary stated objectives, though the reach and the value of putting collections online extends far beyond. For instance, these uses might not qualify as scholarly, but we celebrate them all the same:
Regardless of how much value we assign to different kinds of uses, determining the impact of our work is a hard problem to solve. There are no simple instruments to measure our outcomes, and the measurements we do take can at times feel uncertain, as if taken of a moving object with a wildly elastic ruler. Some helpful resources are out there, of both theoretical and practical varieties, but focusing on what matters most remains a challenge.
Back to our mission: how much are our collections actually used for the scholarly purposes we trumpet–teaching, learning, and research–versus other more casual uses? How do we distinguish these uses within the data we collect? Getting clearer answers could help us in several areas. First, what should we even digitize? What compelling stories of user engagement could be told to illustrate the value of the collections? How might we drum up more interest in the collections within scholarly communities?
Some of my Duke colleagues and I began exploring these questions this year in depth. We’ll have much more to report later, but already our work has uncovered some bits of interest to share. And, of course, we’ve unearthed more questions than answers.
Analytics
Like many places, we use a service called Google Analytics to track how much our collections are accessed. We use analytics to understand what kinds of things that we digitize resonate with users online, and to to help us make informed improvements to the website. Google doesn’t track any personally identifiable data (thankfully); data is aggregated to a degree where privacy is protected yet site owners can still see generally where their traffic comes from.
For example, we know that on average1, our site visitors view just over 5 pages/visit, and stay for about 3.5 minutes. 60.3% of visitors bounce (that is, leave after seeing only one page). Mobile devices account for 20.1% of traffic. Over 26% of visits come from outside the U.S. The most common way a visit originates is via search engine (37.5%), and social media traffic—especially from Facebook—is quite significant (15.7% of visits). The data is vast; the opportunities for slicing and dicing it seem infinite. And we’ll forever grapple with how best to track, interpret, report, and respond to the things that are most meaningful to us.
Scholarly Traffic
There are two bits of Analytics data that can provide us with clues about our collections’ use in scholarly environments:
Traffic on scholarly networks (a filtered view of ISPs)
Referrals from scholarly pages (a filtered view of Referrer paths)
Tracking these figures (however imperfect) could help us get a better sense for the trends in the tenor of our audience, and help us set goals for any outreach efforts we undertake.
Traffic on Scholarly Networks
One key clue for scholarly use is the name of visitors’ Internet Service Provider (ISP). For example, a visit from somewhere on Duke’s campus has an ISP “duke university,” a NYC public school “new york city public schools,” and McGill University (in Canada) “mcgill university.” Of course, plenty of scholarly work gets done off-campus (where an ISP is likely Time Warner, Verizon, AT&T, etc.), and not all network traffic that happens on a campus is actually for scholarly purposes. So there are the usual caveats about signal and noise within the data.
Alas, we know that over the past calendar year1, we had:
11.7% of our visits (“sessions”) from visitors on a scholarly network (as defined in our filters by: ISP name has universit*, college*, or school* in it)2.
74,724 visits via scholarly networks
4,121 unique scholarly network ISPs
Referrals from Course Websites or Online Syllabi on .Edu Sites
Are our collections used for teaching and learning? How much can we tell simply through web analytics?
A referral happens when someone gets to our site by following a link from another site. In our data, we can see the full web address of any referring pages. But can we infer from a site URL whether a site was a course website or an online syllabus–pages that’d link to our site for the express purpose of teaching? We can try.
In the past year, referrals filtered by an expression3 to isolate course sites and syllabi on .Edu sites
It’s hard to confidently assert that this data is accurate, and indeed many of the pages can’t be verified because they’re only accessible to the students in those classes. But regardless, a look at the data through this lens does occasionally help discover real uses for actual courses and/or generate leads for contacting instructors about the ways they’ve used the collections in their curriculum.
Other Methods
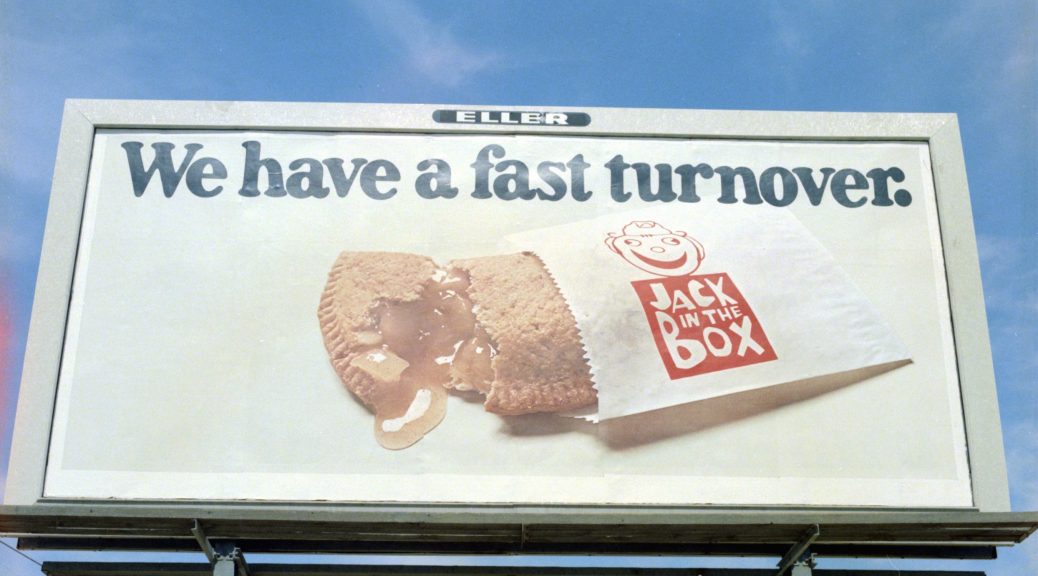
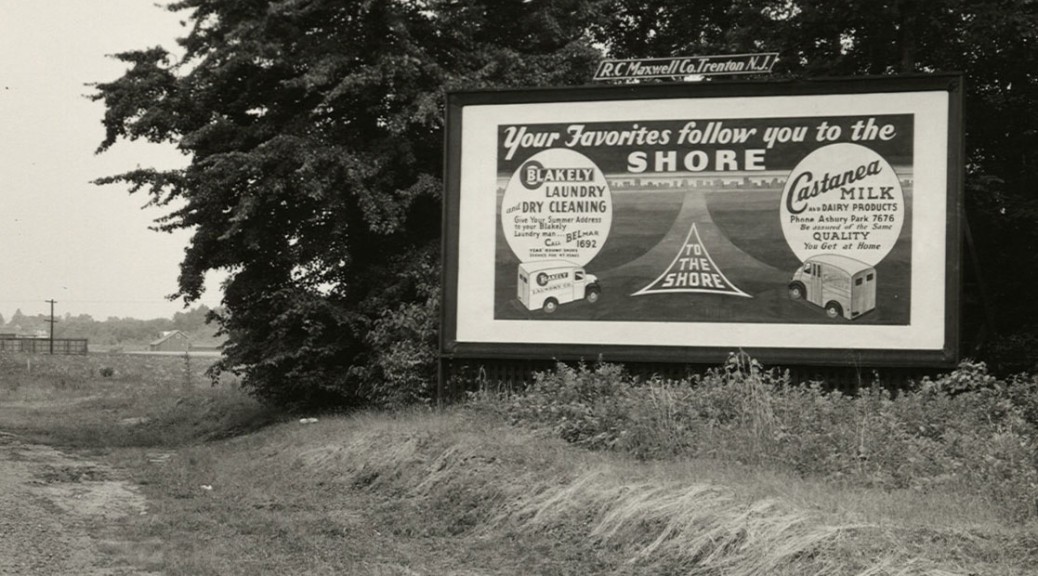
We know web analytics are just a single tool in a giant toolbox for determining how much our collections are contributing to teaching, learning, and research. One technique we’ve tried is using Google Scholar to track citations of collections, then logged and tagged those citations using Delicious. For instance, here are 70 scholarly citations for our Ad*Access collection. Among the citations are 30 articles, 19 books, and 10 theses. 26 sources cited something from the collection as a primary source. This technique is powerful and illuminates some interesting uses. But it unfortunately takes a lot of time to do well.
We’ve also recently launched a survey on our website that gathers some basic information from visitors about how they’re using the collections. And we have done some outreach with instructors at Duke and beyond. Stay tuned for much more as we explore the data. In the meantime, we would love to hear from others in the field how you approach answering these very same questions.
Notes
Data from July 1, 2014 – June 26, 2015.
We had first looked at isolating scholarly networks by narrowing to ISP network domains ending in “.edu” but upon digging further, there are two reasons why the ISP name provides better data. 1) .EDUs are only granted to accredited postsecondary institutions in the U.S., so visits from international universities or middle/high schools wouldn’t count. 2) A full 24% of all our visits have unknowable ISP network domains: “(not set)” or “unknown.unknown,” whereas only 6.3% of visits have unknown ISP names.
Full referrer path: blackboard|sakai|moodle|webct|schoology|^bb|learn|course|isites|syllabus|classroom|^class.|/class/|^classes.|/~CLASS/
We have digitized some fairly complex objects over the years that have challenged our Digital Collections team to push the boundaries of typical digital library solutions for digitization and publication. It happens often: objects we want to digitize are sort of like something we’ve done for a previous project, but not quite, so we can’t simply mimic whatever we did before to get the new project done. We’re frequently flexing our creative muscles. In many cases, our most successful projects ended up that way because we didn’t concede to the temptation of representing items digitally in an oversimplified manner, or, worse still, as something they are not.
Working with so many rare and unique items from the Rubenstein Library through the years, we’ve become unfazed by these representation challenges and time and again have simply pulled together our team’s brainpower (and willpower) to make something work. Dare I say it, we’ve been unflappable. But this year, we met our match and surely needed some help.
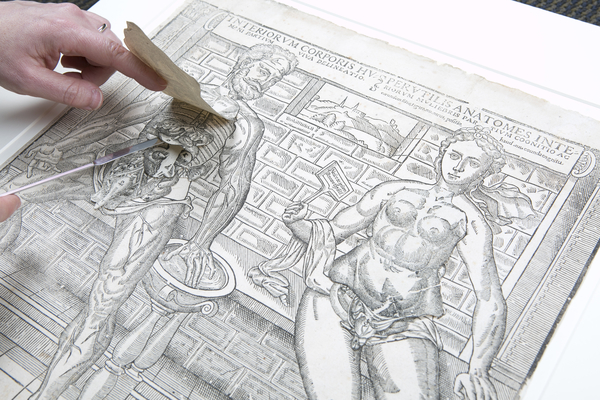
In March, we published ten anatomical fugitive sheets from the 1500s to 1600s. They’re printed illustrations from the Rubenstein Library’s History of Medicine Collections, depicting the human body using layers of paper flaps that can be lifted to reveal internal organs. They’re amazing. They’re distinctive. And they’re really complicated.
The complexity of this project necessitated enlisting help from beyond the library’s walls. Early on, Prof. Mark Olson in Duke’s Art, Art History & Visual Studies department was instrumental in helping us identify modern technical approaches for capturing and modeling such objects. We contracted out development work through local web firm Cuberis, who programmed the bulk of the UI. In-house, we handled digitization, metadata, and integration with our discovery & access application with a lot of collaborative creativity between the digital collections team, the collection curator, conservators, and rare materials cataloger.
In a moment, I’ll discuss what modern technologies make the Fugitive Sheets interface hum. But first, here’s a look at what others have done with flap-based items.
Flaps in the Wind, Er… Wild
There are a few examples of anatomical flap objects represented on the Web, both at Duke and beyond. Common approaches include:
A Sequence of Images. Capture one image of the full item for every state of the flaps possible, then let a user navigate them as if viewing a paginated document or photo sequence.
The third approach is actually what powers Duke’s Four Seasons project, which remains one of the best interactive historical anatomy interfaces available today. Developed way back in 2000 by Educational Media Services, Four Seasons began as a Java program distributed on CD-ROM (gasp!) and in subsequent years found a home as a Flash application embedded on the library website.
Flash has fallen out of favor over the last decade for many reasons, most notably: 1) it won’t work on iOS devices, 2) it’s bad for accessibility, 3) it’s invisible to search engines, and most importantly, 4) most of what Flash used to do exclusively can now be done just as well using HTML5.
Anatomy of a Modern Flap Interface
The Web has made giant leaps forward in the past five years due to advances in HTML, CSS, and Javascript and the evolution of web browsers. Key specs for HTML5 and CSS3 have been supported by all major browsers for several years now. Below are the vital bits (so to speak) in use by the Anatomical Fugitive Sheets. Many of these things would not have worked (or worked well) on the Web five years ago.
HTML5 Parts
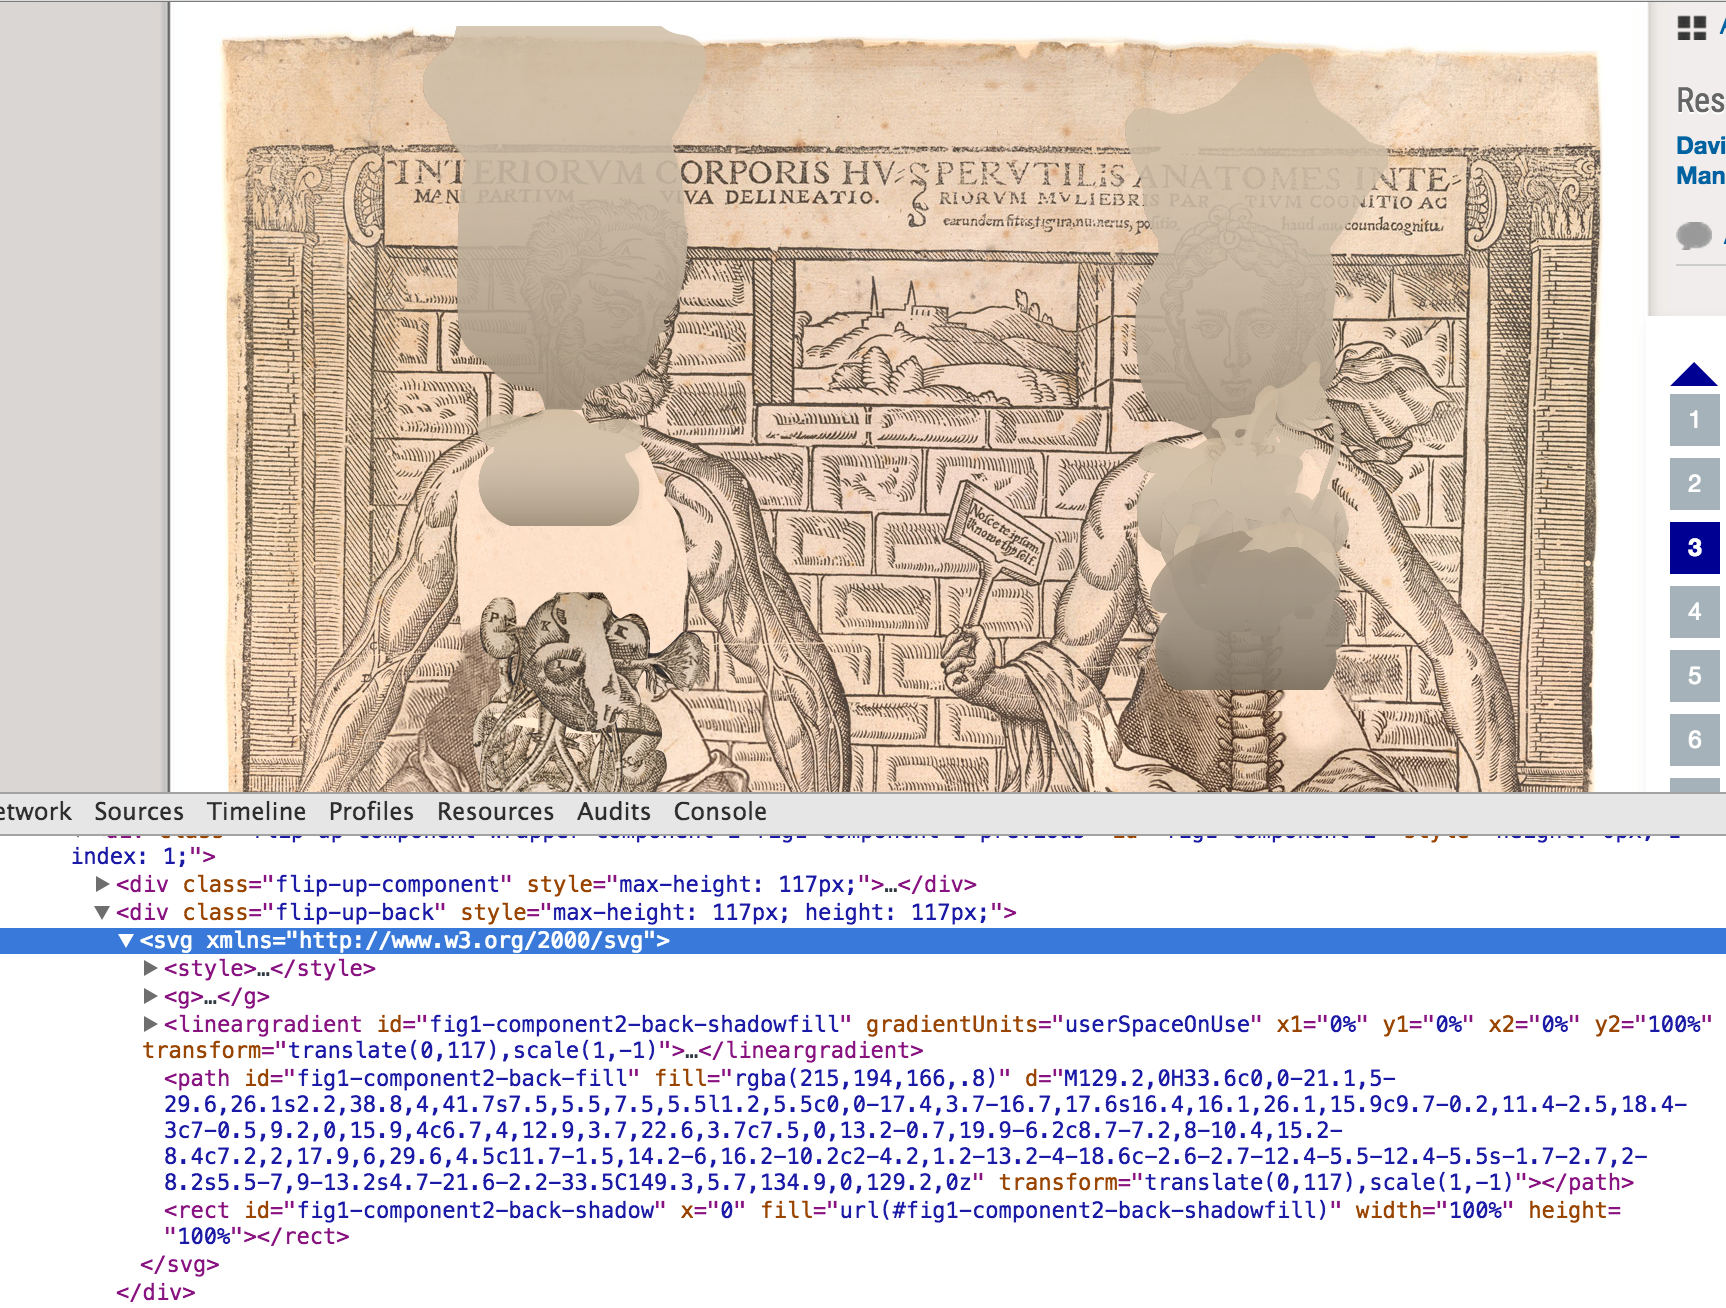
1. SVG (scalable vector graphics). An <svg> element in HTML contains shape data for each flap using a coordinates system. The <path> holds a string with line instructions using shorthand (M, L, c, etc.) for tracing the contour: MoveTo, Lineto, Curveto, Arcto. We duplicate the <path> with a transform attribute to render the shape of the back of the flap.
SVG coordinates in a <path> element representing the back of a flap.
2. Cross-window messaging API. Each fugitive sheet is rendered within an <iframe> on a page and the clickable layer navigation lives in its parent page, so they’re essentially two separate web pages presented as if one. Having a click in one page do something in another is possible through the Javascript method postMessage, part of the HTML5 spec.
From parent page to iframe:frame.contentWindow.postMessage(message, '*');
From iframe to parent page:window.top.postMessage(message, '*');
CSS3 Parts
transition Property. Here’s where the flap animation action happens. The flap elements all have the style declaration transition:1s ease-in-out. That ensures that when a flap property like height changes, it animates over the course of one second, slower at the start and end and quicker in the middle. Clicking to open a flap calls a Javascript function that simultaneously switches the height of the flap front to zero and the back to its full size.
transform Property. This scales down the figure and all its interactive components for display in the iframe, e.g., body.framed .flip-up-wrapper { transform:scale(.5) }; This scaling doesn’t apply in the full-size and zoomed-in views and thus enables the flaps to work identically at full- or half-resolution.
Capture & Encoding
Capture
Because the fugitive sheets are large and extremely fragile, our Digital Production Center staff and conservators worked carefully together to untangle and prop open each flap to be photographed separately. It often required two or more people to steady and flatten the flaps while being careful not to cast shadows on the layer being shot. I wasn’t there, but in my mind I imagine a game of library Twister.
Staff captured images using an overhead reproduction camera using white paper below each flap to make it easier to later determine and crop the contours. Unlike most images we digitize, the flaps’ derivative images are stored and delivered in PNG format to preserve transparency.
Encoding
As we do for all digital collections, we encode in an XML document the structural, administrative, and descriptive data about the digital objects using accepted library standards so that 1) the data can be preserved and ported between applications, and 2) we can use it to power our discovery & access interface. We use METS, a flexible Library of Congress standard for describing all kinds of digital objects.
METS worked pretty well for representing the flap data (see example), and we tapped into a few parts of the standard that we’ve never or rarely used for other items. Specifically, we:
added the LC MIX namespace for technical image metadata
used an amdSec to store flap heights & widths
used file/@GROUPID to divide flap images between figure 1, figure 2, etc.
used fptr/area/@COORDS to hold the SVG path coordinates for each flap
The descriptive metadata for the fugitive sheets posed its own challenges outside the box for our usual projects. All the information about the sheets existed as MARC catalog records, and crosswalking from MARC to anything else is more of an art than a science.
Looking Ahead
We’ll try to build on the accomplishments from the Fugitive Sheets Collection as we tackle new complex digitization projects. The History of Medicine Collections in particular are brimming with items that will be far more challenging than these sheets to model, like paginated flap books with fold-out pages and flaps that open in different directions. Undaunted, we’ll keep flapping our wings to stay aloft.
Notes from the Duke University Libraries Digital Projects Team


![The sun. (New York [N.Y.]), 21 July 1871. Chronicling America: Historic American Newspapers. Lib. of Congress.](https://blogs.library.duke.edu/bitstreams/files/2015/11/ny-sun-chronicling-america-1024x330.jpg)