Interested in attending the 2020 RStudio Conference, but unable to travel to San Francisco? With the generous support of RStudio and the Department of Statistical Science, Duke Libraries will host a livestream of the annual RStudio conference starting on Wednesday, January 29th at 11AM. See the latest in machine learning, data science, data visualization, and R. Registration links and information about sessions follow. Registration is required for the first session and keynote presentations. Please see the links in the agenda that follows.
Education Track (registration is not required) Meet you where you R – Lauren Chadwick, R Studio.
Data Science Education in 2022 (Karl Howe and Greg Wilson, R Studio)
Data science education as an economic and public health intervention in East Baltimore (Jeff Leek, Johns Hopkins)
Of Teacups, Giraffes, & R Markdown (Desiree Deleon, Emory)
Location: Edge Workshop Room – Bostock 127
5:15 – 6:45
All About Shiny (registration is not required)
Production-grade Shiny Apps with golem (Colin Fay, ThinkR)
Making the Shiny Contest (Duke’s own Mine Cetinkaya-Rundel)
Styling Shiny Apps with Sass and Bootstrap 4(Joe Cheng, RStudio)
Reproducible Shiny Apps with shinymeta (Carson Stewart, RStudio)
7:00 – 8:30
Learning and Using R (registration is not required)
Learning and using R: Flipbooks (Evangeline Reynolds, U Denver)
Learning R with Humorous Side Projects (Ryan Timpe, Lego Group)
Toward a grammar of psychological Experiments (Danielle, Navaro, University of New South Wales)
R for Graphical Clinical Trial Reporting(Frank Harrell, Vanderbilt)
Data Visualization Track (registration is not required) The Glamour of Graphics (William Chase, University of Pennsylvania)
3D ggplots with rayshader (Dr. Tyler Morgan-Wall, Institute for Defense Analyses)
Designing Effective Visualizations (Miriah Meyer, University of Utah)
Tidyverse 2019-2020 (Hadley Wickham, RStudio)
3:00 – 4:00
Livestream of Rstudio Conference Sessions (registration is not required)
4:00 – 5:30
Data Visualization Track 2 (registration is not required)
Spruce up your ggplot2 visualizations with formatted text (Claus Wilke, UT Austin)
The little package that could: taking visualizations to the next level with the scales package (Dana Seidel, Plenty Unlimited)
Extending your ability to extend ggplot2 (Thomas Lin Pedersen, RStudio)
5:45 – 6:30
Career Advice for Data Scientists Panel Discussion (registration is not required)
Felipe Álvarez de Toledo López-Herrera is a Ph.D. candidate at the Art, Art History, and Visual Studies Department at Duke University and a Digital Humanities Graduate Assistant for Humanities Unbounded, 2019-2020. Contact him at askdata@duke.edu.
Over the 2019-2020 academic year, I am serving as a Humanities Unbounded graduate assistant in Duke Libraries’ Center for Data and Visualization Sciences. As one of the three Humanities Unbounded graduate assistants, I will partner on Humanities Unbounded projects and focus on developing skills that are broadly applicable to support humanities projects at Duke. In this blog post, I would like to introduce myself and give readers a sense of my skills and interests. If you think my profile could address some of the needs of your group, please reach out to me through the email above!
My own dissertation project began with a data dilemma. 400 years ago, paintings were shipped across the Atlantic by the thousands. They were sent by painters and dealers in places like Antwerp or Seville, for sale in the Spanish colonies. But most of these paintings were not made to last. Cheap supports and shifting fashions guaranteed a constant renewal of demand, and thus more work for painters, in a sort of proto-industrial planned obsolescence.[1]As a consequence, the canvas, the traditional data point of art history, was not a viable starting point for my own research, rendering powerless many of the tools that art history has developed for studying painting. I was interested in examining the market for paintings as it developed in Seville, Spain from 1500-1700; it was a major productive center which held the idiosyncratic role of controlling all trade to the Spanish colonies for more than 200 years. But what could I do when most of the work produced within it no longer exists?
This problem drives my research here at Duke, where I apply an interdisciplinary, data-driven approach. My own background is the product of two fields: I obtained a bachelor’s degree in Economics in my hometown of Barcelona, Spain in 2015 from the Universitat Pompeu Fabra, and simultaneously attended art history classes in the University of Barcelona. This combination found a natural mid-way point in the study of art markets. I came to Duke to be a part of DALMI, the Duke, Art, Law and Markets Initiative, led by Professor Hans J. Van Miegroet, where I was introduced to the methodologies of data-driven art historical research.
Documents in Seville’s archives reveal a stunning diversity of production that encompasses the religious art for which the city is known, but also includes still lives, landscapes and genre scenes whose importance has been understated and of which few examples remain [Figures 1 & 2]. But analysis of individual documents, or small groups of them, yields limited information. Aggregation, with an awareness of the biases and limitations in the existing corpus of documents, seems to me a way to open up alternative avenues for research. I am creating a database of painters in the city of Seville from 1500-1699, where I pool known archival documentation relating to painters and painting in this city and extract biographical, spatial and productive data to analyze the industry. I explore issues such as the industry’s size and productive capacity, its organization within the city, reactions to historical change and, of course, its participation in transatlantic trade.
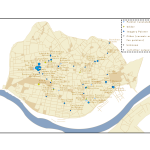
This approach has obliged me to become familiar with a wide range of digital tools. I use OpenRefine for cleaning data, R and Stata for statistical analysis, Tableau for creating visualizations and ArcGIS for visualizing and generating spatial data (see examples of my own work below [Figures 3-4]). I have also learned the theory behind relational databases and am learning to use MySQL for my own project; similarly, for the data-gathering process I am interested in learning data-mining techniques through machine learning. I have been using a user-friendly software called RapidMiner to simplify some of my own data gathering.
A rare example of a Sevillian landscape. Ignacio de Iriarte, Landscape with Shepherds (1665)
Another example of Sevillian genre production. Francisco de Zurbarán, Still Life with Lemons, Oranges and a Rose (1633)
Map of painter addresses, 1676. Size represents the number of apprentices they held in that year.
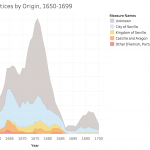
Number of apprentices in Seville by place of origin, 1650-1699. Based on documents in Duncan T. Kinkead, Pintores y Doradores en Sevilla, 1650-1699: Documentos (2007).
Thus, I am happy to help any groups that have a data set and want to learn how to visualize it graphically, whether through graphs, charts or maps. I am also happy to help groups think about their data gathering and storage. I like to consider data in the broadest terms: almost anything can be data, if we correctly conceptualize how to gather and utilize it realistically within the limits of a project. I would like to point out that this does not necessarily need to result in visualization; this is also applicable if a group has a corpus of documents that they want to store digitally. If any groups have an interest in text mining and relational databases, we can learn simultaneously—I am very interested in developing these skills myself because they apply to my own project.
I can:
Help you consider potential data sources and the best way to extract the information they contain
Help you make them usable: teach you to structure, store and clean your data
And of course, help you analyze and visualize them
With Tableau: for graphs and infographics that can be interactive and can easily be embedded into dashboards on websites.
With ArcGIS: for maps that can also be interactive and embedded onto websites or in their Stories function.
Help you plan your project through these steps, from gathering to visualization.
Once again, if you think any of these areas are useful to you and your project, please do not hesitate to contact me. I look forward to collaborating with you!
An R workshop series by the Center for Data and Visualization Sciences.
You are invited to stop by the Edge Workshop Room on Mondays for a new Rfun program, the R Open Labs, 6-7pm, Sept. 16 through Oct. 28. No need to register although you are encouraged to double-check the R Open Labs schedule/hours. Bring your laptop!
This is your chance to polish R skills in a comfortable and supportive setting. If you’re a bit more advanced, come and help by demonstrating the supportive learning community that R is known for.
No Prerequisites, but please bring your laptop with R/RStudio installed. No skill level expected. Beginners, intermediate, and advanced are all welcome. One of the great characteristics of the R community is the supportive culture. While we hope you have attended our Intro to R workshop (or watched the video, or equivalent). This is an opportunity to learn more about R and to demystify some part of R that your find confusing.
FAQ
What are Open Labs
Open labs are semi-structured workshops designed to help you learn R. Each week brief instruction will be provided, followed by time to practice, work together, ask questions and get help. Participants can join the lab any time during the session, and are welcome to work on unrelated projects.
The Open Labs model was established by our colleagues at Columbia and adopted by UNC Chapel Hill. We’re giving this a try as well. Come help us define our direction and structure. Our goal is to connect researchers and foster a community for R users on campus.
How do I Get Started?
Attend an R Open Lab. Labs occur on Mondays, 6pm-7pm in the Edge Workshop Room in the Bostock Library. In our first meeting we will decide, as a group, which resource will guide us. We will pick one of the following resources…
R for Data Science by Hadley Wickham & Garrett Grolemund (select chapters, workbook problems, and solutions)
Please bring a laptop with R and R Studio installed. If you have problems installing the software, we can assist you with installation as time allows. Since we’re just beginning with R Open Labs, we think there will be time for one-on-one attention as well through learning and community building.
How to install R and R Studio
If you are getting started with R and haven’t already installed anything, consider using using these installation instructions. Or simply skip the installation and use one of these free cloud environments:
We’ll start at the beginning, however, R Open Labs recommends that you attend our Intro to R workshop or watch the recorded video. Being a beginner makes you part of our target audience so come ready to learn and ask questions. We also suggest working through materials from our other workshops, or any of the resource materials listed in the Attend an R Open Lab section (above). But don’t let lack of experience stop you from attending. The resources mentioned above will be the target of our learning and exploration.
Visualize, manage, and map your data in our Fall 2017 Workshop Series. Our workshops are designed for researchers who are new to data driven research as well as those looking to expand skills with new methods and tools. With workshops exploring data visualization, digital mapping, data management, R, and Stata, the series offers a wide range of different data tools and techniques. This fall, we are extending our partnership with the Graduate School and offering several workshops in our data management series for RCR credit (please see course descriptions for further details).
Everyone is welcome at Duke Libraries workshops. We hope to see you this fall!
Interested in getting started in data driven research or exploring a new approach to working with research data? Data and Visualization Services’ spring workshop series features a range of courses designed to showcase the latest data tools and methods. Begin working with data in our Basic Data Cleaning/Analysis or the new Structuring Humanities Data workshop. Explore data visualization in the Making Data Visual class. Our wide range of workshops offers a variety of approaches for the meeting the challenges of 21st century data driven research. Please join us!
Data and Visualization Services is happy to announce its Fall 2015 Workshop Series. With a range of workshops covering basic data skills to data visualization, we have a wide range of courses for different interests and skill levels.. New (and redesigned) workshops include:
OpenRefine: Data Mining and Transformations, Text Normalization
Historical GIS
Advanced Excel for Data Projects
Analysis with R
Webscraping and Gathering Data from Websites
Workshop descriptions and registration information are available at:
As we begin our summer in Data and GIS Services, we spend this post reflecting back on some of the services, software, and tools that made data work this spring more productive and more visible. We proudly present our top 10 list for the Spring 2014 semster:
10. DMPTool While we enjoy working directly with researchers crafting data management plans, we realize that some data management needs arise outside of consultation hours. Fortunately, the Data Management Planning Tool (DMPTool) is there 24/7 to provide targeted guidance on data management plans for a range of granting agencies.
9. Fusion Tables A database in the cloud that allows you to query and visualize your data, Fusion Tables has proven a powerful tool for researchers who need database functionality but don’t have time for a full featured database. We’ve worked with many groups to map their data in the cloud; see the Digital Projects blog for an example. Fusion Tables is a regular workshop in Data and GIS.
8. Open Refine You could learn the UNIX command line and a scripting language to clean your data, but Open Refine opens data cleaning to a wider audience that is more concerned with simplicity than syntax. Open Refine is also a regular workshop in Data and GIS.
7. R and RStudio A programming language that excels at statistics and data visualization, R offers a powerful, open source solution to running statistics and visualizing complex data. RStudio provides a clean, full-featured development environment for R that greatly enhances the analysis process.
6. Tableau Public Need a quick, interactive data visualization that you can share with a wide audience? Tableau Public excels at producing dynamic data visualizations from a range of different datasets and provides intuitive controls for letting your audience explore the data.
5. ArcOnline ArcGIS has long been a core piece of software for researchers working with digital maps. ArcOnline extends the rich mapping features of ArcGIS into the cloud, allowing a wider audience to share and build mapping projects.
4. Pandas A Python library that brings data analysis and modeling to the Python scripting language, Pandas brings the ease and power of Python to a range of data management and analysis challenges.
3. RAW Paste in your spreadsheet data, choose a layout, drag and drop your variables… and your visualization is ready. Raw makes it easy to go from data to visualization using an intuitive, minimal interface.
2. Stata 13 Another core piece of software in the Data and GIS Lab (and at Duke), Stata 13 brought new features and flexibility (automatic memory management — “hello big data”) that were greatly appreciated by Duke researchers.
1. R Markdown While many librarians tell people to “document your work,” R Markdown makes it easy to document your research data, explain results, and embed your data visualizations using a minimal markup language that works in any text editor and ties nicely into the R programming language. For pulling it all together, R Markdown is number one in our top ten list!
We hope you’ve enjoyed the list! If you are interested in these or other data tools and techniques, please contact us at askdata@duke.edu!
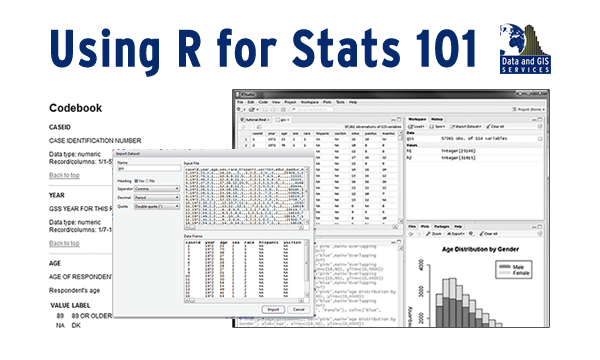
How do you support 57,860 online students learning R and statistics ? Late last fall, Data and GIS Services shared this challenge with Professor Mine Çetinkaya-Rundel and the staff of CIT as we sought to translate Professor Çetinkaya-Rundel’s successful Statistics 101 course to a Coursera class on Data Analysis and Statistical Inference. While Data and GIS Services has supported Statistics 101 students for several years identifying appropriate data and using the R statistical language for their assignments, the scale of the Coursera course introduced new challenges of trying to provide engaging data to a very large audience without having the opportunity to provide direct support to everyone in the class.
In our initial meetings with Professor Çetinkaya-Rundel, she requested that Data and GIS create data collections for the course that would provide easy access in R and would include a range of statistical measures that would appeal to the diverse audience in the class. The first challenge — easy access to R — required some translation work. While R excels in its flexibility, graphics, and statistical power, it lacks some of the built in data documentation features present in other statistical packages. This project prompted Data and GIS to reconsider how to provide documentation and pre-formatted R data to an audience that would likely be unfamiliar with R and data documentation.
The second challenge — finding data that covered a wide range of interesting topics — proved much easier. The General Social Survey with its diverse and engaging questions on a wide range of topics proved to be an easy choice for the class. The American National Election Studies, also offered a diverse set of measures of public opinion that suited the course well. With these challenges identified and addressed, we spent the end of 2013 selecting portions of the data for class (subsetting), abridging the data documentation for instructional use, and transforming the data to address its usage in an online setting (processing missing values for R, creating factor variables).
As Professor Çetinkaya-Rundel’s class launches on February 17th, this project has given us a new appreciation of providing data and statistical services in a MOOC while also building course materials that we are using in Statistics 101 at Duke. While students begin the Coursera course on Data Analysis and Statistical Inference, students in Professor Kari Lock Morgan’s Statistics 101 class will use these data in their on-campus Duke course as well. We hope that both collections will reduce some of the technological hurdles that often confront courses using R as well as improving statistical literacy at Duke and beyond.
Analyze, discover, manage, map, and visualize your data with Duke Libraries Data and GIS Services. Our team of five consultants provides a broad range of support in areas ranging from data analysis, data visualization, geographic information systems, financial data, statistical software and data storage and management. Our lab provides 12 workstations with the latest data software and three Bloomberg Professional workstations nearly 24/7 for the Duke community.
Data and GIS Workshop Series
All are welcome to the Data and GIS Workshop Series. Analyze, communicate, clean, map, represent and visualize your data with a wide range of workshops on data based research methods and tools. Details and registration for each class are available at the links that follow. (Interested in keeping up to date with workshops and events in Data and GIS? Just go to https://lists.duke.edu/sympa/info/dgs-announce and click on the “Subscribe” link at the bottom left.)
Data and GIS also offers instruction tailored to courses or research teams. Please contact askdata@duke.edu to schedule a session!
Data Management
Data Management Planning – DMPTool – Get 24/7 online help for your next data management plan, including information about Duke resources available for your data work.
Statistical Software Updates
Stata 13 is now available in our lab and training room
QSR’s Nvivo qualitative software is available on all machines
Data & GIS Services is hiring! We have two open positions for student web programmers interested in working on data visualization projects. See the Library Student employment page (http://library.duke.edu/jobs/students.html) for more information on how to apply. (The job can be found by searching for requisition number “DUL14-AMZ02”.)
New Data and Map Collections
CPS on Web (CPS Utilities Online) CPS on Web is a set of utilities enabling you to access CPS data and documentation from this website. You may make tables and graphs from the CPS data, download data extractions, make estimations, get summaries and statistical measures, search the documentation, and make your own variables as functions of the existing ones.
Global Financial Data Global Financial Data is a collection of financial and economic data provided in ASCII or Excel format. Data includes: long-term historical indices on stock markets; Total Return data on stocks, bonds, and bills; interest rates; exchange rates; inflation rates; bond indices; commodity indices and prices; consumer price indices; gross domestic product; individual stocks; sector indices; treasury bill yields; wholesale price indices; and unemployment rates covering over 200 countries.
LandScan Global
The LandScan Global Population Database provides global population distribution in a gridded GIS format at 30 arc-second resolution (approximately 1×1 km cells). Oak Ridge National Laboratory developed modeling techniques to disaggregate and interpolate census data within administrative boundaries to create a GIS layer showing population distribution as accurately and as timely as possible. EastView provides this data to use in GIS software as a WMS (Web Mapping Service) or as a WCS (Web Coverage Service) to allow a user to incorporate population distribution into GIS mapping and analysis.
Understanding library users’ research goals remains a key element of the Perkins Library’s Strategic Plan. As part of the Library’s User Studies Initiative, Teddy Gray surveyed the Biology Department in the Fall of 2010 to discover what tools and resources departmental members use in their research, researchers’ data management needs, and the impact of the BES Library closing in 2009.
DATA AND DATA MANAGEMENT IN BIOLOGY
From the 18 interviews of faculty, graduate students, postdocs, and lab managers, we learned–not surprisingly–that nearly all the interviewees use data in their research, most of which they generate themselves. Half incorporate data from others into their work with nearly a third using sequence data from GenBank. Out of the 12 interviewees who generate data in their labs, two-thirds archive their data in existing repositories.
In addition to the interviews, this survey also examined research articles produced by Duke Biologists from 2009 in which we paid special attention to their methods sections and citation patterns. From analyzing departmental research articles, we found out the nearly 40% of the authors deposited their research data into either GenBank or a journal archive. Only one author deposited data into another existing scientific repository. Again nearly 40% of the authors used a general statistical package in their work (SAS and R being the most popular), while nearly half used a biology-specific statistical tool.
THE (RISE?) PREVALENCE of R
Almost everyone interviewed uses statistical tools in their research with over half now using R. Many also use biology-specific statistical programs.
PRINT VERSUS ELECTRONIC
All but one of the interviewees prefer the online versions of library material over the print. A third use image databases–primarily Google Images–in their teaching and presentations; however, only one interviewee knew of subject specific image databases such as the Biology Image Library. And while some interviewees missed the convenience of easy shelf browsing with the BES Library so close by, all are happy with the daily document delivery to the building.
FINAL THOUGHTS
We are grateful to the Biology Department for their support (and time) in conducting this survey and plan to use the results as the basis for library services. Data and GIS Services is always interested in hearing more from Duke researchers about the nature of your research! Please let us know if you would like to discuss your research interest and/or library needs.


 How do you support 57,860 online students