
 Our third year of the Duke Student Data Visualization Contest has come and gone, and we had another amazing group of submissions this year. The 19 visualizations submitted covered a very broad range of subject matter and visualization styles. Especially notable this year was the increase in use of graphic design software like Illustrator, Photoshop, and Inkscape to customize the design of the submissions. The winners and other submissions to the contest will soon be featured on the Duke Data Visualization Flickr Gallery.
As in the past, the submissions were judged on the basis of five criteria: insightfulness, broad appeal, aesthetics, technical merit, and novelty. The three winning submissions this year exemplify all of these and tell rich stories about three very different types of research projects. The winners will be honored at a public reception on Friday, April 10, from 2:00 p.m. to 3:00 p.m, in the Brandaleone Lab for Data and Visualization Services (in the Edge). They will each receive an Amazon gift card, and a poster version of the projects will be displayed in the lab. We are very grateful to Duke University Libraries and the Sanford School of Public Policy for sponsoring this year’s contest.
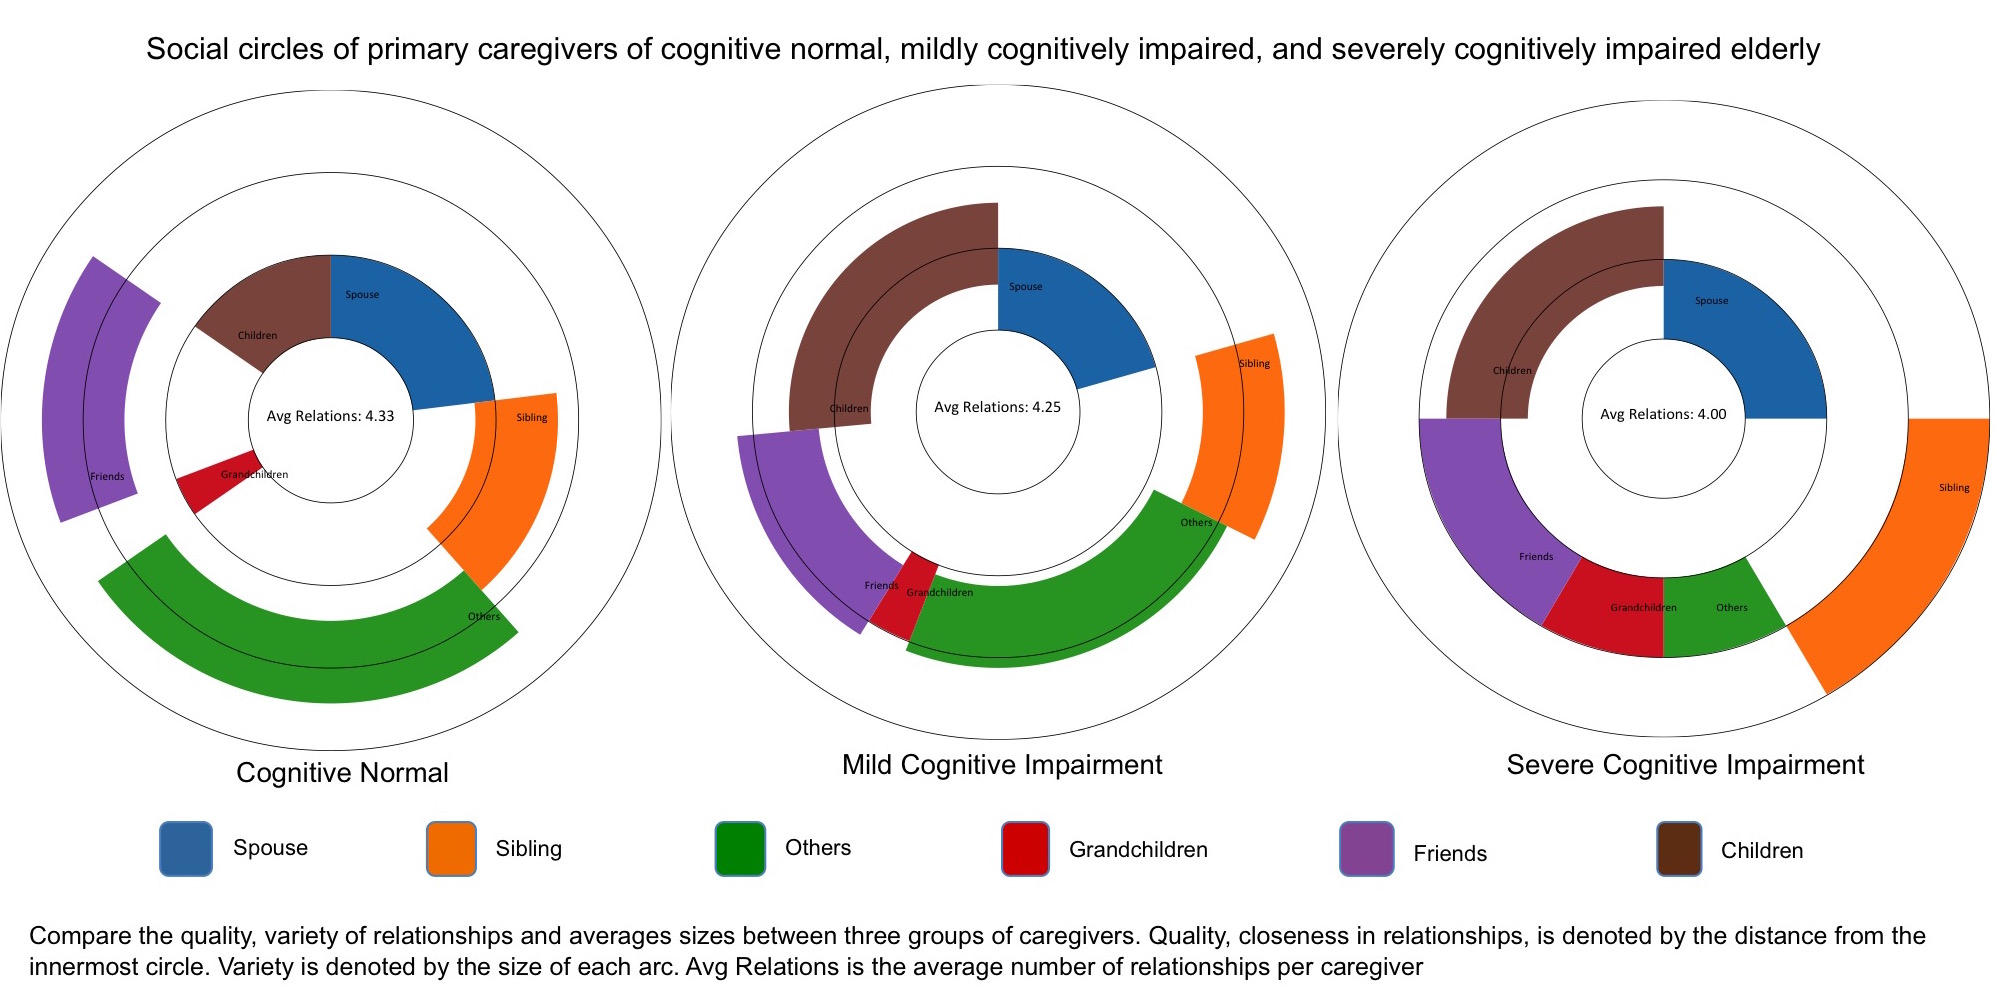
First place:
Social Circles of Primary Caregivers / Tina Chen
Second place:
Crystal Structure of Human Proliferating Cell Nuclear Antigen (PCNA) for in silico Drug Screen / Yuqian Shi

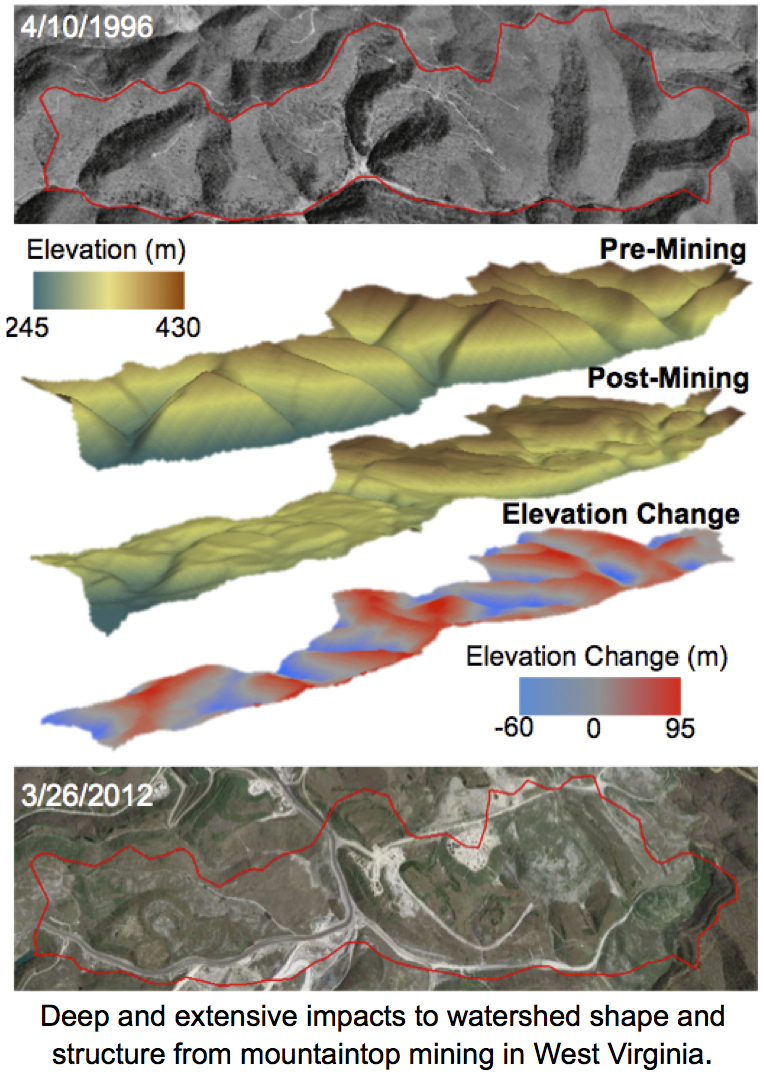
Third place:
Deep and Extensive Impacts to Watershed Shape and Structure from Mountaintop Mining in West Virginia / Matthew Ross
Please join us in celebrating the outstanding work of these students, as well as the closing of the Places & Spaces: Mapping Science exhibit, on April 10 in the Edge.