Category Archives: Digitization Expertise

Multispectral Imaging Summer Snapshots

If you are a regular Bitstreams reader, you know we just love talking about Multispectral Imaging.  Seriously, we can go on and on about it, and we are not the only ones.   This week however we are keeping it short and sweet and sharing a couple before and after images from one of our most recent imaging sessions.

Below are two stacked images of Ashkar MS 16 (from the Rubenstein Library).  The top half of each image is the manuscript under natural light, and the bottom are the results of Multispectral imaging and processing.  We tend to post black and white MSI images most often as they are generally the most legible, however our MSI software can produce a lot of wild color variations!  The orange one below seemed the most appropriate for a hot NC July afternoon like today.  More processing details are included in the image captions below – enjoy!

The text of this manuscript above was revealed primarily with the IR narrowband light at 780 nm.
This image was created using Teem, a tool used to process and visualize scientific raster data. This specific image is the result of flatfielding each wavelength image and arranging them in wavelength order to produce a vector for each pixel. The infinity norm is computed for each vector to produce a scalar value for each pixel which is then histogram-equalized and assigned a color by a color-mapping function.

A History of Videotape, Part 1

As a Digital Production Specialist at Duke Libraries, I work with a variety of obsolete videotape formats, digitizing them for long-term preservation and access. Videotape is a form of magnetic tape, consisting of a magnetized coating on one side of a strip of plastic film. The film is there to support the magnetized coating, which usually consists of iron oxide. Magnetic tape was first invented in 1928, for recording sound, but it would be several decades before it could be used for moving images, due to the increased bandwidth that is required to capture the visual content.

Bing Crosby was the first major entertainer who pushed for audiotape recordings of his radio broadcasts. in 1951, his company, Bing Crosby Enterprises (BCE) debuted the first videotape technology to the public.

Television was live in the beginning, because there was no way to pre-record the broadcast other than with traditional film, which was expensive and time-consuming. In 1951, Bing Crosby Enterprises (BCE), owned by actor and singer Bing Crosby, demonstrated the first videotape recording. Crosby had previously incorporated audiotape recording into the production of his radio broadcasts, so that he would have more time for other commitments, like golf! Instead of having to do a live radio broadcast once a week for a month, he could record four broadcasts in one week, then have the next three weeks off. The 1951 demonstration ran quarter-inch audiotape at 360 inches per second, using a modified Ampex 200 tape recorder, but the images were reportedly blurry and not broadcast quality.

Ampex introduced 2” quadruplex videotape at the National Association of Broadcasters convention in 1956. Shown here is a Bosch 2″ Zoll Quadruplex Machine.

More companies experimented with the emerging technology in the early 1950’s, until Ampex introduced 2” black and white quadruplex videotape at the National Association of Broadcasters convention in 1956. This was the first videotape that was broadcast quality. Soon, television networks were broadcasting pre-recorded shows on quadruplex, and were able to present them at different times in all four U.S. time zones. Some of the earliest videotape broadcasts were CBS’s “The Edsel Show,” CBS’s “Douglas Edwards with the News,” and NBC’s “Truth or Consequences.” In 1958, Ampex debuted a color quadruplex videotape recorder. NBC’s “An Evening with Fred Astaire” was the first major TV show to be videotaped in color, also in 1958.

Virtually all the videotapes of the first ten years (1962-1972) of “The Tonight Show with Johnny Carson” were taped over by NBC to save money, so no one has seen these episodes since broadcast, nor will they… ever.


One of the downsides to quadruplex, is that the videotapes could only be played back using the same tape heads which originally recorded the content. Those tape-heads wore out very quickly, which mean’t that many tapes could not be reliably played back using the new tape-heads that replaced the exhausted ones. Quadruplex videotapes were also expensive, about $300 per hour of tape. So, many TV stations maximized the expense, by continually erasing tapes, and then recording the next broadcast on the same tape. Unfortunately, due to this, many classic TV shows are lost forever, like the vast majority of the first ten years (1962-1972) of “The Tonight Show with Johnny Carson,” and Super Bowl II (1968).

Quadruplex was the industry standard until the introduction of 1” Type C, in 1976. Type C video recorders required less maintenance, were more compact and enabled new functions, like still frame, shuttle and slow motion, and 1” Type C did not require time base correction, like 2” Quadruplex did. Type C is a composite videotape format, with quality that matches later component formats like Betacam. Composite video merges the color channels so that it’s consistent with a broadcast signal. Type C remained popular for several decades, until the use of videocassettes gained in popularity. We will explore that in a future blog post.

Let’s Get Small: a tribute to the mighty microcassette

In past posts, I’ve paid homage to the audio ancestors with riffs on such endangered–some might say extinct–formats as DAT and Minidisc.  This week we turn our attention to the smallest (and perhaps the cutest) tape format of them all:  the Microcassette.

Introduced by the Olympus Corporation in 1969, the Microcassette used the same width tape (3.81 mm) as the more common Philips Compact Cassette but housed it in a much smaller and less robust plastic shell.  The Microcassette also spooled from right to left (opposite from the compact cassette) as well as using slower recording speeds of 2.4 and 1.2 cm/s.  The speed adjustment, allowing for longer uninterrupted recording times, could be toggled on the recorder itself.  For instance, the original MC60 Microcassette allowed for 30 minutes of recorded content per “side” at standard speed and 60 minutes per side at low speed.

The microcassette was mostly used for recording voice–e.g. lectures, interviews, and memos.  The thin tape (prone to stretching) and slow recording speeds made for a low-fidelity result that was perfectly adequate for the aforementioned applications, but not up to the task of capturing the wide dynamic and frequency range of music.  As a result, the microcassette was the go-to format for cheap, portable, hand-held recording in the days before the smartphone and digital recording.  It was standard to see a cluster of these around the lectern in a college classroom as late as the mid-1990s.  Many of the recorders featured voice-activated recording (to prevent capturing “dead air”) and continuously variable playback speed to make transcription easier.

The tiny tapes were also commonly used in telephone answering machines and dictation machines.

As you may have guessed, the rise of digital recording, handheld devices, and cheap data storage quickly relegated the microcassette to a museum piece by the early 21st century.  While the compact cassette has enjoyed a resurgence as a hip medium for underground music, the poor audio quality and durability of the microcassette have largely doomed it to oblivion except among the most willful obscurantists.  Still, many Rubenstein Library collections contain these little guys as carriers of valuable primary source material.  That means we’re holding onto our Microcassette player for the long haul in all of its atavistic glory.

image by the author. other images in this post taken from Wikimedia Commons (https://commons.wikimedia.org/wiki/Category:Microcassette)


The Outer Limits of Aspect Ratios

“There is nothing wrong with your television set. Do not attempt to adjust the picture. We are controlling transmission. We will control the horizontal. We will control the vertical. We repeat: there is nothing wrong with your television set.”

That was part of the cold open of one of the best science fiction shows of the 1960’s, “The Outer Limits.” The implication being that by controlling everything you see and hear in the next hour, the show’s producers were about to blow your mind and take you to the outer limits of human thought and fantasy, which the show often did.

In regards to controlling the horizontal and the vertical, one of the more mysterious parts of my job is dealing with aspect ratios when it comes to digitizing videotape. The aspect ratio of any shape is the proportion of it’s dimensions. For example, the aspect ratio of a square is always 1 : 1 (width : height). That means, in any square, the width is always equal to the height, regardless of whether a square is 1-inch wide or 10-feet wide. Traditionally, television sets displayed images in a 4 : 3 ratio. So, if you owned a 20” CRT (cathode ray tube) TV back in the olden days, like say 1980, the broadcast image on the screen was 16” wide by 12” high. So, the height was 3/4 the size of the width, or 4 : 3. The 20” dimension was determined by measuring the rectangle diagonally, and was mainly used to categorize and advertise the TV.


Almost all standard-definition analog videotapes, like U-matic, Beta and VHS, have a 4 : 3 aspect ratio. But when digitizing the content, things get more complicated. Analog video monitors display pixels that are tall and thin in shape. The height of these pixels is greater than their width, whereas modern computer displays use pixels that are square in shape. On an analog video monitor, NTSC video displays at roughly 720 (tall and skinny) pixels per horizontal line, and there are 486 visible horizontal lines. If you do the math on that, 720 x 486 is not 4 : 3. But because the analog pixels display tall and thin, you need more of them aligned vertically to fill up a 4 : 3 video monitor frame.


When Duke Libraries digitizes analog video, we create a master file that is 720 x 486 pixels, so that if someone from the broadcast television world later wants to use the file, it will be native to that traditional standard-definition broadcast specification. However, in order to display the digitized video on Duke’s website, we make a new file, called a derivative, with the dimensions changed to 640 x 480 pixels, because it will ultimately be viewed on computer monitors, laptops and smart phones, which use square pixels. Because the pixels are square, 640 x 480 is mathematically a 4 : 3 aspect ratio, and the video will display properly. The derivative video file is also compressed, so that it will stream smoothly regardless of internet bandwidth limits.

“We now return control of your television set to you. Until next week at the same time, when the control voice will take you to – The Outer Limits.”

Multispectral Imaging Through Collaboration

I am sure you have all been following the Library’s exploration into Multispectral Imaging (MSI) here on Bitstreams, Preservation Underground and the News & Observer.  Previous posts have detailed our collaboration with R.B. Toth Associates and the Duke Eye Center, the basic process and equipment, and the wide range of departments that could benefit from MSI.  In early December of last year (that sounds like it was so long ago!), we finished readying the room for MSI capture, installed the equipment, and went to MSI boot camp.

Obligatory before and after shot. In the bottom image, the new MSI system is in the background on the left with the full spectrum system that we have been using for years on the right. Other additions to the room are blackout curtains, neutral gray walls and black ceiling tiles all to control light spill between the two camera systems. Full spectrum overhead lighting and a new tile floor were installed which is standard for an imaging lab in the Library.

Well, boot camp came to us. Meghan Wilson, an independent contractor who has worked with R.B. Toth Associates for many years, started our training with an overview of the equipment and the basic science behind it. She covered the different lighting schemes and when they should be used.  She explained MSI applications for identifying resins, adhesives and pigments and how to use UV lighting and filters to expose obscured text.   We quickly went from talking to doing.  As with any training session worth its salt, things went awry right off the bat (not Meghan’s fault).  We had powered up the equipment but the camera would not communicate with the software and the lights would not fire when the shutter was triggered.  This was actually a good experience because we had to troubleshoot on the spot and figure out what was going on together as a team.  It turns out that there are six different pieces of equipment that have to be powered-up in a specific sequence in order for the system to communicate properly (tee up Apollo 13 soundtrack). Once we got the system up and running we took turns driving the software and hardware to capture a number of items that we had pre-selected.  This is an involved process that produces a bunch of files that eventually produce an image stack that can be manipulated using specialized software.  When it’s all said and done, files have been converted, cleaned, flattened, manipulated and variations produced that are somewhere in the neighborhood of 300 files. Whoa!

This is not your parents’ point and shoot—not the room, the lights, the curtains, the hardware, the software, the pricetag, none of it. But it is different in another more important way too. This process is team-driven and interdisciplinary. Our R&D working group is diverse and includes representatives from the following library departments.

  • The Digital Production Center (DPC) has expertise in high-end, full spectrum imaging for cultural heritage institutions along with a deep knowledge of the camera and lighting systems involved in MSI, file storage, naming and management of large sets of files with complex relationships.
  • The Duke Collaboratory for Classics Computing (DC3) offers a scholarly and research perspective on papyri, manuscripts, etc., as well as  experience with MSI and other imaging modalities
  • The Conservation Lab brings expertise in the Libraries’ collections and a deep understanding of the materiality and history of the objects we are imaging.
  • Duke Libraries’ Data Visualization Services (DVS) has expertise in the processing and display of complex data.
  • The Rubenstein Library’s Collection Development brings a deep understanding of the collections, provenance and history of materials, and valuable contacts with researchers near and far.

To get the most out of MSI we need all of those skills and perspectives. What MSI really offers is the ability to ask—and we hope answer—strings of good questions. Is there ink beneath that paste-down or paint? Is this a palimpsest? What text is obscured by that stain or fire-damage or water damage? Can we recover it without having to intervene physically? What does the ‘invisible’ text say and what if anything does this tell us about the object’s history? Is the reflectance signature of the ink compatible with the proposed date or provenance of the object? That’s just for starters. But you can see how even framing the right question requires a range of perspectives; we have to understand what kinds of properties MSI is likely to illuminate, what kinds of questions the material objects themselves suggest or demand, what the historical and scholarly stakes are, what the wider implications for our and others’ collections are, and how best to facilitate human interface with the data that we collect. No single person on the team commands all of this.

Working in any large group can be a challenge. But when it all comes together, it is worth it. Below is a page from Jantz 723, one processed as a black and white image and the other a Principal Component Analysis produced by the MSI capture and processed using ImageJ and a set of tools created by Bill Christens-Barry of R.B. Toth Associates with false color applied using Photoshop. Using MSI we were able to better reveal this watermark which had previously been obscured.

Jantz 723

I think we feel like 16-year-old kids with newly minted drivers’ licenses who have never driven a car on the highway or out of town. A whole new world has just opened up to us, and we are really excited and a little apprehensive!

What now?

Practice, experiment, document, refine. Over the next 12 (16? 18) months we will work together to hone our collective skills, driving the system, deepening our understanding of the scholarly, conservation, and curatorial use-cases for the technology, optimizing workflow, documenting best practices, getting a firm grip on scale, pace, and cost of what we can do. The team will assemble monthly, practice what we have learned, and lean on each other’s expertise to develop a solid workflow that includes the right expertise at the right time.  We will select a wide variety of materials so that we can develop a feel for how far we can push the system and what we can expect day to day. During all of this practice, workflows, guidelines, policies and expectations will come into sharper focus.

As you can tell from the above, we are going to learn a lot over the coming months.  We plan to share what we learn via regular posts here and elsewhere.  Although we are not prepared yet to offer MSI as a standard library service, we are interested to hear your suggestions for Duke Library collection items that may benefit from MSI imaging.  We have a long queue of items that we would like to shoot, and are excited to add more research questions, use cases, and new opportunities to push our skills forward.   To suggest materials, contact Molly Bragg, Digital Collections Program Manager (molly.bragg at Duke.edu), Joshua Sosin, Associate Professor in Classical Studies & History (jds15 at Duke.edu) or Curator of Collections (andrew.armacost at Duke.edu).

Want to learn even more about MSI at DUL?

Cutting Through the Noise

Noise is an inescapable part of our sonic environment.  As I sit at my quiet library desk writing this, I can hear the undercurrent of the building’s pipes and HVAC systems, the click-clack of the Scribe overhead book scanner, footsteps from the floor above, doors opening and closing in the hallway, and the various rustlings of my own fidgeting.  In our daily lives, our brains tune out much of this extraneous noise to help us focus on the task at hand and be alert to sounds conveying immediately useful information: a colleagues’s voice, a cell-phone buzz, a fire alarm.

When sound is recorded electronically, however, this tuned-out noise is often pushed to the foreground.  This may be due to the recording conditions (e.g. a field recording done on budget equipment in someone’s home or outdoors) or inherent in the recording technology itself (electrical interference, mechanical surface noise).  Noise is always present in the audio materials we digitize and archive, many of which are interviews, oral histories, and events recorded to cassette or open reel tape by amateurs in the field.  Our first goal is to make the cleanest and most direct analog-to-digital transfer possible, and then save this as our archival master .wav file with no alterations.  Once this is accomplished, we have some leeway to work with the digital audio and try to create a more easily listenable and intelligible access copy.

img_2190

I recently started experimenting with Steinberg WaveLab software to clean up digitized recordings from the Larry Rubin Papers.  This collection contains some amazing documentation of Rubin’s work as a civil rights organizer in the 1960s, but the ever-present hum & hiss often threaten to obscure the content.  I worked with two plug-ins in WaveLab to try to mitigate the noise while leaving the bulk of the audio information intact.

plugin1

Even if you don’t know it by name, anyone who has used electronic audio equipment has probably heard the dreaded 60 Cycle Hum.  This is a fixed low-frequency tone that is related to our main electric power grid operating at 120 volts AC in the United States.  Due to improper grounding and electromagnetic interference from nearby wires and appliances, this current can leak into our audio signals and appear as the ubiquitous 60 Hz hum (disclaimer–you may not be able to hear this as well on tiny laptop speakers or earbuds).  Wavelab’s De-Buzzer plug-in allowed me to isolate this troublesome frequency and reduce its volume level drastically in relation to the interview material.  Starting from a recommended preset, I adjusted the sensitivity of the noise reduction by ear to cut unwanted hum without introducing any obvious digital artifacts in the sound.

plugin2

Similarly omnipresent in analog audio is High-Frequency Hiss.  This wash of noise is native to any electrical system (see Noise Floor) and is especially problematic in tape-based media where the contact of the recording and playback heads against the tape introduces another level of “surface noise.”  I used the De-Noiser plug-in to reduce hiss while being careful not to cut into the high-frequency content too much.  Applying this effect too heavily could make the voices in the recording sound dull and muddy, which would be counterproductive to improving overall intelligibility.

Listen to the before & after audio snippets below.  While the audio is still far from perfect due to the original recording conditions, conservative application of the noise reduction tools has significantly cleaned up the sound.  It’s possible to cut the noise even further with more aggressive use of the effects, but I felt that would do more harm than good to the overall sound quality.

BEFORE:

AFTER:


I was fairly pleased with these results and plan to keep working with these and other software tools in the future to create digital audio files that meet the needs of archivists and researchers.  We can’t eliminate all of the noise from our media-saturated lives, but we can always keep striving to keep the signal-to-noise ratio at manageable and healthy levels.


img_2187

Color Bars & Test Patterns

In the Digital Production Center, many of the videotapes we digitize have “bars and tone” at the beginning of the tape. These are officially called “SMPTE color bars.” SMPTE stands for The Society of Motion Picture and Television Engineers, the organization that established the color bars as the North American video standard, beginning in the 1970s. In addition to the color bars presented visually, there is an audio tone that is emitted from the videotape at the same time, thus the phrase “bars and tone.”

color_bars
SMPTE color bars

The purpose of bars and tone is to serve as a reference or target for the calibration of color and audio levels coming from the videotape during transmission. The color bars are presented at 75% intensity. The audio tone is a 1kHz sine wave. In the DPC, we can make adjustments to the incoming signal, in order to bring the target values into specification. This is done by monitoring the vectorscope output, and the audio levels. Below, you can see the color bars are in proper alignment on the DPC’s vectorscope readout, after initial adjustment.

vectorscope
Color bars in proper alignment with the Digital Production Center’s vectorscope readout. Each letter stands for a color: red, magenta, blue, cyan, green and yellow.

We use Blackmagic Design’s SmartView monitors to check the vectorscope, as well as waveform and audio levels. The SmartView is an updated, more compact and lightweight version of the older, analog equipment traditionally used in television studios. The Smartview monitors are integrated into our video rack system, along with other video digitization equipment, and numerous videotape decks.

dpc_video_rack
The Digital Production Center’s videotape digitization system.

If you are old enough to have grown up in the black and white television era, you may recognize this old TV test pattern, commonly referred to as the “Indian-head test pattern.” This often appeared just before a TV station began broadcasting in the morning, and again right after the station signed off at night. The design was introduced in 1939 by RCA. The “Indian-head” image was integrated into a pattern of lines and shapes that television engineers used to calibrate broadcast equipment. Because the illustration of the Native American chief contained identifiable shades of gray, and had fine detail in the feathers of the headdress, it was ideal for adjusting brightness and contrast.

indian_head
The Indian-head test pattern was introduced by RCA in 1939.

When color television debuted in the 1960’s, the “Indian-head test pattern” was replaced with a test card showing color bars, a precursor to the SMPTE color bars. Today, the “Indian-head test pattern” is remembered nostalgically, as a symbol of the advent of television, and as a unique piece of Americana. The master art for the test pattern was discovered in an RCA dumpster in 1970, and has since been sold to a private collector.  In 2009, when all U.S. television stations were required to end their analog signal transmission, many of the stations used the Indian-head test pattern as their final analog broadcast image.

The FADGI Still Image standard: It isn’t just about file specs

In previous posts I have referred to the FADGI standard for still image capture when describing still image creation in the Digital Production Center in support of our Digital Collections Program.  We follow this standard in order to create archival files for preservation, long-term retention and access to our materials online.  These guidelines help us create digital content in a consistent, scalable and efficient way.  The most common cited part of the standard is the PPI guidelines for capturing various types of material.  It is a collection of charts that contain various material types, physical dimensions and recommended capture specifications.  The charts are very useful and relatively easy to read and understand.  But this standard includes 93 “exciting” pages of all things still image capture including file specifications, color encoding, data storage, physical environment, backup strategies, metadata and workflows.  Below I will boil down the first 50 or so pages.

The FADGI standard was built using the NARA Technical Guideline for Digitizing Archival Materials for Electronic Access: Creation of Production Master Files – Raster Images which was established in 2004.  The FADGI standard for still image capture is meant to be a set of best practices for cultural heritage institutions and has been recently updated to include new advances in the field of still image capture and contains more approachable language than its predecessor. FADGI1

Full disclosure. Perkins Library and our digitization program didn’t start with any part of these guidelines in place.  In fact, these guidelines didn’t exist at the time of our first attempt at in-house digitization in 1993.  We didn’t even have an official digitization lab until early 2005.  We started with one Epson flatbed scanner and one high end CRT monitor.  As our Digital Collections Program has matured, we have been able to add equipment and implement more of the standard starting with scanner and monitor calibration and benchmark testing of capture equipment before purchase.  We then established more consistent workflows and technical metadata capture, developed a more robust file naming scheme, file movement and data storage strategies.  We now work hard to synchronize our efforts between all of the departments involved in our Digital Collections Program.  We are always refining our workflows and processes to become more efficient at publishing and preserving Digital Collections.epson

Dive Deep.  For those of you who would like to take a deep dive into image capture for cultural heritage institutions, here is the full standard.  For those of you who don’t fall into this category, I’ve boiled down the standard below.  I believe that it’s necessary to use the whole standard in order for a program to become stable and mature.  As we did, this can be implemented over time. dive

Boil It Down. The FADGI standard provides a tiered approach for still image capture, from 1 to 4 stars, with four stars being the highest.  The 1 and 2 star tiers are used when imaging for access and tiers 3 and 4 are used for archival imaging and preservation at the focus.

The physical environment: The environment should be color neutral.   Walls should be painted a neutral gray to minimize color shifts and flare that might come from a wall color that is not neutral.  Monitors should be positioned to avoid glare on the screens (This is why most professional monitors have hoods).  Overhead lighting should be around 5000K (Tungsten, florescent and other bulbs can have yellow, magenta and green color shifts which can affect the perception of the color of an image).  Each capture device should be separated so that light spillover doesn’t affect another capture device.

Monitors and Light boxes and viewing of originals: Overhead light or a viewing booth should be set up for viewing of originals and should be a neutral 5000K.  A light box used for viewing transmissive material should also be 5000K.

Digital images should be viewed in the colorspace they were captured in and the monitor should be able to display that colorspace.  Most monitors display in the sRGB colorspace. However, professional monitors use the AdobeRGB colorspace which is commonly used in cultural heritage image capture.  The color temperature of your monitor should be set to the Kelvin temperature that most closely matches the viewing environment.  If the overhead lights are 5000K, then the monitor’s color temperature should also be set to 5000K.

Calibrating packages that consist of hardware and software that read and evaluate color is an essential piece of equipment.  These packages normalize the luminosity, color temperature and color balance of a monitor and create an ICC display profile that is used by the computer’s operating system to display colors correctly so that accurate color assessment can be made. gedT013

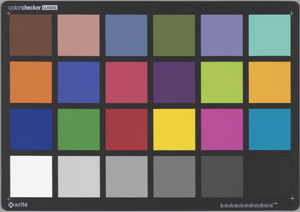
Capture Devices: The market is flooded with capture devices of varying quality.  It is important to do research on any new capture device.  I recommend skipping the marketing schemes that tout all the bells and whistles and just stick to talking to institutions that have established digital collections programs.  This will help to focus research on the few contenders that will produce the files that you need.  They will help you slog through how many megapixels are necessary, what lens are best for which application, what scanner driver is easiest to use while balanced with getting the best color out of your scanner.  Beyond the capture device, other things that come into play are effective scanner drivers that produce the most accurate and consistent results, upgrade paths for your equipment and service packages that help maintain your equipment.

Capture Specifications: I’ll keep this part short because there are a wide variety of charts covering many formats, capture specifications and their corresponding tiers.  Below I have simplified the information from the charts.  These specification hover between tier 3 and 4 mostly leaning toward 4.

Always use a FADGI compliant reference target at the beginning of a session to ensure the capture device is within acceptable deviation.  The target values differ depending on which reference targets are used.  Most targets come with a chart representing numerical value of each swatch in the target.  Our lab uses a classic Gretagmacbeth target and our acceptable color deviation is +/- 5 units of color.

Our general technical specs for reflective material including books, documents, photographs and maps are:

  • Master File Format: TIFF
  • Resolution: 300 ppi
  • Bit Depth: 8
  • Color Depth: 24 bit RGB
  • Color Space: Adobe 1998

These specifications generally follow the standard.  If the materials being scanned are smaller than 5×7 inches we increase the PPI to 400 or 600 depending on the font size and dimensions of the object.

Our general technical specs for transmissive material including acetate, nitrate and glass plate negatives, slides and other positive transmissive material are:

  • Master File Format: TIFF
  • Resolution: 3000 – 4000 ppi
  • Bit Depth: 16
  • Color Depth: 24 bit RGB
  • Color Space: Adobe 1998

These specifications generally follow the standard.  If the transmissive materials being scanned are larger than 4×5 we decrease the PPI to 1500 or 2000 depending on negative size and condition.

Recommended capture devices: The standard goes into detail on what capture devices to use and not to use when digitizing different types of material.  It describes when to use manually operated planetary scanners as opposed to a digital scan back, when to use a digital scan back instead of a flatbed scanner,   when and when not to use a sheet fed scanner.  Not every device can capture every type of material.  In our lab we have 6 different devices to capture a wide variety of material in different states of fragility.  We work with our Conservation Department when making decisions on what capture device to use.

General Guidelines for still image capture

  • Do not apply pressure with a glass platen or otherwise unless approved by a paper conservator.
  • Do not use vacuum boards or high UV light sources unless approved by a paper conservator.
  • Do not use auto page turning devices unless approved by a paper conservator.
  • For master files, pages, documents and photographs should be imaged to include the entire area of the page, document or photograph.
  • For bound items the digital image should capture as far into the gutter as practical but must include all of the content that is visible to the eye.
  • If a backing sheet is used on a translucent piece of paper to increase contrast and readability, it must extend beyond the edge of the page to the end of the image on all open sides of the page.
  • For master files, documents should be imaged to include the entire area and a small amount beyond to define the area.
  • Do not use lighting systems that raise the surface temperature of the original more than 6 degrees F(3 degrees C)in the total imaging process.
  • When capturing oversized material, if the sections of a multiple scan item are compiled into a single image, the separate images should be retained for archival and printing purposes.
  • The use of glass or other materials to hold photographic images flat during capture is allowed, but only when the original will not be harmed by doing so. Care must be taken to assure that flattening a photograph will not result in emulsion cracking, or the base material being damaged.  Tightly curled materials must not be forced to lay flat.
  • For original color transparencies, the tonal scale and color balance of the digital image should match the original transparency being scanned to provide accurate representation of the image.
  • When scanning  negatives,  for  master  files  the  tonal  orientation  may be  inverted  to produce a positive    The  resulting image  will  need  to  be  adjusted  to  produce  a  visually-pleasing representation. Digitizing negatives is very analogous to printing negatives in a darkroom and it is very dependent on the  photographer’s/ technician’s  skill  and  visual  literacy  to  produce  a  good  image. There are few objective metrics for evaluating the overall representation of digital images produced from negatives.
  • The lack of dynamic range in a film scanning system will result in poor highlight and shadow detail and poor color reproduction.
  • No image retouching is permitted to master files.

These details were pulled directly from the standard.  They cover a lot of ground but there are always decisions to be made that are uniquely related to the material to be digitized.  There are 50 or so more pages of this standard related to workflow, color management, data storage, file naming and technical metadata.  I’ll have to cover that in my next blog post.

The FADGI standard for still image capture is very thorough but also leaves room to adapt.  While we don’t follow everything outlined in the standard we do follow the majority.  This standard, years of experience and a lot of trial and error have helped make our program more sound, consistent and scalable.

Digitizing for Exhibits

While most of my Bitstreams posts have focused on my work preserving and archiving audio collections, my job responsibilities also include digitizing materials for display in Duke University Libraries Exhibits.  The recent renovation and expansion of the Perkins Library entrance and the Rubenstein Library have opened up significantly more gallery space, meaning more exhibits being rotated through at a faster pace.

gallery2

Just in the past year, I’ve created digital images for exhibits on Vesalius’s study of human anatomy, William Gedney’s photographs, Duke Chapel’s stained glass windows, and the 1793 Yellow Fever epidemic.  I also worked with a wide range of materials spanning “books, manuscripts, photographs, recordings and artifacts that document human aspirations” for the Dreamers and Dissenters exhibit celebrating the reopening of the newly renovated David M. Rubenstein Rare Book & Manuscript Library.  The digital images are used to create enlargements and facsimiles for the physical exhibits and are also used in the online “virtual exhibits.”


Working with such a variety of media spanning different library collections presents a number of challenges and necessitates working closely with our Exhibits and Conservation departments.  First, we have to make sure that we have all of the items listed in the inventory provided by the exhibit curator.  Secondly, we have to make sure we have all of the relevant information about how each item should be digitally captured (e.g. What image resolution and file specifications?  Which pages from a larger volume?  What section of a larger map or print?)  Next we have to consider handling for items that are in fragile condition and need special attention.  Finally, we use all of this information to determine which scanner, camera, or A/V deck is appropriate for each item and what the most efficient order to capture them in is.

All of this planning and preliminary work helps to ensure that the digitization process goes smoothly and that most questions and irregularities have already been addressed.  Even so, there are always issues that come up forcing us to improvise creative solutions.  For instance:  how to level and stabilize a large, fragile folded map that is tipped into a volume with tight binding?  How to assemble a seamless composite image of an extremely large poster that has to be photographed in multiple sections?  How to minimize glare and reflection from glossy photos that are cupped from age?  I won’t give away all of our secrets here, but I’ll provide a couple examples from the Duke Chapel exhibit that is currently on display in the Jerry and Bruce Chappell Family gallery.

angel

This facsimile of a drawing for one of the Chapel’s carved angels was reproduced from an original architectural blueprint.  It came to us as a large and tightly rolled blueprint–so large, in fact, that we had to add a piece of plywood to our usual camera work surface to accommodate it.  We then strategically placed weights around the blueprint to keep it flattened while not obscuring the section with the drawing.  The paper was still slightly wrinkled and buckled in places (which can lead to uneven color and lighting in the resulting digital image) but fortunately the already mottled complexion of the blueprint material made it impossible to notice these imperfections.

projection

These projected images of the Chapel’s stained glass were reproduced from slides taken by a student in 1983 and currently housed in the University Archives.  After the first run through our slide scanner, the digital images looked okay on screen, but were noticeably blurry when enlarged.  Further investigation of the slides revealed an additional clear plastic protective housing which we were able to carefully remove.  Without this extra refractive layer, the digital images were noticeably sharper and more vibrant.

Despite the digitization challenges, it is satisfying to see these otherwise hidden treasures being displayed and enjoyed in places that students, staff, and visitors pass through everyday–and knowing that we played a small part in contributing to the finished product!


The Attics of Your Life

If you happen to be rummaging through your parents’ or grandparents’ attic, basement or garage, and stumble upon some old reel-to-reel audiotape, or perhaps some dust-covered videotape reels that seem absurdly large & clunky, they are most likely worthless, except for perhaps sentimental value. Even if these artifacts did, at one time, have some unique historic content, you may never know, because there’s a strong chance that decades of temperature extremes have made the media unplayable. The machines that were once used to play the media are often no longer manufactured, hard to find, and only a handful of retired engineers know how to repair them. That is, if they can find the right spare parts, which no one sells anymore.

Bart_starr_bw
Quarterback Bart Starr led the Green Bay Packers to a 35-10 victory over the Kansas City Chiefs in Super Bowl 1.
RCA Quadruplex 2"
Martin Haupt likely recorded Super Bowl 1 using an RCA Quadruplex 2″ color videotape recorder, common at television studios in the late 1960s.

However, once in a while, something that is one of a kind miraculously survives. That was the case for Troy Haupt, a resident of North Carolina’s Outer Banks, who discovered that his father, Martin Haupt, had recorded the very first Super Bowl onto 2” Quadruplex color videotape directly from the 1967 live television broadcast. After Martin passed away, the tapes ended up in Troy’s mother’s attic, yet somehow survived the elements.

What makes this so unique is that, in 1967, videotape was very expensive and archiving at television networks was not a priority. So the networks that aired the first Super Bowl, CBS and NBC, did not save any of the broadcast.

But Martin Haupt happened to work for a company that repaired professional videotape recorders, which were, in 1967, cutting edge technology. Taping television broadcasts was part of Martin’s job, a way to test the machines he was rebuilding. Fortunately, Martin went to work the day Super Bowl 1 aired live. The two Quadruplex videotapes that Martin Haupt used to record Super Bowl 1 cost $200 each in 1967. In today’s dollars, that’s almost $3000 total for the two tapes. Buying a “VCR” at your local department store was unfathomable then, and would not be possible for at least another decade. Somehow, Martin missed recording halftime, and part of the third quarter, but it turns out that Martin’s son Troy now owns the most complete known video recording of Super Bowl 1, in which the quarterback Bart Starr led the Green Bay Packers to a 35-10 victory over the Kansas City Chiefs.

Nagra IV-S
Betty Cantor-Jackson recorded many of the Grateful Dead’s landmark concerts using a Nagra IV-S Reel to Reel audiotape recorder. The Dead’s magnum opus, “Dark Star” could easily fill an entire reel.

For music fans, another treasure was uncovered in a storage locker in Marin County, CA, in 1986. Betty Cantor-Jackson worked for The Grateful Dead’s road crew, and made professional multi-track recordings of many of their best concerts, between 1971-1980, on reel-to-reel audiotape. The Dead were known for marathon concerts in which some extended songs, like “Dark Star” could easily fill an entire audio reel. The band gave Betty permission to record, but she purchased her own gear and blank tape, tapping into the band’s mixing console to capture high-quality, soundboard recordings of the band’s epic concerts during their prime era. Betty held onto her tapes until she fell on hard times in the 1980’s, lost her home, and had to move the tapes to a storage locker. She couldn’t pay the storage fees, so the locker contents went up for auction.

barton
Betty Cantor-Jackson recorded the Grateful Dead’s show at Barton Hall in 1977, considered by many fans to be one of their best concerts.

Some 1000 audio reels ended up in the hands of three different buyers, none of whom knew what the tapes contained. Once the music was discovered, copies of the recordings began to leak to hardcore tape-traders within the Deadhead community, and they became affectionately referred to as “The Betty Boards.” It turns out the tapes include some legendary performances, such as the 1971 Capitol Theatre run, and the May 1977 tour, including “Barton Hall, May 8, 1977,” considered by many Deadheads as one of the best Grateful Dead concerts of all time.

You would think the current owners of Super Bowl 1 and Barton Hall, May 8, 1977 would be sitting on gold. But, that’s where the lawyers come in. Legally, the people who possess these tapes own the physical tapes, but not the content on those tapes. So, Troy Haupt owns the 2” inch quadriplex reels of Super Bowl 1, but the NFL owns what you can see on those reels. The NFL owns the copyright of the broadcast. Likewise, The Grateful Dead owns the music on the audio reels, regardless of who owns the physical tape that contains the music. Unfortunately, for NFL fans and Deadheads, this makes the content somewhat inaccessable for now. Troy Haupt has offered to sell his videotapes to the NFL, but they have mostly ignored him. If Troy tries to sell the tapes to a third party instead, the NFL says they will sue him, for unauthorized distribution of their content. The owners of the Grateful Dead tapes face a similar dilema. The band’s management isn’t willing to pay money for the physical tapes, but if the owners, or any third party the owners sell the tapes to, try to distribute the music, they will get sued. However, if it weren’t for Martin Haupt and Betty Cantor-Jackson, who had the foresight to record these events in the first place, the content would not exist at all.