

For centuries, cultural heritage institutions—like libraries and archives—monitored the use of their collections through varying means of counting and recording. From rare manuscripts used in special collections reading rooms to the copy of Moby Dick checked out at the circulation desk, we like to keep note of who is using what. But what about those digitized special collections that patrons use more and more often? How do we monitor use of materials when they live on websites and are accessed remotely by computers, tablets, and smartphones? That’s where web analytics comes into play.
Google Analytics is by far the largest analytics aggregator today, and it is what many cultural heritage institutions turn to for data on digital collections. We can now rely on pageviews and sessions, and a plethora of other metrics, to inform us how patrons are using materials online.
Recently, I began examining the use of Duke University Archives’ digital collections to see what I could find. I quickly found that I was lost. Google Analytics is so overwhelmingly abundant with data, what I’d venture to call a statistical minefield (or ninja warrior obstacle course?), that I found myself in a fog of confusion. Don’t get me wrong, these data sets can be extremely useful if you know what you’re doing. It just took me a while to get my bearings and slowly crawl out of the fog.
With that said, if you’re interested in learning more, use every resource available to wrap your head around what Google Analytics offers and how it can help your institution. Google provides a set of tutorials at Analytics Academy. Another site, Lynda.com is a great subscription resource that may be accessible through institutional memberships. Don’t rule out YouTube either. I also learned a lot of the basics from Molly Bragg, my supervisor, who is on the Digital Library Federation Assessment Interest Group’s (DLF AIG) Analytics subcommittee. They’ve been working on a white paper to lay out digital library analytics best practices, which they hope will help steer cultural heritage institutions in the right direction.
In my own experience scouring usage data from the Duke Chapel Recordings collection, I found many rather predictable results: most users come from North Carolina, Durham in particular.


But then there were strange statistics that can sometimes be hard to figure out. Like why is Texas our third highest state for traffic, with 7% of our sessions originating there?
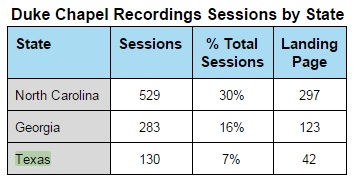
Of Texas’ total sessions, 22% viewed webpages relating to Carlyle Marney’s sermons. For much of the 1970s, Marney was a visiting professor at Duke’s Divinity School, but this web traffic all originated in Austin, TX. Doing some internet digging, I found that in the 1940s and 1950s, Marney was a pastor and seminary professor in Austin. It is understandable why the interest in his sermons comes from a region in Texas that is likely familiar with his pastoral work.
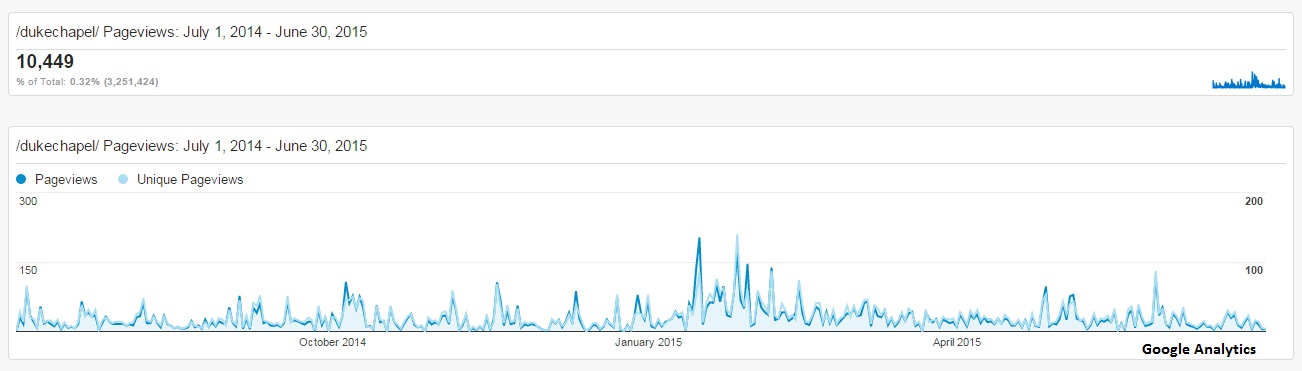
I also found that referrals from our very own Bitstreams blog make up a portion of the traffic to the collection. That explains some of our spikes in pageviews, which correspond with blog post dates. This is proof that social media does generate traffic!
Once that disorienting fog has lifted, and you have navigated the statistical minefield, you might just find that analytics can be fun. Now it doesn’t look so much like a minefield but a gold mine.
Have you found analytics useful at your cultural heritage institution? We’d love to hear from you!
2 thoughts on “Google Analytics and Digitized Cultural Heritage”
Comments are closed.