

Ever find yourself with a pile of data that you want to plot on a map? You’ve got names of places and lots of other data associated with those places, maybe even images? Well, this happened to me recently. Let me explain.
A few years ago we published the Broadsides and Ephemera digital collection, which consists of over 4,100 items representing almost every U.S. state. When we cataloged the items in the collection, we made sure to identify, if possible, the state, county, and city of each broadside. We put quite a bit of effort into this part of the metadata work, but recently I got to thinking…what do we have to show for all of that work? Sure, we have a browseable list of place terms and someone can easily search for something like “Ninety-Six, South Carolina.” But, wouldn’t it be more interesting (and useful) if we could see all of the places represented in the Broadsides collection on one interactive map? Of course it would.
So, I decided to make a map. It was about 4:30pm on a Friday and I don’t work past 5, especially on a Friday. Here’s what I came up with in 30 minutes, a Map of Broadside Places. Below, I’ll explain how I used some free and easy-to-use tools like Excel, Open Refine, and Google Fusion Tables to put this together before quittin’ time.
Step 1: Get some structured data with geographic information
Mapping only works if your data contain some geographic information. You don’t necessarily need coordinates, just a list of place names, addresses, zip codes, etc. It helps if the geographic information is separated from any other data in your source, like in a separate spreadsheet column or database field. The more precise, structured, and consistent your geographic data, the easier it will be to map accurately. To produce the Broadsides Map, I simply exported all of the metadata records from our metadata management system (CONTENTdm) as a tab delimited text file, opened it in Excel, and removed some of the columns that I didn’t want to display on the map.
Step 2: Clean up any messy data..
For the best results, you’ll want to clean your data. After opening my tabbed file in Excel, I noticed that the place name column contained values for country, state, county, and city all strung together in the same cell but separated with semicolons (e.g. United States; North Carolina; Durham County (N.C.); Durham (N.C.)). Because I was only really interested in plotting the cities on the map, I decided to split the place name column into several columns in order to isolate the city values.
To do this, you have a couple of options. You can use Excel’s “text to columns” feature, instructing it to split the column into new columns based on the semicolon delimiter or you can load your tabbed file into Open Refine and use its “split columns into several columns” feature. Both tools work well for this task, but I prefer OpenRefine because it includes several more advanced data cleaning features. If you’ve never used OpenRefine before, I highly recommend it. It’s “cluster and edit” feature will blow your mind (if you’re a metadata librarian).
Step 3: Load the cleaned data into Google Fusion Tables
Google Fusion Tables is a great tool for merging two or more data sets and for mapping geographic data. You can access Fusion Tables from your Google Drive (formerly Google Docs) account. Just upload your spreadsheet to Fusion Tables and typically the application will automatically detect if one of your columns contains geographic or location data. If so, it will create a map view in a separate tab, and then begin geocoding the location data.
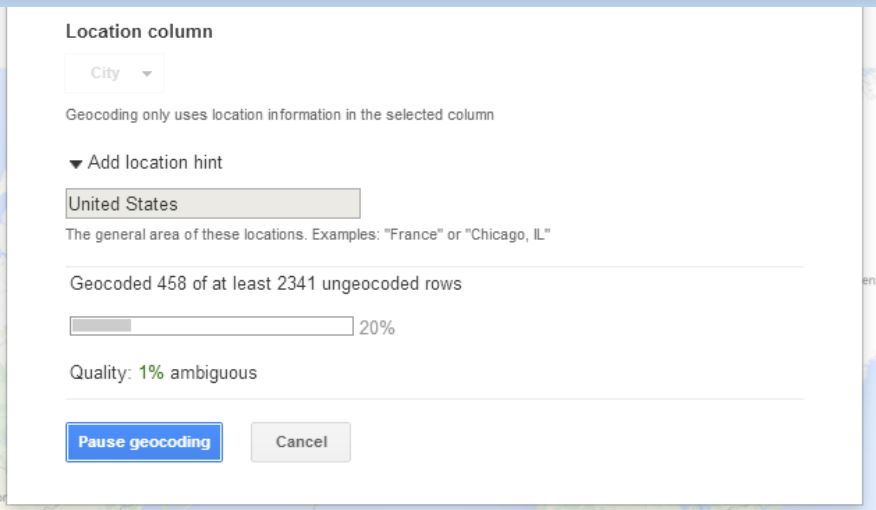
If Fusion Tables doesn’t automatically detect the geographic data in your source file, you can explicitly change a column’s data type in Fusion Tables to “Location” to trigger the geocoding process. Once the geocoding process begins, Fusion Tables will process every place name in your spreadsheet through the Google Maps API and attempt to plot that place on the map. In essence, it’s as if you were searching for each one of those terms in Google Maps and putting the results of all of those searches on the same map.
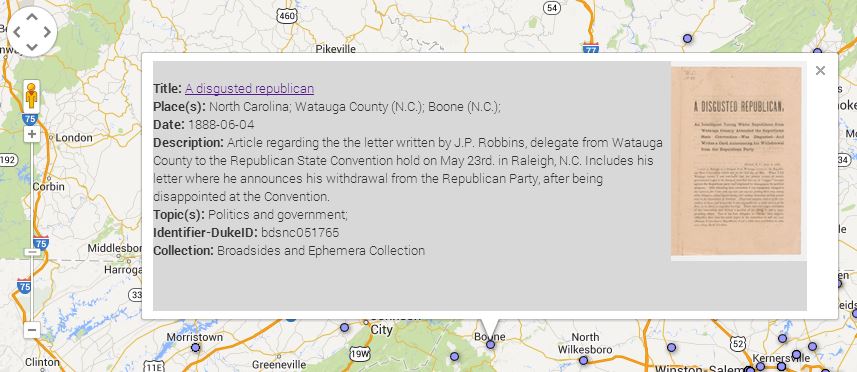
Once the geocoding process is complete, you’re left with a map that features a placemark for every place term the service was able to geocode. If you click on any of the placemarks, you’ll see a pop-up information window that, by default, lists all of the other metadata elements and values associated with that record. You’ll notice that the field labels in the info window match the column headers in your spreadsheet. You’ll probably want to tweak some settings to make this info window a little more user-friendly.
Step 4: Make some simple tweaks to add images and clickable links to your map
To change the appearance of the information window, select the “change” option under the map tab then choose “change info window.” From here, you can add or remove fields from the info window display, change the data labels, or add some custom HTML code to turn the titles into clickable links or add thumbnail images. If your spreadsheet contains any sort of URL, or identifier that you can use to reliably construct a URL, adding these links and images is quite simple. You can call any value in your spreadsheet by referencing the column name in braces (e.g. {Identifier-DukeID}). Below is the custom HTML code I used to style the info window for my Broadsides map. Notice how the data in the {Identifier-DukeID} column is used to construct the links for the titles and image thumbnails in the info window.

Step 5: Publish your map
Once you’re satisfied with you map, you can share a link to it or embed the map in your own web page or blog…like this one. Just choose tools->publish to grab the link or copy and paste the HTML code into your web page or blog.
To learn more about creating maps in Google Fusion Tables, see this Tutorial or contact the Duke Library’s Data and GIS Services.
Since I wrote this post, I’ve noticed some (minor?) issues with the map and identified some known limitations with using Fusion Tables for mapping:
Thank you for this, Noah.
I recently needed to make a map of the US with the states colored one of 3 different colors to indicate 3 levels of an attribute (think of a blue state/red state map). I had a tough time finding free software to do it, and used a pretty clunky program in the end. Do you have recommendations for this task? I am on the medical side, and we aren’t allowed to use Google Docs.
Perri,
You can definitely do this in Fusion Tables (if you’re allowed to use it). There is a freely available data set of state boundaries that you can merge with any data you have, matching on state names. Here is a link to some free datasets: https://support.google.com/fusiontables/answer/1182141?hl=en
An an example, I merged the “State Boundaries for the USA” dataset at the link above with some population data from Wikipedia.
Here is a map that color codes each state based on population values:
https://www.google.com/fusiontables/DataSource?docid=1_8FwWaDkiHeUfzms4jCE-ImLSjIm2RFPCUria_sv
In Fusion Tables, you can set the Polygons->Fill Color->Buckets feature to handle the three levels of some attribute you have. In my example, I used three shades of red to indicate population ranges for each state.
This took about 10 minutes in Fusion Tables
Hi Perri,
To second Amanda’s comment, if you have sensitive data, you probably are better off using a tool like QGIS or ArcGIS (which we have access to here at Duke) that can be downloaded to your computer and used without making your data public. There are lots of mapping tools, though, and if you need any help, feel free to get in touch with Data & GIS Services (http://library.duke.edu/data/)!
Perri: I’ve used QGIS 2.0 to make maps of this kind. You can download free GIS layers at http://www.diva-gis.org/Data, and using those you can incorporate many different layer options (e.g., state/county level USA). I haven’t used the FusionTables approach, but for those able to use google tools it sounds like a good option. Hope that helps!